EURAUD LOCAL SHORT|
✅EURAUD Price reached a premium supply level, engineered liquidity above equal highs, and confirmed bearish displacement. Expect continuation lower as smart money targets sell-side liquidity below. Time Frame 3H.
SHORT🔥
✅Like and subscribe to never miss a new idea!✅
Smartmoneyconcept

GBP-USD Free Signal! Sell!
Hello,Traders!
GBPUSD tapped into a premium supply zone, creating a liquidity grab above equal highs and forming bearish displacement—confirming order block mitigation.
---------------------
Stop Loss: 1.3166$
Take Profit: 1.3110$
Entry Level: 1.3144$
Time Frame: 2H
---------------------
Sell!
Comment and subscribe to help us grow!
Check out other forecasts below too!
Disclosure: I am part of Trade Nation's Influencer program and receive a monthly fee for using their TradingView charts in my analysis.

EURUSD CORRECTION AHEAD|SHORT|
✅EURUSD retraced into a premium supply level after a clear bearish displacement, mitigating an order block and collecting liquidity above short-term highs. Expect continuation toward the downside. Time Frame 3H.
SHORT🔥
✅Like and subscribe to never miss a new idea!✅

GOLD Local Short! Sell!
Hello,Traders!
GOLD tapped into a premium supply zone, engineering liquidity above equal highs before showing bearish displacement. Expect a continuation move toward the downside imbalance. Time Frame 5H.
Sell!
Comment and subscribe to help us grow!
Check out other forecasts below too!
Disclosure: I am part of Trade Nation's Influencer program and receive a monthly fee for using their TradingView charts in my analysis.

XAU/USD – Smart Money Awakens, Targeting Premium Liquidity ZonesGold has shown a powerful Change of Character (CHoCH) on the H4 timeframe — signaling a potential shift in short-term market structure. After sweeping liquidity beneath 3,940, price rebounded decisively, breaking minor highs and forming a Break of Structure (BOS) around 3,981 — a clear footprint of Smart Money re-entry at discount levels.
💭 1️⃣ Market Structure – From Weakness to Strength
For several sessions, Gold moved within a declining structure, printing lower highs and lower lows. However, the recent BOS and CHoCH indicate that the bearish momentum is fading.
Smart Money seems to have absorbed liquidity below 3,940 — where retail sellers were trapped — and is now repositioning for a possible move toward premium supply zones above 4,030.
The key structure level 3,981 – 3,948 now acts as the accumulation base, where institutional buy orders were likely placed.
🩶 2️⃣ Supply & Demand – The Footprints of Smart Money
Karina identifies three critical levels shaping this next movement:
Demand Zones:
3,981 – 3,948: Recent bullish order block (H4) and structural demand zone — price should ideally retest this before expanding higher.
3,937: Deep liquidity pocket from previous sweep; if retested, it could be a strong re-entry area for Smart Money.
Supply Zones:
4,030 – 4,047: A key bearish order block (OB) and first liquidity magnet for buyers.
4,047 – 4,051: Final buy-side liquidity zone, where price could face institutional distribution.
🧭 3️⃣ Liquidity Context – When the Market Breathes Before Expansion
The sell-side liquidity at 3,886 has already been taken, leaving buy-side liquidity resting above 4,030+.
This suggests the next directional play is upward, targeting premium levels to rebalance inefficiency and collect orders before any deeper retracement.
Karina expects price to potentially pull back to 3,981 – 3,948, find support, then push toward 4,047 – 4,051 before reacting downward — a classic SMC retracement-expansion pattern.
🌙 4️⃣ Trading Outlook – Align With Institutional Flow
Bias: Short-term bullish into supply; mid-term neutral awaiting distribution.
Scenario:
If Gold retests 3,981 – 3,948 and forms a bullish confirmation (rejection wick or engulfing candle), Smart Money likely aims for the 4,030 – 4,051 region.
Entry Zone: 3,948 – 3,981
Stop Loss: below 3,937
Take Profit: 4,047 – 4,051
This setup offers a clean 1:4 R:R, aligning perfectly with liquidity-based execution principles.
🌷 5️⃣ Reflection – When the Market Speaks Softly, Smart Money Listens Closely
Gold is whispering signs of strength after weeks of uncertainty. For Karina, this is a phase of quiet accumulation — not chaos, but calm intent.
In moments like these, patience becomes power 🌙 — and the most elegant trades often come from listening, not chasing.
This analysis reflects Karina’s personal perspective and is not financial advice.
Do you think Gold will sweep the 4,050 liquidity before reversing? Let’s discuss below 💬

AUD/USD – Smart Money Building Quietly at the BottomThe AUD/USD pair is trading around 0.6510, consolidating after an extended bearish move. From a Smart Money Concept (SMC) perspective, price action suggests that institutional players may be absorbing liquidity at discounted prices, hinting at a potential accumulation phase before driving price upward to collect liquidity at higher zones.
💭 1️⃣ Market Structure – When Price Pauses to “Take a Breath”
Following a series of bearish legs, AUD/USD has formed a Market Structure Shift (MSS) near the 0.6460 zone, signaling early signs of weakening bearish momentum.
Currently, price is holding within 0.6500 – 0.6510, forming a stable base of support. If this structure holds, it may serve as the foundation for a short-term bullish correction targeting the upper supply zones.
Each dip into the lower range has shown long lower wicks and narrow candle bodies — a classic footprint of Smart Money absorbing sell-side liquidity in preparation for accumulation.
🩶 2️⃣ Supply & Demand Zones – Footprints of Smart Money
Karina is closely monitoring three key structural zones:
Demand Zones:
0.6462 – 0.6432: A strong demand base where price has reacted multiple times — likely a zone of institutional accumulation.
0.6504: A short-term demand area currently being tested, acting as the first layer of support.
Supply Zones:
0.6570: A local supply zone where price may react upon retracement.
0.6642 – 0.6667: A higher supply zone filled with resting buy-side liquidity — potential target area for the next institutional move.
🧭 3️⃣ Liquidity Context – When Smart Money Buys Low to Sell High
The liquidity landscape shows that sell-side liquidity has already been swept near 0.6460, while buy-side liquidity remains untouched around 0.6618 – 0.6707.
This aligns perfectly with a common SMC narrative:
Smart Money absorbs liquidity below → builds structure → drives price upward to collect liquidity above.
If price maintains structure above 0.6504 – 0.6462, we could see a bullish displacement toward the next liquidity pools around 0.6570 and 0.6640 – 0.6660.
🌙 4️⃣ Trade Scenario – Follow Smart Money, Don’t Fight It
Karina’s current bias favors buying from discount zones once structure confirms a shift.
Entry: 0.6465 – 0.6500
Stop Loss: below 0.6430
Take Profit: 0.6570 – 0.6660
This setup aligns with institutional logic — buy where Smart Money accumulates, take profit where they distribute.
🌷 5️⃣ Reflection – When the Market Is Quiet, Institutions Are Working
The market doesn’t need loud volatility to tell a story — often, quiet accumulation speaks the loudest.
To Karina, this phase is about patience and observation — letting structure reveal its intent instead of rushing into noise.
Right now, the market feels like it’s taking a deep breath before its next move. Smart Money usually moves in silence — they buy low, and sell high. 🌸

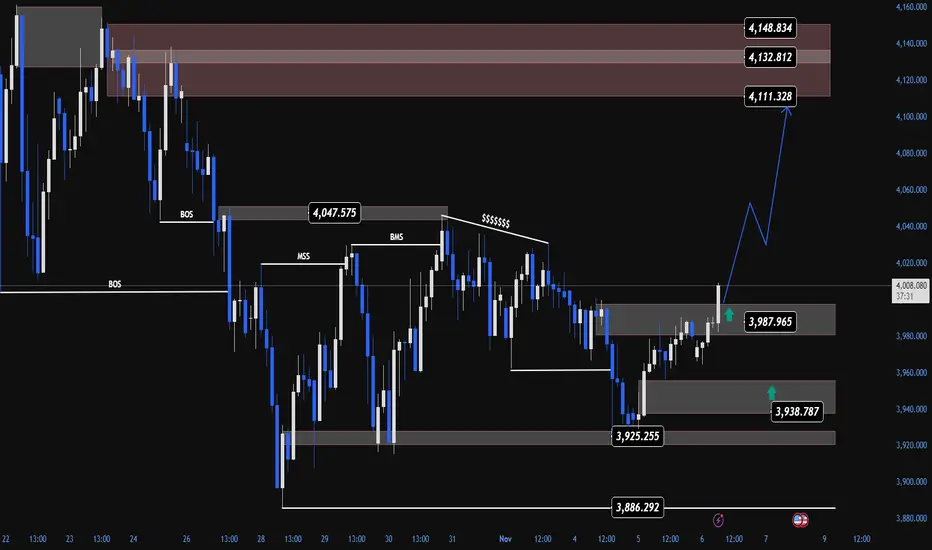
GOLD Smart Money Might Be Preparing for Bullish Structure ShiftGold (XAU/USD) is showing early signs that Smart Money may be shifting from a distribution phase into a short-term accumulation phase.
After a strong bearish leg marked by multiple Breaks of Structure (BOS), recent price behavior now suggests the potential formation of a Market Structure Shift (MSS) — an early indication that institutional flow could be changing direction.
💭 1️⃣ Market Structure – When the Market “Whispers” About Reversal
On the H1 timeframe, we can clearly observe a chain of consecutive BOSs since the 4,150 zone, but what’s intriguing is the reaction around 3,925 – 3,940.
Here, price failed to make new lower lows and began rejecting strongly — leaving several rejection wicks that reveal smart money absorption at discounted prices.
This area represents the discount zone of the current range — where institutions often collect liquidity from trapped sellers before pushing price toward premium levels for redistribution.
The latest Break of Market Structure (BMS) around 3,987 confirms that bearish momentum is weakening, and buyers may be starting to reclaim control in the short term.
🩶 2️⃣ Supply & Demand Zones – Footprints of Smart Money
Karina is currently watching three key zones shaping this market phase:
Demand Zones:
3,938 – 3,925: A strong demand base formed after the initial push upward — acting as a key support if price retraces.
3,986 – 3,988: A minor demand zone formed post-BMS, serving as a potential “reaccumulation point” for the next bullish leg.
Supply Zones:
4,111 – 4,149: Unmitigated Bearish Order Block from the previous decline — the most probable upside target for Smart Money in the current swing.
The projected SMC scenario: Smart Money accumulates at demand → builds liquidity → drives price into the upper supply zones.
🧭 3️⃣ Liquidity Context – Quiet but Purposeful Movement
Gold currently sits within a liquidity equilibrium — a transitional area where both buy- and sell-side liquidity coexist.
Below, 3,886 remains a pocket of sell-side liquidity, while above, large buy-side liquidity pools rest around 4,110 – 4,150.
Smart Money may first collect the remaining sell-side liquidity before triggering a strong upward displacement toward the upper supply zones — following the familiar pattern:
liquidity sweep → displacement → continuation.
🌙 4️⃣ Trade Scenario – Flow With Smart Money, Not Against It
As long as price holds above 3,938 – 3,987, the short-term bias for Karina is bullish.
If price retests these demand zones and forms bullish confirmations (e.g., bullish engulfing or clear order flow shift), it may set the stage for a push toward the 4,111 – 4,148 region.
Entry: 3,938 – 3,987
Stop Loss: 3,925
Take Profit: 4,111 – 4,148
This setup presents roughly a 1:4 R:R, consistent with a buy-side liquidity grab strategy under SMC principles.
🌷 5️⃣ Reflection – When the Market Moves in Silence
After an extended bearish phase, Gold now seems to be accumulating strength in quiet preparation.
This is not a loud reversal — it’s a subtle rebalancing of institutional flow.
To Karina, the market right now feels like a slow, gentle rhythm — calm, deliberate, and full of hidden intent. Sometimes, the key isn’t chasing volatility, but listening to the whispers of Smart Money in the silence of price action. 🌸
This analysis reflects Karina’s personal perspective and is not financial advice.
Do you see the same structure forming? Could this be the early stage of a bullish cycle, or just another liquidity grab? Let’s discuss below 💬
BTCUSDT Review November 6 2025Short-term price movement ideas.
The price has made a monthly liquidity grab of the high, which with high probability should lead us toward the monthly long FVG. At the moment, we’ve seen a weekly liquidity sweep on the long side and left equal lows just before the monthly FVG.
The nearest area from which we can expect a continuation of the downward movement is the daily FVG and BtS zone. In case of a test of one of these zones and confirmation on a lower timeframe, short positions can be considered with the target of taking out the previous low.
Be flexible, adapt to the market, and the results will come quickly. Good luck to everyone.

NZDCAD WILL FALL|SHORT|
✅NZDCAD has pulled back into a premium supply zone after a displacement leg that broke structure. Liquidity above internal highs has likely been swept—expect a move toward the next imbalance. Time Frame 3H.
SHORT🔥
✅Like and subscribe to never miss a new idea!✅

GBP-AUD Will Keep Falling! Sell!
Hello,Traders!
GBPAUD is forming a clear bearish wedge, showing distribution inside a premium zone. Once liquidity above internal highs is swept, expect a displacement toward the downside. Time Frame 4H.
Sell!
Comment and subscribe to help us grow!
Check out other forecasts below too!
Disclosure: I am part of Trade Nation's Influencer program and receive a monthly fee for using their TradingView charts in my analysis.

SILVER FREE SIGNAL|SHORT|
✅SILVER Price is reacting from the supply level after a strong retracement, confirming sellers’ presence. Expect a move toward the $47.80 target area.
—————————
Entry: $48.20
Stop Loss: $48.45
Take Profit: $47.80
Time Frame: 2H
—————————
SHORT🔥
✅Like and subscribe to never miss a new idea!✅

US100 Free Signal! Sell!
Hello,Traders!
US100 is expected to soon retest the horizontal supply area before continuing its bearish move toward the target zone.
---------------------
Stop Loss: 25,877$
Take Profit: 25,607$
Entry: 25,728$
Time Frame: 2H
---------------------
Sell!
Comment and subscribe to help us grow!
Check out other forecasts below too!
Disclosure: I am part of Trade Nation's Influencer program and receive a monthly fee for using their TradingView charts in my analysis.

USOIL LOCAL LONG|
✅WTI OIL is expected to bounce from the demand level near $60.00, targeting the $60.70 resistance zone as bullish momentum builds. Time Frame 3H.
LONG🚀
✅Like and subscribe to never miss a new idea!✅

EUR-AUD Local Short! Sell!
Hello,Traders!
EURAUD Price rejected the horizontal supply area, confirming bearish pressure. A continuation toward 1.7650 target is expected as liquidity below recent lows attracts price. Time Frame 3H.
Sell!
Comment and subscribe to help us grow!
Check out other forecasts below too!
Disclosure: I am part of Trade Nation's Influencer program and receive a monthly fee for using their TradingView charts in my analysis.

The Market Is Still in Distribution, but Smart Money Moves QuietGold is trading around $3,990, recovering slightly after last week’s sharp sell-off. However, from a Smart Money Concept (SMC) perspective, the market structure continues to show clear bearish intent — with lower highs, unmitigated supply zones, and descending liquidity still controlling price flow.
💭 1️⃣ Market Structure – The Bearish Flow Remains Intact
After several BOS (Break of Structure) and CHoCH (Change of Character) confirmations, the bullish attempts are getting weaker.
Price remains capped under a clean descending trendline, showing how sellers are gradually stepping in at every premium retracement level.
The current market is operating within a distribution phase, where Smart Money continues to build short positions above liquidity zones while trapping late buyers inside minor pullbacks.
The key level 4,043 – 4,050 stands out as the nearest Bearish Order Block (OB) and strong short-term supply. Until this area is decisively broken, Gold remains technically bearish.
🩶 2️⃣ Supply Zones – Where Smart Money Left Their Footprints
Karina is currently watching three critical supply layers:
4,043 – 4,050: Active supply zone aligning with trendline confluence – ideal for short-term sell setups.
4,149 – 4,160: A deeper liquidity pocket where Smart Money previously distributed heavy positions.
4,221 – 4,359: Major macro supply zones – where institutional orders were likely built during October’s highs.
Price is still well below these regions, suggesting that any rally remains corrective rather than impulsive.
🧭 3️⃣ Liquidity Context – The Path of Least Resistance
Below current price, 3,884 – 3,890 forms the next liquidity magnet — a cluster of equal lows and inefficiency gaps that Smart Money might target next.
Above, resting buy-side liquidity around 4,050 gives institutions a perfect opportunity to engineer a small push up before resuming the main downtrend.
This is the same pattern we’ve seen repeatedly: liquidity grab → displacement → continuation.
🌙 4️⃣ Trading Scenario – Flow With the Institutions, Not Against Them
As long as the structure remains below the trendline, Karina maintains a bearish bias.
If price retests 4,043 – 4,050 and shows rejection through a bearish engulfing or sharp rejection wick, short setups will align with SMC logic.
Entry: 4,043 – 4,050
Stop Loss: 4,060
Take Profit: 3,884 – 3,890
The setup offers a clean 1:4 R:R, based purely on structure and liquidity flow — no indicators, no noise.
🌷 5️⃣ Reflection – When Silence Speaks Louder Than Volatility
Gold’s current rhythm is calm yet calculated. Every retracement feels like a whisper from Smart Money — testing patience, not conviction.
For Karina, this is the phase where discipline matters most.
While many chase impulsive moves, Smart Money quietly prepares for the next wave, and the charts tell their story to those patient enough to listen. 🌙
This analysis reflects Karina’s personal view and is not financial advice.
What do you see in today’s Gold structure? Is this retracement a calm before another drop, or the beginning of accumulation? Let’s discuss below 💬

USD-JPY Will Keep Growing! Buy!
Hello,Traders!
USDJPY continues its strong uptrend after tapping into the horizontal demand area, showing clear bullish momentum toward 154.200 target zone. Time Frame 6H.
Buy!
Comment and subscribe to help us grow!
Check out other forecasts below too!
Disclosure: I am part of Trade Nation's Influencer program and receive a monthly fee for using their TradingView charts in my analysis.

GBPAUD BEARISH WEDGE PATTERN|SHORT|
✅GBPAUD price is consolidating in a bearish wedge after a sharp drop, suggesting continuation toward the 1.9950 target zone once support breaks. Time Frame 5H.
SHORT🔥
✅Like and subscribe to never miss a new idea!✅

BITCOIN Correction Ahead! Buy!
Hello,Traders!
BITCOIN fell down sharply today, but the price is now hitting the horizontal demand level and we are already seeing some early rejection signs, so as the coin is oversold, a local bullish correction is to be expected. Time Frame 12H.
Buy!
Comment and subscribe to help us grow!
Check out other forecasts below too!
Disclosure: I am part of Trade Nation's Influencer program and receive a monthly fee for using their TradingView charts in my analysis.

GOLD MASSIVE DEMAND LEVEL BELOW|LONG|
✅XAUUSD Price is about to retest a massive demand area after a clean downside move. A strong bullish reaction could send it toward 3,960$ as a short-term target. Time Frame 2H.
LONG🚀
✅Like and subscribe to never miss a new idea!✅

SPY DEMAND LEVEL BELOW|LONG|
✅SPY tapped into the demand level and printed bullish reaction wicks, signaling a short-term rebound toward 678$. Liquidity above minor highs could be targeted. Time Frame 2H.
LONG🚀
✅Like and subscribe to never miss a new idea!✅

GOLD Free Signal! Buy!
Hello,Traders!
GOLD Price has tapped into a strong horizontal demand area, showing early signs of bullish rejection. Buyers may aim toward 3,970$ as the next liquidity target.
-------------------
Stop Loss: 3,915$
Take Profit: 3,970$
Entry: 3,940$
Time Frame: 2H
-------------------
Buy!
Comment and subscribe to help us grow!
Check out other forecasts below too!
Disclosure: I am part of Trade Nation's Influencer program and receive a monthly fee for using their TradingView charts in my analysis.

AUD-CHF Bullish Bias! Buy!
Hello,Traders!
AUDCHF is reacting from the horizontal demand area, showing signs of bullish intent. If the level holds, we could see a continuation toward 0.5280$. Time Frame 3H.
Buy!
Comment and subscribe to help us grow!
Check out other forecasts below too!
Disclosure: I am part of Trade Nation's Influencer program and receive a monthly fee for using their TradingView charts in my analysis.

NZDJPY FREE SIGNAL|LONG|
✅NZDJPY Price has tapped into the demand level with a clean rejection wick, signaling potential short-term bullish reversal toward 87.40. Liquidity resting above equal highs could attract price.
—————————
Entry: 86.95
Stop Loss: 86.64
Take Profit: 87.40
Time Frame: 2H
—————————
LONG🚀
✅Like and subscribe to never miss a new idea!✅
