Bitcoin - When History RhymesMarket Context and Historical Symmetry
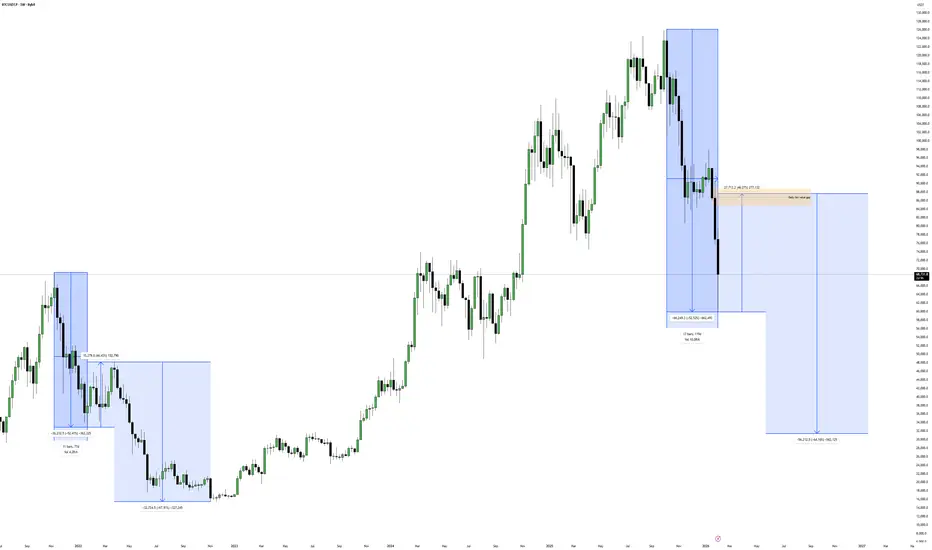
Bitcoin has a tendency to move in recognizable cycles, and what stands out right now is the near-perfect similarity between the previous bull market correction and the current one. During the 2021 cycle, price retraced approximately 52% from the all-time high before establishing a mid term bear market low. That level ultimately became the foundation for the next impulsive expansion.
Fast forward to today, and we are seeing almost the exact same percentage decline from the 2025 all-time high. A 52% correction is not just a random statistic, it reflects a deep but structurally healthy retracement within a broader macro trend. When markets repeat this type of behavior, it often signals that larger participants are positioning rather than abandoning the trend entirely.
Why the Current Zone Matters
The present price region is technically significant because it represents both psychological and structural support. Sharp selloffs typically aim to force weak hands out of the market, while stronger capital accumulates at discounted prices.
If this level holds, it strengthens the narrative that Bitcoin may already be forming its mid term bear market low. What makes this especially compelling is the speed of the decline, capitulation-style moves often precede powerful relief rallies as liquidity flips direction.
This is not about predicting an immediate reversal, but about recognizing that the risk-to-reward profile begins to improve dramatically after a correction of this magnitude.
The 46% Relief Rally Scenario
After the 2021 mid term low was established, Bitcoin rallied roughly 46%. If price were to mirror that behavior again, a similar percentage move from the current low would drive price directly into the Daily Fair Value Gap left behind during the aggressive leg down.
This alignment is important.
Fair Value Gaps act as magnets for price because they represent inefficiencies created by institutional urgency. Markets frequently revisit these zones to rebalance order flow before deciding on the next directional move.
A 46% expansion into that imbalance would not only be technically clean, it would also reflect classic cycle behavior, sharp drop, strong relief rally, then continuation.
Daily Imbalance as the Technical Target
The daily FVG overhead is more than just a chart feature, it represents unfinished business. When price leaves a gap during displacement, it often returns to mitigate it before larger players re-engage.
Should Bitcoin rally into this region, traders should pay close attention to price behavior inside the gap. Acceptance above it would suggest stronger-than-expected bullish momentum, while rejection would reinforce the idea that the broader corrective phase is not yet complete.
Confluence between the historical 46% rebound and the location of this imbalance gives the upside scenario additional credibility.
Cycle Continuation and the 34K Projection
If Bitcoin continues to respect the previous cycle structure, the relief rally would likely be followed by another leg lower. Historically, markets rarely bottom in a single move, they tend to form complex accumulation ranges with multiple expansions and retracements.
Following the analog, a rejection from the daily imbalance could send price toward the 34K region. That area would become a logical candidate for a higher timeframe accumulation phase, especially if liquidity builds beneath it.
This type of sequence, capitulation, relief rally, secondary drop, is characteristic of mid cycle bear markets rather than full macro reversals.
Conclusion
The striking similarity between the previous 52% correction and the current one provides a powerful framework for anticipating potential price behavior. While no cycle repeats perfectly, markets often echo prior structures because participant psychology remains constant.
A relief rally of roughly 46% into the daily Fair Value Gap would be the first confirmation that history may be rhyming once again. From there, traders should remain prepared for volatility, as a subsequent move toward the 34K region could complete the broader corrective pattern before the next major expansion begins.
Recognizing these patterns early allows traders to shift from emotional reactions to strategic positioning, which is ultimately where consistency is built.
___________________________________
Thanks for your support!
If you found this idea helpful or learned something new, drop a like 👍 and leave a comment, I’d love to hear your thoughts! 🚀
Smartmoneyconcepts
BTCUSDT Review February 06 2026Long-term price movement opinions
At the moment, price has entered its strongest support zone. This is the manipulation of the previous all-time high, followed by consolidation inside this area before a potential move toward a new high. In fact, the current zone will define the next major direction.
I see two possible scenarios.
The first, and less likely, scenario is an aggressive rebound above the 74,000 level within this month, followed by a strong acceptance and consolidation above it. This would create the conditions for the continuation of the uptrend.
The second, and more likely, scenario is price stalling and entering a prolonged consolidation phase, potentially lasting for months, as we have seen before. This would involve a break of the monthly structure, the formation of new areas of interest to the downside, their subsequent testing or manipulation within them, and a continuation of the broader bearish move.
If you are currently trying to guess whether we are in a bull market or a downtrend, this is not the moment to make rushed decisions. It is better to allow price to develop, at least within the scope of this month, and then evaluate which of the two scenarios has played out.
Personally, I have been on the bearish side for quite some time, and this type of price action only reinforces my narrative. If the second scenario unfolds, I will completely dismiss the possibility of further upside.

Bitcoin - Sweep, Reclaim, Then Continuation Lower?Higher Timeframe Context
Price continues to respect a broader bearish structure, with lower highs forming after the previous distribution phase. The recent downside expansion did not occur randomly, it aligned with higher timeframe weakness and persistent sell-side pressure. Even though support has reacted before, the overall order flow still favors sellers until proven otherwise. This keeps any upside move categorized as corrective rather than a true shift in trend.
Liquidity Event and Support Reclaim
The key technical development here is the sweep of a weekly low followed by a close back above it and inside a strong weekly support zone. This type of behavior often signals engineered liquidity rather than genuine acceptance below the level. When price quickly reclaims support after taking stops, it typically creates the fuel for a relief move, as trapped shorts begin to cover and responsive buyers step in.
Short-Term Repricing Potential
With liquidity now collected from below, price has room to rotate higher in the near term. The path above contains inefficiencies that remain unfilled, particularly the daily imbalance that sits overhead. Markets tend to revisit these gaps as part of delivery, especially after a sweep and reclaim sequence. In addition, a cluster of lower timeframe consolidation rests in that same region, making it an attractive draw for price before any larger directional decision.
Confluence With Lower Timeframe Targets
The projected push higher is not expected to mark a bullish reversal, but rather a controlled retracement into areas where liquidity is resting. A sweep of the intraday consolidation would effectively reset positioning and potentially provide higher timeframe sellers with improved entry locations. When corrective rallies move into imbalance while the macro structure remains bearish, they often transition into continuation legs once the rebalancing is complete.
Why The Bearish Bias Remains Intact
Despite the strong reaction from support, nothing in the current structure suggests a confirmed shift in market direction. The broader pattern still points downward, and rallies should be viewed through the lens of distribution until market structure decisively changes. If price delivers into the overhead targets and begins to show rejection, it would reinforce the idea that the recent reclaim was simply a setup for continuation rather than accumulation.
Conclusion
The sweep and reclaim of weekly support opens the door for a temporary move higher, primarily driven by imbalance fills and liquidity resting within nearby consolidations. However, with the higher timeframe structure still leaning bearish, the expectation is for this relief rally to eventually exhaust itself and transition into another leg lower.
___________________________________
Thanks for your support!
If you found this idea helpful or learned something new, drop a like 👍 and leave a comment, I’d love to hear your thoughts! 🚀

SOLUSD Under Pressure | Liquidity Points in FocusSolana (SOLUSD) is currently trading in a bearish market structure, with price respecting the range high resistance and failing to reclaim the range midpoint (~107.30).
After a clear Break in Market Structure (BMS), price expanded lower, leaving multiple Fair Value Gaps (FVGs) on the upside. These unfilled imbalances indicate that upside moves are likely to face selling pressure.
Recent price action shows:
Buy-side liquidity taken near internal highs
Strong rejection from internal supply & FVG zones
Price shifting back toward sell-side liquidity
As long as SOL remains below the range mid and prior highs, the higher-probability scenario favors a continuation toward lower liquidity zones, with a potential reaction from demand after liquidity is swept.
📉 Bias: Bearish
📌 Key Focus: Sell-side liquidity → possible short-term reaction
❌ Invalidation: Acceptance above range mid and structure high
⚠️ This idea is based purely on technical analysis and price behavior, not financial advice.

ETHUSD Liquidity in ControlEthereum (ETHUSD) is currently trading in a negative higher-timeframe range, with price respecting the range high resistance and showing continued weakness below the range midpoint (~2291).
Following a clear Break in Market Structure (BMS), price expanded lower and formed multiple Fair Value Gaps (FVGs) on pullbacks. These FVG zones are acting as supply areas, where price continues to face rejection.
Key observations from recent price action:
Buy-side liquidity taken near the upper internal range
Rejection from discounted FVG zones inside the range
Price reacting from sell-side liquidity near range lows
Currently, ETH is consolidating after a downside sweep, suggesting the market is in a rebalancing phase. As long as price remains below the range mid and prior highs, the broader bearish structure remains intact, with volatility likely driven by liquidity interaction.
📌 Market Context:
HTF Bias: Bearish
Environment: Range → Liquidity Driven
Focus: FVG reaction & liquidity levels
⚠️ This chart analysis is for educational and technical discussion only, not financial advice.

Why Silver Traps Traders More Than GoldSilver (XAGUSD) is often called “Gold on steroids”, but that extra volatility is exactly why many traders get trapped. Compared to Gold (XAUUSD), Silver behaves more aggressively, emotionally, and unpredictably—especially around key levels. Understanding why Silver traps traders more than Gold can help you build better market awareness and avoid common mistakes.
1. Higher Volatility Creates False Confidence
Silver moves faster than Gold. Sharp spikes and deep pullbacks create the illusion of strong momentum.
Many traders enter too early, assuming continuation, but Silver frequently reverses after attracting liquidity, trapping late buyers or sellers.
Key learning:
Fast movement does not always mean strong direction.
2. Thin Liquidity = Sudden Manipulative Moves
Compared to Gold, Silver has lower liquidity. This allows price to be pushed more easily around:
Previous highs & lows
Equal highs / equal lows
Trendline breaks
These areas often become liquidity pools, where retail traders enter and smart money exits.
3. Fake Breakouts Are More Common in Silver
Silver is famous for:
Breaking resistance → failing instantly
Breaking support → snapping back inside range
Gold tends to respect levels more cleanly, while Silver often uses fake breakouts to trap breakout traders.
4. Emotional Trading Bias in Silver
Because Silver is cheaper than Gold, traders often:
Over-leverage positions
Ignore risk management
Trade lower timeframes impulsively
This emotional participation increases trap probability, especially during news or high-volatility sessions.
5. Silver Reacts Sharply to News & USD Moves
Silver is highly sensitive to:
USD strength
Inflation expectations
Industrial demand news
Even small macro changes can cause violent spikes, wiping out poorly planned trades.
6. Gold Is Structured, Silver Is Aggressive
Gold generally respects:
Clean structure
Clear trends
Institutional levels
Silver, on the other hand:
Whipsaws inside ranges
Hunts stops aggressively
Punishes impatience
This structural difference is why beginners struggle more with Silver.
How Traders Can Avoid Silver Traps (Education Only)
Focus on higher-timeframe structure
Wait for confirmation, not impulse
Treat breakouts with caution
Understand liquidity zones
Manage risk strictly
Silver rewards patience and experience—not aggression.
Final Thought
Silver is not bad—it’s honest but ruthless.
Those who rush get trapped.
Those who wait get clarity.
Trade what you understand, not what moves fast.

EURUSD Review February 04 2026Short-term price movement ideas.
Price has taken weekly liquidity, which was confirmed by volume on the daily chart in the form of an FVG. Together, this creates conditions for a corrective move. At the moment, price is trading inside the daily FVG and is sweeping the H4 high, which acts as a trigger. If confirmation appears on the H1 chart, a short position can be considered, targeting a new low.
Be flexible, adapt to the market, and the results will come quickly. Good luck to everyone.

BTCUSD Liquidity Reaction | Market Structure in FocusBitcoin (BTCUSD) is currently trading in a negative higher-timeframe range, with price holding below the range midpoint (~76,082) and respecting overhead resistance near the range high (~79,300).
After a clear Break in Market Structure (BMS), price delivered a corrective move higher but failed to sustain momentum, leaving Fair Value Gaps (FVGs) on both sides of the range. Recent price action shows a strong sell-side liquidity sweep, followed by a short-term consolidation inside an internal FVG.
Key observations:
Sell-side liquidity taken below internal lows
Reaction from discount demand zone
Price consolidating below prior structure and range mid
Upper FVG acting as short-term resistance
This behavior suggests the market is in a rebalancing phase, where liquidity is being redistributed. As long as price remains below the range midpoint and prior highs, the broader bearish structure stays intact, while volatility is driven by liquidity interaction.
📌 Market Context:
HTF Bias: Bearish
Environment: Range → Liquidity driven
Focus: FVG reaction & liquidity zones
⚠️ This analysis is shared for educational and technical purposes only.

NAS100 Liquidity Mapping | Institutional Price ActionNAS100 is currently trading within a positive higher-timeframe range, while recent price action shows a clear reaction from sell-side liquidity followed by consolidation.
After a Change of Character (CHoCH) near the lower range, price delivered a strong impulsive move higher, creating multiple Fair Value Gaps (FVGs) across the range. These imbalances are now acting as key reaction zones, where price is pausing and rebalancing.
Recent observations:
Sell-side liquidity swept near range lows
Strong response from discount FVG areas
Rejection from upper FVG near prior liquidity high (LH)
Price is currently holding above internal support, suggesting the market is building structure. As long as price remains above the lower range, the path toward higher liquidity remains open.
📌 Market Context:
HTF Bias: Positive
Phase: Consolidation → Expansion
Focus: Liquidity & FVG interaction
⚠️ This analysis is based on technical price behavior only and is shared for educational purposes.

GBPJPY Bearish Breakdown | Smart Money Targets 208.00GBPJPY is currently trading inside a clear consolidation range, with price respecting a broad demand zone below while repeatedly rejecting a premium supply area near 214.80–215.00. This behavior strongly suggests distribution at highs and the potential for a sharp bearish continuation.
After a strong impulsive sell-off, price entered a sideways accumulation phase between 210.00–212.00, forming equal highs and weak bullish follow-through. The failure to reclaim the upper supply zone indicates that buyers are losing momentum.
📉 Market Structure & Price Action
Multiple rejections from daily supply (214.50–215.00)
Range-bound structure showing liquidity build-up
Price currently holding mid-range → ideal distribution zone
Bearish scenario favors a liquidity sweep above range highs followed by reversal
🧱 Key Levels
Major Supply / Resistance: 214.50 – 215.00
Internal Resistance: 212.50 – 213.20
Range Support: 210.00 – 209.50
Bearish Target (Demand): 208.00 – 207.20
📊 Momentum Insight
Histogram momentum shows weak bullish strength
Bearish pressure increases on rallies
Confirms sell-side dominance from higher prices
🔮 Outlook & Trade Idea
A potential fake breakout toward 214.00–215.00 could act as a final liquidity grab. If price rejects this zone, a strong impulsive drop toward 208.00 demand is highly probable, aligning with smart money distribution.

NAS100 Liquidity Grab & Distribution ExplainedNAS100 runs buy-side liquidity during active hours and fails to hold above premium supply. The move higher is corrective, not continuation. Under-hours price action suggests distribution, with lower highs forming and downside liquidity as the main objective.
📉 Bias: Bearish

Bitcoin - Outlook for the Upcoming WeeksMarket Overview
Bitcoin is currently trading under clear higher timeframe pressure after a strong reaction from a premium zone. Price tapped into a confluence area of weekly and monthly Fair Value Gaps and showed immediate rejection, confirming that sellers are active at these levels. This reaction shifts the broader outlook from neutral to bearish for the coming weeks, as price failed to accept above higher timeframe imbalance.
Higher Timeframe Context and FVG Rejection
The most important development is the clean rejection inside the overlapping weekly and monthly FVG. This zone acted as a high probability area for distribution, and the response validates it as a strong supply region. The rejection was decisive, with displacement to the downside, signaling that higher timeframe participants are likely defending this area and looking for lower prices.
Bearish CISD Formation
Following the rejection, price formed a bearish CISD, confirming that the move was not just a reaction but a structural shift. The CISD came after the liquidity interaction, aligning well with proper ICT sequencing. This adds confluence to the bearish case and suggests that the market is now in a sell side delivery phase rather than a corrective pullback.
Downside Targets and Liquidity Objectives
With structure now bearish, the primary expectation is continuation toward Target 1, which aligns with a key liquidity area below current price. If price accepts below this level, continuation toward Target 2 becomes likely, targeting deeper weekly liquidity and a strong demand zone that previously supported price. These areas are logical objectives for the current bearish leg.
Invalidation and Alternative Scenario
The bearish structure remains valid as long as price stays below the rejected weekly and monthly FVG zone. Any sustained acceptance back into and above that area would weaken the bearish narrative and signal potential range behavior instead. Until that happens, downside continuation remains the higher probability scenario.
Conclusion
Bitcoin rejected a major weekly and monthly FVG, formed a bearish CISD, and is now structurally aligned for further downside. The focus remains on Target 1 first, with Target 2 as a continuation objective if sell side momentum persists. Overall structure supports a bearish outlook for the upcoming weeks.
___________________________________
Thanks for your support!
If you found this idea helpful or learned something new, drop a like 👍 and leave a comment, I’d love to hear your thoughts! 🚀

GOLD 03/02: H4 ROUTE MAP – SMC STRUCTURE UPDATEGold prices have swept the peak liquidity and broken the upward structure on H4. But this is not the start of a new trend, rather a rebalancing phase after the sell-off. The next direction will depend on how prices react at key SMC zones.
CONTEXT
Expectations around the Fed and interest rate path remain unclear → USD and yields are highly volatile.
Geopolitical instability continues to provide a supportive backdrop for gold, but not enough to create a new trend on its own.
As a result: gold reacts strongly during the day, but there is no long-term commitment yet.
➡️ This explains why prices bounce quickly but have not broken the structure.
H4 TECHNICAL STRUCTURE
The previous H4 uptrend has been broken:
Sweep peak
CHoCH decline
Current prices are in a technical pullback after a strong decline.
FVG + Fibonacci zones are playing the role of the next decisive points.
ROUTE MAP – PRICE ZONES TO WATCH
🔴 UPPER ZONE – SELL REACTION ZONE
👉 5230 – 5300
H4 FVG
Fib 0.618 – 0.705
Typical pullback zone in a declining structure
➡️ If prices rebound here but are not accepted, the upward move is just a pullback to continue the decline.
👉 5350 – 5450
High FVG + Fib 0.786
Only if prices hold above this zone, the declining structure will truly be invalidated.
🟢 LOWER ZONE – BUY REACTION / SUPPORT
👉 4950 – 5000
Fib 0.5
Balance zone – likely to see two-way reactions
👉 4850 – 4900
Fib 0.382
H4 Demand – important support zone
👉 4600 – 4550
Liquidity low
Only activated if bearish continues strongly
HOW WE MONITOR THE MARKET NOW
In the current context:
News creates short-term momentum
But the H4 structure still guides the trend
We focus on:
Observing price reactions at FVG & fib
Clearly distinguishing:
daily reflex moves (scalp)
and structure acceptance for swing
Strong pullbacks often attract emotions, but the market only truly speaks the truth when it holds key price zones.
Future updates will focus on actual price reactions, not predictions. Follow to not miss important reaction points this week.
— LucasGrayTrading

NZDUSD Review February 03 2026Short-term price movement ideas.
The price maintains a bullish structure, with the monthly high as the primary target.
At the moment, the nearest daily bullish FVG has been fully filled, and we received confirmation from it on the 4H timeframe. This zone now acts as the main working area.
If the 4H zone is retested and confirmation appears on a lower timeframe, a long position can be considered, targeting a breakout and update of the high.
Be flexible, adapt to the market, and the results will come quickly. Good luck to everyone.

GBPUSD Bearish Breakdown | Smart Money Targets 1.3500GBPUSD has shifted from a strong bullish impulse into a clear corrective and distribution phase, signaling potential bearish continuation in the near term.
Price previously respected a rising structure, creating higher highs and higher lows. However, after tapping into a major supply zone near 1.3850, bullish momentum weakened significantly. Multiple rejections from this premium area confirm the presence of strong institutional selling pressure.
📉 Market Structure Breakdown
Price has broken below internal support around 1.3720–1.3700
Bearish candles with momentum show loss of bullish control
Structure now favors lower highs → bearish bias
🧱 Key Zones to Watch
Supply Zone (Resistance): 1.3800 – 1.3850
Broken Support / Flip Zone: 1.3720 – 1.3740
Major Demand Zone (Target): 1.3500 – 1.3480
📊 Indicator Confirmation
Histogram shows increasing bearish momentum
Momentum divergence aligns with the downside projection
Volume fades on pullbacks, favoring continuation lower
🔮 Price Outlook
A corrective pullback toward the 1.3740–1.3780 zone could offer selling opportunities. If price fails to reclaim this level, a strong bearish move toward 1.3500 demand is likely, as illustrated in the projected path.

EUR/USD: The "Wick of Truth" & The Philosopher's Stone ProtocolSymbol: EURUSD Bias: Short (Week of Feb 1 - Feb 6) Method: Fun-Tech Intel Scan & Vector Matrix Analysis
The Philosopher's Stone: As Above, So Below
To navigate the matrix, one must integrate Logic (The Mind) and Intuition (The Heart). The "Philosopher's Stone" of trading is realizing that the Micro (Price Action) always reflects the Macro (Institutional Flow). As Above, So Below.
While the long-term structure remains Bullish (Monthly Flag), the immediate "Below" (Weekly/Daily) signals a necessary correction. We do not fight the current; we flow with it.
I. The Fun-Tech Intel Scan (The "Why")
Our proprietary scan has identified a Regime Shift where the "Old Code" algorithms are misinterpreting data. We will exploit this latency.
1. The "Shutdown Glitch" (Political Vector)
The Narrative: Headlines this weekend will cite a "US Government Shutdown."
The Reality: This is a scheduling error (House Recess), not a crisis. The House will vote "Yes" on Monday.
The Trade: Legacy algorithms are programmed to Sell Euro/Buy USD on "Shutdown" headlines. We anticipate a Gap Down or heavy Sunday Open. However, the true opportunity lies in the Monday Relief Rally—when the "Old Code" buys the news, we will fade the move.
2. The "Yield Anomaly" (Institutional Vector)
The Observation: US 10-Year Yields are holding critical highs (4.27%+), diverging from the weakening long-term Dollar thesis.
The Logic: The market is currently rewarding the Dollar for high yields (Safety Trade), ignoring the underlying Debt Risk (Sovereign Risk). Until the market acknowledges the debt crisis (Long Term), we respect the short-term strength of the "High Yield" Dollar.
II. The Vector Matrix (The "Where")
Applying the God Code Formula, we have calculated the specific geometry for the week ahead.
1. The "Wick of Truth" (Technical Structure)
Observation: The Weekly Candle closed as a massive Inverted Hammer / Gravestone Doji.
Implication: The market spent five days attempting to break the 1.2000 psychological barrier and was rejected by institutional supply. This formation, occurring at a trend high, triggers a mandatory Liquidity Flush. The market must retreat to find buyers.
2. The Monthly Flag Support (The Target)
The Magnet: The Macro Bull Trend is intact, but it requires a retest of the breakout structure.
The Level: 1.1750. This aligns with the Monthly Bull Flag lower rail. This is where the "Smart Money" (and the EU Defense Bond flows) are waiting to reload Longs.
III. The Master Logistician's Trade Plan
Bias: Bearish (Short Term) / Bullish (Medium Term)
Sunday Open: Expect a Gap Down (approx. 1.1840). DO NOT CHASE. Let the "Shutdown" noise settle.
The Trap (Monday/Tuesday): Watch for a rally back into the 1.1890 – 1.1915 zone. This is the breakdown point.
Action: I am planning to SELL this rally. This is the "Judas Swing" trap.
Stop Loss: 1.1960 (Structural Invalidation above the Weekly Wick).
Target 1: 1.1830 (Daily Support).
Target 2 (The Golden Ratio): 1.1750 – 1.1760.
Note: This is the "Flip Zone." At 1.1750, we close Shorts and prepare for the next leg of the Monthly Bull Run.
Conclusion
The market is breathing. The Weekly Candle demands a sacrifice of liquidity before the Monthly Trend can resume. We operate with precision, neutrality, and the knowing that nothing is good or bad, unless we attach an emotion to it.
Plan the Trade <--> Trade the Plan = The only way I trade and last week I captured about 515 pips overall based on Planning the Trade and Trading the Plan
Compliance & Disclosure Protocol:
~ Educational Intent: This publication documents my personal "Fun-Tech" analysis and strategic planning for educational and journaling purposes only. It represents my own observation of the market matrix and is not financial advice, investment advice, or a solicitation to buy or sell any asset.
~ Risk Awareness: The "Vector Matrix" and "God Code" mentioned are personal proprietary frameworks used to map probabilities, not certainties. Foreign Exchange trading involves significant risk and is not suitable for all investors.
~ Liability: You are the sole architect of your financial decisions. I am an observer sharing my perspective of the flow. Always perform your own due diligence and manage your risk according to your own operating system.
Observe. Analyze. Decide.

XAUUSD: correction inside a strong bullish trendGold remains a key asset amid global uncertainty, easing monetary expectations, and sustained institutional demand. Current pullbacks are seen as liquidity redistribution rather than a trend reversal. As long as inflation and geopolitical risks persist, gold stays attractive.
Technically, price swept buy-side liquidity and entered a corrective phase. The 0.79–0.705 Fibonacci zone is the first reaction area. The primary scenario is consolidation above 4,680–4,600 followed by continuation toward 5,150–5,300. A deeper pullback may reach the strong demand zone at 4,400–4,300, aligned with long-term support. Market structure remains bullish; the move looks corrective.

Order Block Theory: Trading Institutional FootprintsStop drawing random trendlines. Banks do not look at your diagonal lines. Banks trade based on Liquidity and Equilibrium.
If you want to trade like a relentless machine in 2026, you must learn to spot the "Footprints" that institutions leave on the chart. These footprints are called Order Blocks (OB).
Today, we are moving beyond "Support and Resistance" and entering the world of Smart Money Concepts (SMC).
1. What is an Order Block?
When a massive institution (like BlackRock or a central bank) wants to buy $100 Million of Bitcoin, they cannot just click "Buy." It would spike the price instantly, giving them a terrible entry.
Instead, they manipulate the price.
They Sell heavily to drive the price down into a liquidity zone (inducing panic sellers).
They absorb all that panic selling with their massive Buy orders.
The price explodes upward.
The Footprint: That final "Sell Candle" before the explosion is the Bullish Order Block. It represents the institutional point of interest.
2. How to Identify a Valid OB
Not every candle is an Order Block. A valid OB must meet three criteria:
Violence: The move away from the candle must be explosive. It should leave behind a "Fair Value Gap" (FVG) or Imbalance (a gap where price moved too fast).
Break of Structure (BOS): The move must break a previous High (for bullish) or Low (for bearish). This proves the institutions are in control.
Unmitigated: The price has not returned to this level yet.
How to Spot Valid and Invalid Order Blocks
Not every order block is worth trading. Some levels look good on the chart but fail quickly when price comes back. Common signs of a weak or fake order block include:
*Price didn’t move away clearly after the block formed
*No push beyond a nearby high or low before the move
*The zone has already been tested or traded through (mitigation block)
*Price returns and moves straight through with little or no reaction
*The move looks slow or messy instead of clean and decisive
Bullish Order Block
A bullish order block is a price area where buying showed up just before a strong move up. It often appears near the end of a downward move, close to the last bearish candle before price starts rising.
When price comes back to this area, it may slow down or bounce, which is why traders often see it as a potential support zone.
Bullish OB: The last Red Candle (Down) before a violent Green Move (Up).
Bearish Order Block
A bearish order block is a price area where selling showed up just before a strong move down. It usually forms near the end of an upward move, close to the last bullish candle before price starts falling.
Bearish OB: The last Green Candle (Up) before a violent Red Move (Down).
3. The "Cheat Code": How to Spot Them Automatically
If you are new to SMC, your eyes might trick you. It can be difficult to distinguish between a "random candle" and a "valid institutional footprint."
To solve this, I personally use a specialized tool to filter out the noise:
Tool: Tuffy SMC OB Indicator (by TuffyCalls).
Why it works: It automatically highlights only the Order Blocks that have caused a Break of Structure (BOS), saving you hours of chart time. You can find it in the public library or check my profile for the setup.
4. The "Mitigation" Strategy (Why Price Comes Back)
This is the secret sauce. Why does Bitcoin often crash, touch a specific line to the dollar, and then skyrocket?
The Logic: Remember step 1? The Bank Sold to drive the price down before they Bought. This means they still have Short Positions open that are technically in a loss as the price rockets up.
They must bring the price back down to their Order Block to close those Short positions at Breakeven before they let the price fly to the moon. This process is called Mitigation.
Your Trade:
Entry: You place your Limit Buy Order at the Top (Open) of the Bullish Order Block.
Stop Loss: Just below the Bottom (Wick) of the Order Block.
Target: The next major liquidity pool (previous high).
Conclusion
Trading Order Blocks requires patience. You are no longer chasing green candles; you are acting like a sniper, waiting for the price to come to you.
Retail traders chase the pump.
Smart Money waits for the retest.
Draw the block (or let the Tuffy SMC indicator draw it for you), set the alert, and wait for the footprint.

BTCUSDT Review January 29 2026Short-term price movement ideas.
As expected in the previous analysis, price received confirmation from the daily area of interest. The 4H BtS is now acting as the main area of interest to work with.
If we get a test of the 4H zone along with confirmation on the 1H timeframe, we can then consider opening a short position targeting a new low.
Be flexible, adapt to the market, and the results will come quickly. Good luck to everyone.

GOLD UPDATED: FINAL GRAND CYCLE ANALYSIS – $5,131 Hit, NEXT?hey everyone — quick update on the GOLD Grand Supercycle Chart ( 2026 edition ).
We've been riding this beast hard, and it's delivering exactly as mapped. We smashed through that first big fib target at $5,131 ( nailed it perfectly today ), printed a fresh all-time high around $5,190 on the 3W, and now... yeah, we're seeing the classic pullback kicking in. This looks like the transition from the end of the 3rd minor wave into the 4th — a healthy, needed breather before the final 5th leg of this minor cycle.
Short-term roadmap right now: Expecting a correction down toward the $3,600–$3,500 zone (marked in red on the chart as that 3-to-4 wave dip). Could be sharp, could grind, but it's the shake-out most people miss or panic-sell. Support clusters there line up with prior structure, fib retraces, and the longer-term channel floor.
Once that 4th wave bottoms, boom — 3rd wave of the minor cycle fires up, targeting ~$9,419 ( 3.618% extension cluster — clean alignment).
After that? The chart tells the rest of the story: Micro 4th wave correction (probably multi-month, classic profit-taking / "gold is done again" vibes).
Then Micro 5th pushes the envelope higher potentially topping near $22,744 (3.618%) , feeding into the Macro Wave 3 climax.
Bigger picture stays unchanged: Macro Wave 3 potentially topping near $22,744 (3.618%), then deep Wave 4 shakeout, followed by the monster Wave 5 blow-off into $78,940+ (or way higher in full fiat-reset chaos — $100k–$250k not off the table if trust fully evaporates).
This isn't hype — it's the same Elliott + fib + PA structure that's respected every major turn since the '70s. We're deep in the "price discovery" phase of Macro Wave 3, where third waves get parabolic and make doubters look silly.
Smart money's been accumulating for years; now retail's piling in, central banks keep buying physical, and the fiat narrative keeps cracking. Dips like the one coming are the last real gifts before the next leg rips.
Plan: Watch for confirmation of the $3,500–$3,600 bottom (higher lows, volume dry-up, reversal candles).
Scale in on weakness if you're positioned — this correction is setup for the next impulse.
Don't fight the trend; third waves extend, corrections get ugly but end.
Stay sharp, manage risk, and let's see if we print $9k+ sooner than most think.
Drop your thoughts below — you calling this dip to $3,500 or shallower? Positions?
What a time to be watching gold... the system's hedge is waking up for real.
Disclaimer: Not financial advice — just sharing the chart structure and my read. Do your own homework, trade your plan.

#CADCHF: Perfect Area To Sell, 1 Hour Time Frame! Dear Traders,
The long-term view for the OANDA:CADCHF pair is bearish. Both short-term and daily timeframes suggest a potential selling opportunity. Selling at the current level could be beneficial but strict risk management is recommended.
If you enjoy our work, please like and subscribe for more.
Team Setupsfx_

Bitcoin - Failed Recovery, Liquidity Below Becomes the TargetMarket Overview
Bitcoin is showing clear bearish intent on the daily timeframe. The broader structure has shifted to the downside, with price struggling to sustain any meaningful continuation higher. Daily momentum remains weak, and each attempt to reclaim higher levels is being met with aggressive selling. From a higher timeframe perspective, the market looks positioned to continue pressing lower in search of additional liquidity.
Initial Daily FVG Rejection
Price first tapped into a daily fair value gap and was immediately rejected. That reaction was not just a minor pullback, it marked a clear shift in intent. The rejection initiated downside continuation and set the tone for what followed. This move confirmed that higher timeframe sellers were active and defending that imbalance with conviction.
Break in Daily Structure
Following the initial rejection, price moved lower and broke daily structure. This was an important development, as it confirmed that the move was not just a temporary reaction but a genuine shift in market control. Once that structure failed, the previous bullish narrative was invalidated and the market transitioned into a bearish environment.
Second Daily FVG Rejection After Structure Break
After the structure break, price retraced back into a newly formed daily fair value gap, aligned with the level where structure previously failed. This area acted as resistance, and price once again rejected cleanly. This second rejection is key, as it shows sellers defending the same zone after the market context had already turned bearish. That alignment between structure and imbalance strengthens the case for continuation lower.
Lower Timeframe Reaction on the 1H Chart
On the one hour timeframe, the reaction at the first daily fair value gap was very telling. Price showed hesitation, followed by clear bearish displacement away from the zone. This lower timeframe behavior confirms that the daily imbalance was respected and actively sold into. The one hour structure supports the higher timeframe narrative and adds confidence that the rejection was not random but technically driven.
Conclusion
With the daily trend bearish, structure already broken, and repeated rejections from daily fair value gaps, the path of least resistance remains to the downside. As long as price continues to respect these higher timeframe imbalances as resistance, the expectation is for Bitcoin to move lower and take out additional lows before any meaningful reversal can be considered.
___________________________________
Thanks for your support!
If you found this idea helpful or learned something new, drop a like 👍 and leave a comment, I’d love to hear your thoughts! 🚀

EURCAD BEARISH BIAS|SHORT|
✅EURCAD is trading into a higher-timeframe supply zone after a strong bullish displacement. Signs of buy-side liquidity exhaustion suggest a potential bearish reaction and pullback toward discounted levels. Time Frame 11H.
SHORT🔥
✅Like and subscribe to never miss a new idea!✅
