NZDCHF MOVE DOWN AHEAD|SHORT|
✅NZDCHF is retracing toward a premium supply level where institutional order flow likely shifts bearish. The market engineered buy-side liquidity to mitigate imbalance before continuation lower toward the next draw on liquidity. Time Frame 5H
SHORT🔥
✅Like and subscribe to never miss a new idea!✅
Smartmoneyconcepts

NZD-JPY Will Go Up! Buy!
Hello,Traders!
NZDJPY respected the horizontal demand area, confirming bullish order flow with a clean break of structure. Liquidity beneath the last swing low has been taken, suggesting continuation higher toward the next target level.Time Frame: 3H
Buy!
Comment and subscribe to help us grow!
Check out other forecasts below too!
Disclosure: I am part of Trade Nation's Influencer program and receive a monthly fee for using their TradingView charts in my analysis.

EUR-JPY Free Signal! Sell!
Hello,Traders!
EURJPY SMC based signal. Price has reacted sharply from a premium supply zone, forming a bearish displacement and potential CHoCH on lower timeframes. Expecting a move into discount levels as liquidity below the recent equal lows gets targeted.
-------------------
Stop Loss: 177.959
Take Profit: 177.510
Entry: 177.744
Time Frame: 3H
-------------------
Sell!
Comment and subscribe to help us grow!
Check out other forecasts below too!
Disclosure: I am part of Trade Nation's Influencer program and receive a monthly fee for using their TradingView charts in my analysis.

Gold > Previous Day Highs?Gold looks interesting from $4,100 - could act as a potential bullish pivot point to target previous day highs.
Kind regards,
Aman

$GU Bullish in the new week?Simple analysis, just looking at potential targets, and seeing these equal highs (EQH) and previous day highs (PDH).
This key level of 1.33 could act as a pivot point, so I'll be interested in monitoring this in the new week open.
Kind regards,
Aman

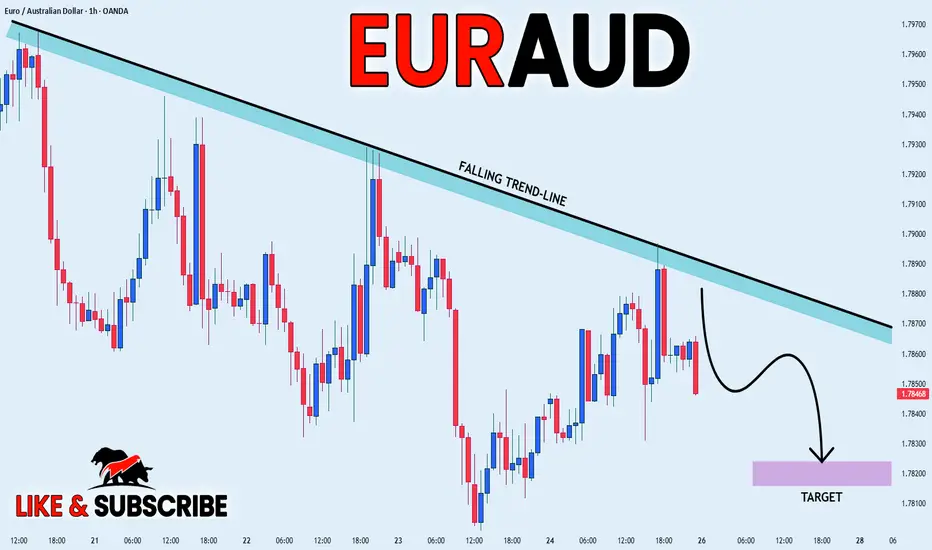
EURAUD WILL GO DOWN|SHORT|
✅EURAUD is respecting the falling trendline, showing rejection from premium levels. Liquidity has been collected above the recent swing, suggesting smart money may aim for the downside to rebalance inefficiency toward the target zone. Time Frame 2H.
SHORT🔥
✅Like and subscribe to never miss a new idea!✅
GBPJPY — Eyeing Reaction from 204.00Price swept buy-side liquidity and shifted structure, leaving a refined 15M order block nested inside a 1H breaker and aligned with the 4H bearish flow.
I’m watching that zone for lower-timeframe confirmation to join the next move down.
If the zone holds, it’s a continuation setup. If it breaks, I step aside — no bias, just structure and probability.
Liquidity feeds the patient.

The Market Doesn’t Hate You — It’s Just Doing Its JobEvery trader at some point feels attacked by the market.
You take a trade, it hits your stop loss by one pip… and then runs perfectly in your direction.
You think, “The market is against me.”
But the truth is — the market doesn’t hate you.
It’s simply doing its job: collecting liquidity before moving to its real destination.
💡 Here’s What’s Really Happening
The market is a liquidity machine.
It moves where money is resting — not where traders wish it would go.
When you see price sweeping highs or lows before reversing, that’s not manipulation against you —
it’s Smart Money doing what it’s built to do:
Hunt liquidity
Fill institutional orders
Create displacement before the next move
Your stop loss isn’t being targeted personally —
it’s sitting where millions of other traders’ stops are clustered.
The market simply clears those levels before delivering the real move.
🧠 The Lesson
Stop trading emotionally and start thinking structurally.
Ask yourself before every setup:
Where is liquidity resting?
Has the market collected it yet?
Is structure confirming the new direction?
When you learn to think like Smart Money, you stop blaming the market and start understanding it.
You’ll realize every loss was a lesson pointing you toward better timing, discipline, and patience.
📊 Final Thought
The market is not your enemy — it’s your teacher.
Once you align with how liquidity and structure truly work,
you’ll stop feeling trapped and start trading with clarity and confidence.
💬 Follow for more institutional-based educational posts.
No signals. No hype.
Just pure trading knowledge and Smart Money insights that help you grow.

EURGBP LOCAL SHORT|
✅EURGBP has reached the supply level and is showing signs of rejection from premium pricing. Smart money may look to engineer a retracement toward discounted levels as liquidity above recent highs has been swept. Targeting the lower inefficiency zone for a potential re-balance. Time Frame 2H.
SHORT🔥
✅Like and subscribe to never miss a new idea!✅

EUR-USD Bullish Bias! Buy!
Hello,Traders!
EURUSD SMC based forecast shows price reacting from the horizontal demand area with strong bullish momentum. Liquidity beneath previous lows has been swept, indicating potential continuation to the upside toward the target level. Time Frame 5H.
Buy!
Comment and subscribe to help us grow!
Check out other forecasts below too!
Disclosure: I am part of Trade Nation's Influencer program and receive a monthly fee for using their TradingView charts in my analysis.

SILVER Local Long! Buy!
Hello,Traders!
SILVER SMC based analysis shows price reacting from the horizontal demand area where liquidity has been swept and bullish order flow may soon resume. Expecting a possible push upward toward the next target level once internal structure confirms a shift. Time Frame 5H.
Buy!
Comment and subscribe to help us grow!
Check out other forecasts below too!
Disclosure: I am part of Trade Nation's Influencer program and receive a monthly fee for using their TradingView charts in my analysis.

EURJPY FREE SIGNAL|SHORT|
✅EURJPY has reached a premium zone near a clear supply level, where smart money could be offloading long positions. Expecting a potential reversal setup as liquidity is engineered above previous highs.
—————————
Entry: 177.57
Stop Loss: 177.80
Take Profit: 177.10
Time Frame: 2H
—————————
SHORT🔥
✅Like and subscribe to never miss a new idea!✅

USD-JPY Free Signal! Sell!
Hello,Traders!
USDJPY SMC based setup forming as price taps into the horizontal supply area, showing rejection and loss of bullish momentum. Smart money may now shift order flow to the downside, aiming for liquidity resting below recent lows.
-------------------
Stop Loss: 153.295
Take Profit: 152.612
Entry: 153.024
Time Frame: 3H
-------------------
Sell!
Comment and subscribe to help us grow!
Check out other forecasts below too!
Disclosure: I am part of Trade Nation's Influencer program and receive a monthly fee for using their TradingView charts in my analysis.

US30 Bearish Leg from $46,800Hi everyone,
Sharing a 15m US30 chart for you guys.
This morning, price traded above previous days high and then gave a bearish reaction.
On the shared chart I have the Asian Low (AL) marked out, which has not been swept or traded below yet.
So this could potentially be a good interim bearish target.
This current $46,800 price level could potentially act as a pivot point if the correct confluences form on the lower time frame such as the 5m chart.
Confluences @ $46,800:
- 61.8% FIB
- OB area
- 1h FVG area
Kind regards,
Aman

EURGBP FREE SIGNAL|SHORT|
✅EURGBP has reached a premium zone tapping into a strong supply level where smart money could engineer distribution. Expecting a reaction to the downside as liquidity is targeted below the previous swing lows.
—————————
Entry: 0.8721
Stop Loss: 0.8730
Take Profit: 0.8708
Time Frame: 3H
—————————
SHORT🔥
✅Like and subscribe to never miss a new idea!✅

GOLD Free Signal! Sell!
Hello,Traders!
GOLD SMC based setup forming after price mitigated the horizontal supply area and showed clear rejection. Smart money is likely offloading long positions here before targeting liquidity below recent equal lows.
-------------------
Stop Loss: 4,188$
Take Profit: 4,093$
Entry: 4,139$
Time Frame: 3H
-------------------
Sell!
Comment and subscribe to help us grow!
Check out other forecasts below too!
Disclosure: I am part of Trade Nation's Influencer program and receive a monthly fee for using their TradingView charts in my analysis.

EUR-GBP Local Short! Sell!
Hello, Traders!
EURGBP tapped a key supply area after a liquidity grab, signaling potential smart money distribution. Expect bearish reaction and continuation toward the target level as price seeks balance after inefficiency.
Time Frame 3H.
Sell!
Comment and subscribe to help us grow!
Check out other forecasts below too!
Disclosure: I am part of Trade Nation's Influencer program and receive a monthly fee for using their TradingView charts in my analysis.

GBPAUD FREE SIGNALS|LONG|
✅GBPAUD Price has reached a key discount zone tapping into a high-probability demand area. Smart money could now be accumulating long positions, anticipating a shift in structure toward the next liquidity draw above recent highs.
—————————
Entry: 2.0450
Stop Loss: 2.0425
Take Profit: 2.0481
Time Frame: 2H
—————————
LONG🚀
✅Like and subscribe to never miss a new idea!✅

NZDUSD LOCAL SHORT|
✅NZDUSD is currently trading inside a premium zone within a key supply area, where liquidity above previous highs has likely been engineered. A shift in market structure from here could confirm a short setup toward the next draw on liquidity. Time Frame 2H.
SHORT🔥
✅Like and subscribe to never miss a new idea!✅

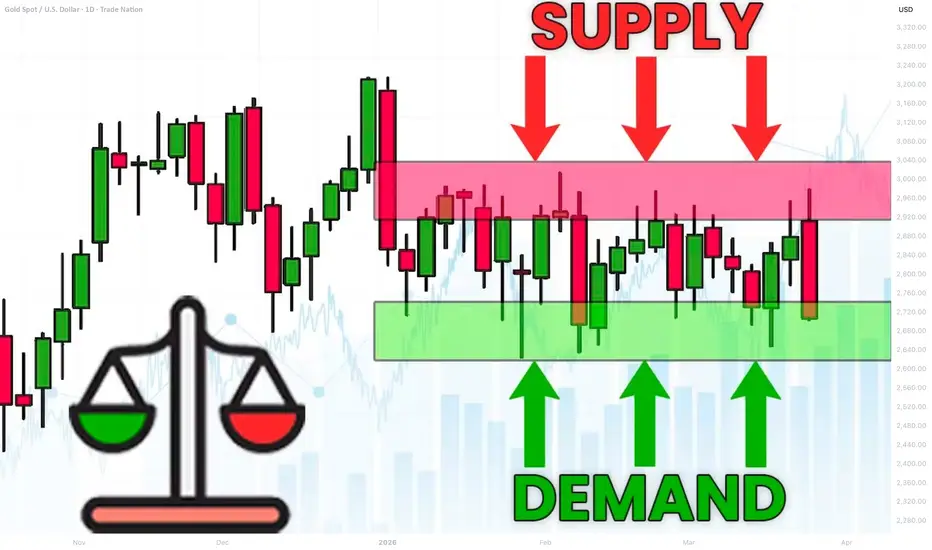
What is Equilibrium in SMC. Balance and Imbalance in Forex Gold
Equilibrium is one of the core elements for understanding market liquidity.
In this article, we will go through the essential basics of liquidity in Forex trading with Smart Money Concepts SMC.
You will learn the interconnections between supply and demand and I will explain how to easily identify balance and imbalance on any market.
Let's start our discussion with understanding how forex pairs move.
The price of an asset goes up if the market demand is stronger than the market supply. The excess of buying activity make the markets update the highs. In smart money concepts, such an event will also be called a buying imbalance.
Look at a strong bullish rally on Gold.
The price is going up because of a buying imbalance.
A strong buying activity creates a massive amount of buyers with unfilled orders.
To entice sellers to start selling, they must offer a higher-better price.
At the same time, if the price of an asset goes down , it means that the market supply is stronger than a demand. The excess of supply will make the markets update the lows. In smc, it will be called a selling imbalance.
That is exactly what is happening with GBPUSD forex pair.
A strong selling activity and the shortage of demand makes the price go down.
The excess of supply or demand on the market can not be eternal.
The lower the price becomes, the more buyers will start buying, and the more sellers will start closing their positions.
At some moment, the surplus of supply will be absorbed by the buyers.
That will be a moment when the market will find equilibrium , the balance between supply and demand.
A strong bearish imbalance on USDJPY made the price drop significantly.
The falling price made 3 things:
It attracted more buyers, because the lower the price the more profitable is buying USDJPY.
It discouraged some buyers from buying, considering that the price is already "too low".
It encouraged some buyers to close their positions in profit.
Because of that, USDJPY stopped falling and found a balance in supply and demand. That is what we call Equilibrium .
In a bull run, the higher the price will go, the more sellers will start selling.
At some moment, buying imbalance will be absorbed by the bears and supply & demand will eventually balance.
Such an event will be called the equilibrium .
EURGBP was rallying strongly.
The higher the price went, the more sellers started to sell, considering selling the pair more and more profitable.
And the same time, fewer buyers were buying and the more started to close their buy positions in profits.
At some moment, the entire excess of the market demand was absorbed by a supply. The market stopped growing and equilibrium was found.
One of the main characteristics of a market equilibrium is sideways price movement and a termination of a formation of new highs or new lows.
Usually, such a sideways price action will form a horizontal range.
That's a real example how a CAD JPY pair found an equilibrium after an extended bearish movement. A formation of a horizontal range confirmed a balance between a supply and a demand.
Please, note that these ranges will form on any time frame that you analyse.
The rule is that the higher is the time frame of the range, the stronger is the market equilibrium.
Above, I have 3 different charts:
USDJPY on a daily time frame, EURJPY on a 4H and GBPUSD on 15 minutes.
All the pairs found an equilibrium in horizontal ranges.
An equilibrium on USDJPY will signify intra week or even intra month balance,
while on EURJPY it will mean intraday/intra week balance.
On GBPUSD, it will signify intraday equilibrium.
Market equilibrium can not last forever.
Fundamentals news and changing market conditions, make the market participants constantly reassess a fair value of an asset.
A violation of the range and a breakout of one of its boundaries will be a trigger of an occurrence of an imbalance .
A bullish violation of the upper boundary of the range will signify a buying imbalance and a highly probable rise to the new highs.
While a bearish violation of the lower boundary of the range will mean a selling imbalance and a highly probable fall to the new lows.
Please, study how GBPCHF was moving for a week on an hourly time frame.
The periods of balance were changed by the periods of bullish or bearish imbalances, that found a new equilibrium on higher/lower price levels.
Understanding of basic principles of supply and demand in trading is essential for profitable trading smart money concepts.
Learn to recognize the periods of imbalance and equilibrium.
It will provide you the edge in understanding and trading any forex pair.
❤️Please, support my work with like, thank you!❤️
I am part of Trade Nation's Influencer program and receive a monthly fee for using their TradingView charts in my analysis.
CAD-CHF Will Fall! Sell!
Hello,Traders!
CADCHF is approaching a horizontal supply area where institutional selling pressure may return. A reaction from this zone could trigger a bearish continuation toward the next liquidity pocket. Time Frame 5H.
Sell!
Comment and subscribe to help us grow!
Check out other forecasts below too!
Disclosure: I am part of Trade Nation's Influencer program and receive a monthly fee for using their TradingView charts in my analysis.

AUD-CAD Free Signal! Buy!
Hello,Traders!
AUDCAD Price has tapped into a horizontal demand area where smart money buyers are likely positioned. A potential bullish reaction could follow as liquidity gets absorbed from the previous lows.
-------------------
Stop Loss: 0.9059
Take Profit: 0.9079
Entry: 0.9068
Time Frame: 3H
-------------------
Buy!
Comment and subscribe to help us grow!
Check out other forecasts below too!
Disclosure: I am part of Trade Nation's Influencer program and receive a monthly fee for using their TradingView charts in my analysis.

USDCAD FREE SIGNAL|LONG|
✅USDCAD Price has reacted from a clean demand zone where buy-side liquidity was accumulated, showing signs of bullish displacement. A continuation toward the next imbalance is expected.
—————————
Entry: 1.3986
Stop Loss: 1.3975
Take Profit: 1.3999
Time Frame: 2H
Setup Risk: High
—————————
LONG🚀
✅Like and subscribe to never miss a new idea!✅
