EUR-AUD Local Short! Sell!
Hello,Traders!
EURAUD taps into the horizontal supply area, showing a clear bearish displacement as Smart Money seeks to rebalance inefficiency. A retest of the zone is expected before continuation lower. Time Frame 3H.
Sell!
Comment and subscribe to help us grow!
Check out other forecasts below too!
Disclosure: I am part of Trade Nation's Influencer program and receive a monthly fee for using their TradingView charts in my analysis.
Smartmoneyconcepts

EURJPY STRONG GAP UP|LONG|
✅EURJPY gapped up, broke above the structure, and is now retesting the demand area. A rebound here could send price back toward the 176.400¥ target as liquidity above recent highs gets cleared. Time Frame 2H.
LONG🚀
✅Like and subscribe to never miss a new idea!✅

USDCHF REBOUND AHEAD|LONG|
✅USDCHF approaching a clean demand area with clear displacement to the downside. Liquidity resting below recent lows likely to be swept before bullish reaction unfolds toward the 0.7965$ target. Time Frame 2H.
LONG🚀
✅Like and subscribe to never miss a new idea!✅

CRUDE OIL Will Keep Falling! Sell!
Hello,Traders!
CRUDE OIL retested the horizontal supply area cleanly and is now forming a pullback, confirming Smart Money’s intent to continue distribution. Liquidity above recent highs is likely absorbed, with price expected to target 60.10$ to rebalance inefficiency and continue bearish flow.Time Frame 3H.
Sell!
Comment and subscribe to help us grow!
Check out other forecasts below too!
Disclosure: I am part of Trade Nation's Influencer program and receive a monthly fee for using their TradingView charts in my analysis.

GBPNZD POTENTIAL SHORT|
✅GBPNZD price will retest the supply level above on Monday after a clear market structure shift. A bearish order block at 2.3140 is likely to act as a mitigation point, with liquidity resting below 2.3080 as target. Time Frame 3H.
SHORT🔥
✅Like and subscribe to never miss a new idea!✅

GBP-AUD Supply Level Ahead! Sell!
Hello,Traders!
GBPAUD will tap into the horizontal supply area and react with bearish pressure. Smart Money likely distributing positions before driving price toward the liquidity resting near 2.0370. Time Frame 2H.
Sell!
Comment and subscribe to help us grow!
Check out other forecasts below too!
Disclosure: I am part of Trade Nation's Influencer program and receive a monthly fee for using their TradingView charts in my analysis.

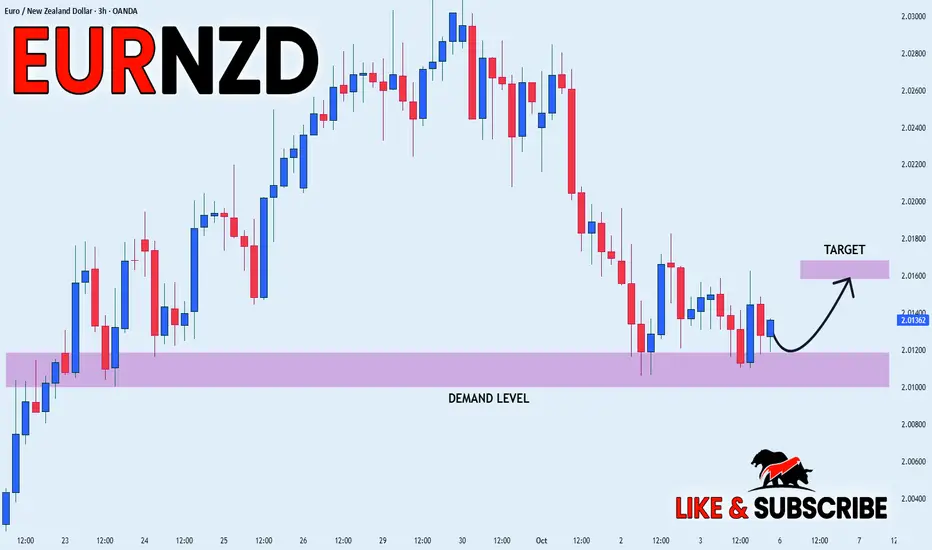
EURNZD LOCAL LONG|
✅EURNZD price is expected to tap into the demand level before pushing higher, aligning with ICT’s optimal trade entry model. Liquidity rests below recent lows, inviting smart money accumulation. Time Frame 3H.
LONG🚀
✅Like and subscribe to never miss a new idea!✅
NZDCAD WILL GROW|LONG|
✅NZDCAD Price reacted from the daily demand level after a clean liquidity sweep below equal lows. Smart money buyers are now targeting buy-side liquidity near 0.8155. Time Frame 4H.
LONG🚀
✅Like and subscribe to never miss a new idea!✅

USOIL WILL GO DOWN|SHORT|
✅WTI OIL Price rejects supply after distribution and forms bearish orderflow, ICT suggests liquidity is being targeted below. Market likely seeks drawdown into 60.00 demand imbalance. Time Frame 4H.
SHORT🔥
✅Like and subscribe to never miss a new idea!✅

SILVER Local Short! Sell!
Hello,Traders!
SILVER is about to reject the horizontal supply zone after liquidity sweep, confirming Smart Money distribution. Price is set to rebalance inefficiency with target aligned near $4,690. Time Frame 3H.
Sell!
Comment and subscribe to help us grow!
Check out other forecasts below too!
Disclosure: I am part of Trade Nation's Influencer program and receive a monthly fee for using their TradingView charts in my analysis.

DAX Bearish Bias! Sell!
Hello,Traders!
DAX taps into horizontal supply where Smart Money distributes orders. The rejection signals bearish flow, with liquidity likely drawn toward inefficiency near 24,300 zone. Time Frame 3H.
Sell!
Comment and subscribe to help us grow!
Check out other forecasts below too!
Disclosure: I am part of Trade Nation's Influencer program and receive a monthly fee for using their TradingView charts in my analysis.

Trading GBPUSD EURUSD | Judas Swing Strategy 29/09/2025This week, the Judas Swing strategy delivered another set of textbook lessons on patience, execution, and discipline. We had two clear setups unfold on FX:GBPUSD and FX:EURUSD and both gave us valuable insight into how the market manipulates liquidity before revealing its true direction.
On Monday FX:GBPUSD initially consolidated during the Judas Swing period, giving us the perfect framework to anticipate manipulation. As the session started, we saw liquidity taken above the high of the Judas Swing zone.
From there, we immediately shifted our focus to potential selling opportunities. Once structure broke to the downside, all eyes were on the retrace into the imbalance left behind. We knew from experience that patience is key here, sometimes price runs away without giving the pullback, and forcing an entry in those situations usually leads to regret.
This time, we got the perfect retrace. Once price tapped back into the FVG and the candle closed, our short was executed with a clean 1% risk. The market briefly hovered near our entry, but the setup held strong. Soon after price dropped decisively, reaching our target and securing a solid 2% gain.
On Tuesday FX:EURUSD gave us a slightly different picture but the same Judas Swing principles applied. Price first ran the zone lows, grabbing liquidity before reversing sharply. Once we spotted that break of structure to the upside, our game plan was straightforward: wait for the retrace into imbalance, and execute.
The market made it easy this time, with zero to no drawdown, price quickly reversed in our favor, running straight to our target for another +2R trade.
Both FX:GBPUSD and FX:EURUSD reminded us why the Judas Swing strategy works, the markets lure traders into chasing breakouts before reversing into the true move of the day. By waiting for the sweep, confirmation, and retrace, we put ourselves on the right side of the move with defined risk. Two trades, two wins, and another week of staying disciplined to the plan. Consistency doesn’t come from predicting every market move, it comes from following a strategy that stacks the odds in your favor.

AUD-USD Free Signal! Sell!
Hello,Traders!
AUDUSD supply rejection within the horizontal supply area strengthens bearish SMC outlook, with price expected to dive lower as liquidity shifts in favor sellers.
—————————
Stop Loss: 0.6589
Take Profit: 0.6562
Entry: 0.6576
Time Frame 4H.
—————————
Sell!
Comment and subscribe to help us grow!
Check out other forecasts below too!
Disclosure: I am part of Trade Nation's Influencer program and receive a monthly fee for using their TradingView charts in my analysis.

GOLD Local Rebound Ahead! Buy!
Hello, Traders!
GOLD closed above the horizontal demand area, confirming bullish participation. Price will surge from the zone in alliance with Smart Money principles, seeking to mitigate inefficiency while clearing sell-side liquidity. Target sits higher. Time Frame 1H.
Buy!
Comment and subscribe to help us grow!
Check out other forecasts below too!
Disclosure: I am part of Trade Nation's Influencer program and receive a monthly fee for using their TradingView charts in my analysis.

Profitable Multiple Time Frames Smart Money Strategy For Trading
In this post, I will share with you a very accurate and profitable SMC Smart Money trading strategy that combines top-down analysis, liquidity, imbalance, order block and inducement.
Step 1 - Identify liquidity zones on a daily
Liquidity zones are the areas on a price chart, where big players are placing their orders. From such areas, significant bullish and bearish movements initiate.
Liquidity zones that are above the current price will be the supply zones, while the liquidity zones that are below the current price will be the demand zones.
We will look for shorting opportunities from supply areas and for buying opportunities from demand zones.
Here are the liquidity zones that I identified on EURJPY.
Step 2 - Wait for a test of one of the liquidity zones
Let the market test the liquidity zone.
For buying, the price should reach a lower boundary of a demand zone.
For shorting, the price should test an upper boundary of a supply zone.
I underlined the exact levels that the price should test on EURJPY.
Here is the test of the lower boundary of the demand zone.
Step 3 - Look for inducement on an hourly time frame
With the inducement, smart money make the market participants think that the liquidity zone that the price is testing doesn't hold anymore.
When the price tests a supply area, an hourly candle close above its upper boundary will be a bullish inducement.
With that, the smart money incentivize buying orders.
When the price tests a demand area, an hourly candle close below its lower boundary will be a bearish inducement.
With that, the smart money incentivize selling orders.
The price closed below a lower boundary of a demand zone on EURJPY on 1H time frame.
Step 4 - Look for imbalance on an hourly time frame
After a violation of a supply area on an hourly time frame, look for a bearish imbalance.
Bearish imbalance is a strong bearish candle with wide range and big body. With that candle, the market should return within a supply zone and closed within or below that.
After a violation of a demand area on an hourly time frame, look for a bullish imbalance.
Bullish imbalance is a strong bullish candle with wide range and big body. With that candle, the market should return within a demand zone and closed within or above that.
Here is the example of a bullish imbalance on EURJPY.
After a bearish inducement, the price formed a high momentum bullish candle and closed within the demand zone.
The imbalance signify that a liquidity zone violation was a trap .
With that, smart money simply was trying to grab the liquidity.
That will be a signal for you to open an order.
Step 5 - Look for an order block
After the formation of the imbalance, the market becomes locally week and quite often corrects to an order block.
Order block will be the closest hourly liquidity zone.
After a formation of a bearish imbalance, look for a supply zone on an hourly time frame. That will be your perfect zone to sell .
After a formation of a bullish imbalance, look for a demand zone on an hourly. That will be your area to buy from.
Here is the order block on EURJPY.
Step 6 - Set a limit order
Set a sell limit order within a supply area after a formation of bearish imbalance on an hourly time frame.
Set a buy limit order within a demand area after a formation of a bullish imbalance on an hourly.
Here is your buy entry level on EURJPY.
Step 7 - Select the target
If you sell, your target should be the closest daily structure support: horizontal or vertical one.
If you buy, your target should be the closest daily structure resistance: horizontal or vertical one.
In our example, our closest structure resistance if a falling trend line.
Step 8 - Set stop loss
If you sell, stop loss will lie above a bullish inducement.
If you buy, stop loss will lie below a bearish inducement.
Here is a perfect point for a stop loss for a long trade on EURJPY.
Step 9 - Trade
Let the price trigger your entry, and then be prepared to wait.
It took many days for EURJPY to reach the target.
Trading Tips:
1. Make sure that you have a positive reward/ratio. It should be at least 1.2
2. Risk no more that 1% of your trading account per trade
Being applied properly, that strategy shows 70%+ accuracy.
Try it by yourself and let me know your results.
❤️Please, support my work with like, thank you!❤️
I am part of Trade Nation's Influencer program and receive a monthly fee for using their TradingView charts in my analysis.
EURUSD WILL GO UP|LONG|
✅EURUSD Price rejects demand area with ICT displacement, suggesting bullish intent. Smart Money likely targets the overhead supply level near 1.1730 for liquidity draw. Time Frame 3H.
LONG🚀
✅Like and subscribe to never miss a new idea!✅

CAD-JPY Free Signal! Sell!
Hello,Traders!
CADJPY rejects a horizontal supply area after a fakeout sweep, signaling SMC distribution. Bears aim to drive price lower into liquidity resting near 107.27. Time Frame 2H.
-------------------
Stop Loss: 107.616
Take Profit: 107.271
Entry: 107.435
Time Frame: 2H
-------------------
Sell!
Comment and subscribe to help us grow!
Check out other forecasts below too!
Disclosure: I am part of Trade Nation's Influencer program and receive a monthly fee for using their TradingView charts in my analysis.

CHF_JPY WILL KEEP GROWING|LONG|
✅CHFJPY Price reacts from demand area, confirming ICT displacement. Liquidity grab hints at bullish continuation, with Smart Money aiming for imbalance near 187.50. Time Frame 2H.
LONG🚀
✅Like and subscribe to never miss a new idea!✅

EUR-GBP Short From Supply Level! Sell!
Hello,Traders!
EURGBP taps into supply, rejecting premium levels as Smart Money shifts flow. The reaction signals distribution, with price likely targeting 0.8732 to rebalance inefficiency and clear buy-side stops.Time Frame 5H.
Sell!
Comment and subscribe to help us grow!
Check out other forecasts below too!
Disclosure: I am part of Trade Nation's Influencer program and receive a monthly fee for using their TradingView charts in my analysis.

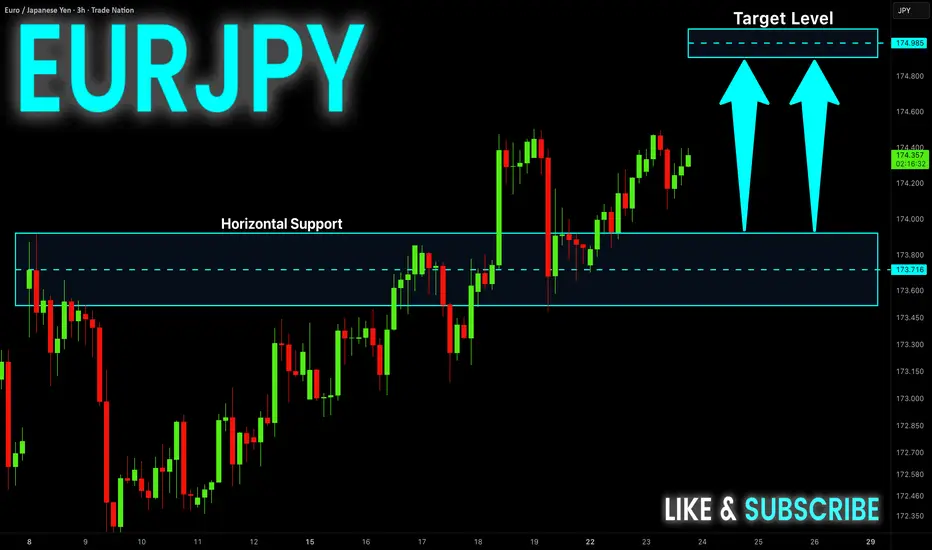
EUR-JPY Will Keep Growing! Buy!
Hello,Traders!
EUR-JPY is trading in an
Uptrend and the pair is
Already making a nice
Rebound from the horizontal
Support level of 173.800
So we are bullish biased and
A further bullish move up
Is to be expected
Buy!
Comment and subscribe to help us grow!
Check out other forecasts below too!
Disclosure: I am part of Trade Nation's Influencer program and receive a monthly fee for using their TradingView charts in my analysis.
EUR_AUD GROWTH AHEAD|LONG|
✅EUR_AUD is going down now
But a strong support level is ahead around 1.7800
Thus I am expecting a rebound
And a move up towards the target of 1.7923
LONG🚀
✅Like and subscribe to never miss a new idea!✅

EUR-GBP Will Grow! Buy!
Hello,Traders!
EUR-GBP is trading in an
Uptrend and the pair is
Going down to retest
The horizontal support
Around 0.8709 so after
The retest we will be
Expecting a further
Bullish move up
Buy!
Comment and subscribe to help us grow!
Check out other forecasts below too!
Disclosure: I am part of Trade Nation's Influencer program and receive a monthly fee for using their TradingView charts in my analysis.

DXY LOCAL LONG|
✅DXY is going down to retest
A horizontal support around 97.200
Which makes me locally bullish biased
And I think that we will see a rebound
And a move up from the level
Towards the target above at 97.440
LONG🚀
✅Like and subscribe to never miss a new idea!✅
