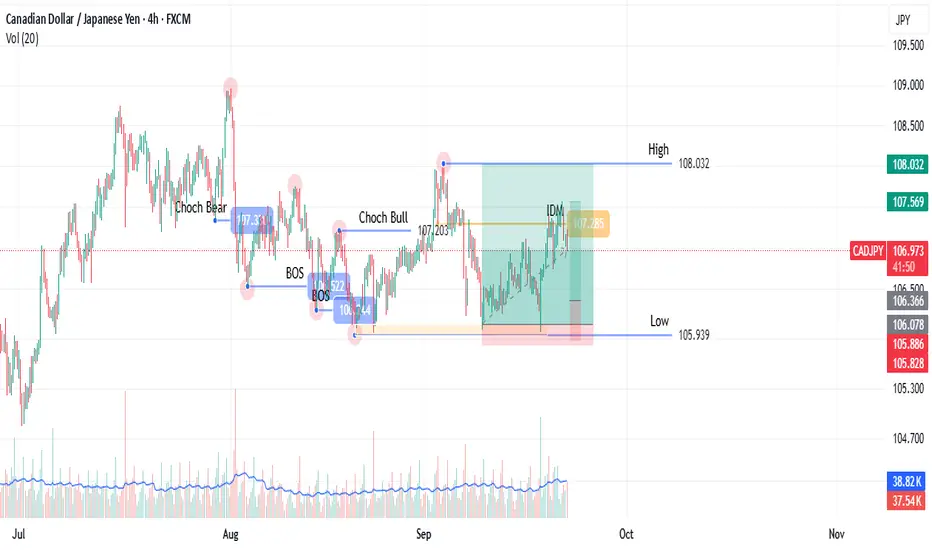
SMC Concept: Defining the Trading Range (Step 1) On CADJPYCAD/JPY, 4H Timeframe (as demonstrated)
This post outlines the first step in a methodology focused on identifying key market structure levels. The goal is to objectively define a trading range, using CAD/JPY as the example.
The Process: Of a bullish Structure
Identify the range Low: Locate the last retracement from the previous high, the low is deepest price level retraced to.
Find the Inducement: Mark the low of the most recent pullback (retracement) before the price made a new high.
Wait for Confirmation: The high is only confirmed once price returns to hit this inducement level. This validates the high as an official range boundary.
A break of the confirmed high is a break of structure (BOS). A break of the confirmed low suggests a change of character (CHoCH), shifting sentiment.
This is the foundational step for identifying future points of interest. The next step involves plotting POIs based on this confirmed range.
This methodology is based on one that I learned from someone else on Youtube, but I have changed many details to suit my style. As a thank you note, I have referred to this person on other paltforms, but unfortunately, I don't think I can do this here as I might be violating this platform's rules.
I will be posting the next steps that would lead to deciding on a trading position on step by step basis.
I am already making videos but I might be using this platforms video option for later posts.
Smartmoneyconcepts
GBP_CAD RESISTANCE AHEAD|SHORT|
✅GBP_CAD has been growing recently
And the pair seems locally overbought
So as the pair is approaching
A horizontal resistance of 1.8669
Price decline is to be expected
SHORT🔥
✅Like and subscribe to never miss a new idea!✅

USD-CHF Local Long! Buy!
Hello,Traders!
USD-CHF made a retest
Of the horizontal support
Around 0.7920 from
Where we are seeing
A local bullish reaction
Already and we will be
Expecting a further
Bullish move up
Buy!
Comment and subscribe to help us grow!
Check out other forecasts below too!
Disclosure: I am part of Trade Nation's Influencer program and receive a monthly fee for using their TradingView charts in my analysis.

AUD_USD LONG FROM SUPPORT|
✅AUD_USD is going down now
But a strong support level is ahead at 0.6560
Thus I am expecting a rebound
And a move up towards the target of 0.6600
LONG🚀
✅Like and subscribe to never miss a new idea!✅

CRUDE OIL LONG FROM SUPPORT|
✅CRUDE OIL is going down to retest
A horizontal support around 61.80$
Which makes me locally bullish biased
And I think that we will see a rebound
And a move up from the level
Towards the target above at 62.80$
LONG🚀
✅Like and subscribe to never miss a new idea!✅

Daily Candle Analysis ($GU)Hi everyone.
Firstly thank you to everyone who follow me here on TradingView and also on social media. I appreciate you all!
Sharing my pre market open analysis here on GBP/USD.
Keeping the markup very simple! only looking at the previous daily candle.
I haven't got this marked on the shared chart, but price is currently within a daily Fair Value Gap, hence I reckon we could see a bullish reaction.
Too early to say, but my current prediction for the opening is, that price will wick below the previous day low price and trade towards the price point of 1.35 as an initial bullish target.
And then if at 1.35 further bullish confirmations form, then we could potentially see price trade a further leg up to 1.3525 & 1.355.
Hope everyone has a good trading week ahead, keep risk managed, trade smart, and hope you found this brief analysis on GBPUSD helpful for your own analysis.
Would also love to hear your guys opinions below in the comments.
Kind regards,
Aman

EUR-NZD Strong Bullish Bias! Buy!
Hello,Traders!
EUR-NZD is trading in an
Uptrend and our bullish
Bias in confirmed by a
Bullish breakout of the
Key horizontal level
Around 2.0000 so we
Will be expecting a
Further bullish move up
On Monday
Buy!
Comment and subscribe to help us grow!
Check out other forecasts below too!
Disclosure: I am part of Trade Nation's Influencer program and receive a monthly fee for using their TradingView charts in my analysis.

GBP_USD WILL GROW|LONG|
✅GBP_USD is trading in
An uptrend on high TF
With the pair set to retest
The rising support line
From where I think the
Growth will continue
As we are locally
Bullish biased
LONG🚀
✅Like and subscribe to never miss a new idea!✅

EUR_USD REBOUND AHEAD|LONG|
✅EUR_USD is trading along
The rising support line
And as the pair will soon
Retest it I am expecting
The price to go up
To retest the supply
Levels above at 1.1769
LONG🚀
✅Like and subscribe to never miss a new idea!✅

CAD_CHF RESISTANCE AHEAD|SHORT|
✅CAD_CHF is set to retest
A strong resistance level
Above at 0.5790 after trading
In a local uptrend for some time
Which makes a bearish pullback
A likely scenario with the target
Being a local support
Below at 0.5763
SHORT🔥
✅Like and subscribe to never miss a new idea!✅

NZD-USD Support Ahead! Buy!
Hello,Traders!
NZD-USD keeps falling
Down and the pair is locally
Oversold so when the pair
Hits the support on Monday
We will be expecting a
Local bullish correction
Buy!
Comment and subscribe to help us grow!
Check out other forecasts below too!
Disclosure: I am part of Trade Nation's Influencer program and receive a monthly fee for using their TradingView charts in my analysis.

AUD-USD Support Below! Buy!
Hello,Traders!
AUD-USD is falling down
In a local downtrend but
The pair will soon hit
A horizontal support level
Of 0.6558 from where
A local bullish rebound
Is to be expected
Buy!
Comment and subscribe to help us grow!
Check out other forecasts below too!
Disclosure: I am part of Trade Nation's Influencer program and receive a monthly fee for using their TradingView charts in my analysis.

NZD_USD SUPPORT AHEAD|LONG|
✅NZD_USD is set to retest
A strong support level
Below around 0.584 after
Trading in a local downtrend
For some time which makes
A bullish rebound a likely
Scenario with the target
Being a local resistance
Above at 0.5870
LONG🚀
✅Like and subscribe to never miss a new idea!✅

EUR-USD Long From Rising Support! Buy!
Hello,Traders!
EUR-USD is making a
Nice bearish correction
After the FED's decision
Crazy trading but now
The pair is close to the
Rising support line so
After the retest we will
Be expecting a local
Bullish rebound
Buy!
Comment and subscribe to help us grow!
Check out other forecasts below too!
Disclosure: I am part of Trade Nation's Influencer program and receive a monthly fee for using their TradingView charts in my analysis.

NZD_CHF REBOUND AHEAD|LONG|
✅NZD_CHF is falling in a
Strong downtrend and the pair
Seems to be locally oversold
So as the pair is approaching
A strong horizontal support
Of 0.4640 price growth
Is to be expected
LONG🚀
✅Like and subscribe to never miss a new idea!✅

EUR_JPY BULLISH BREAKOUT|LONG|
✅EUR_JPY will keep growing
Because the pair is in the uptrend
And recently broke the key level
Around 174.000 area
So we will be expecting
Bullish continuation
LONG🚀
✅Like and subscribe to never miss a new idea!✅

Trading EURUSD | Judas Swing Strategy 15/09/2025The Judas Swing strategy is all about discipline, patience, and trusting the process, and this FX:EURUSD setup from Monday’s session was a perfect reminder of why sticking to the rules matters more than chasing results.
As the Judas Swing session started, FX:EURUSD gave us the first clue we look for: a liquidity sweep above the zones high. Breakout buyers jumped in, only to find themselves trapped as price quickly reversed. This was our signal to get ready. But, as always, one signal isn’t enough. We needed the next confirmation: a break of structure to the downside. Once that shift in order flow printed, the setup was officially on our radar.
Next came the waiting game. The strategy demands patience until price retraces back into a Fair Value Gap (FVG) created on the price leg that broke structure. It didn’t take long FX:EURUSD pulled back neatly, tapped into the FVG, and our entry candle closed. That was the green light.
Risk per trade: 1%
Target: 2%
Risk-to-Reward: 1:2
Checklist complete. Trade executed.
Unlike some trades where price rockets instantly, this one tested our patience. FX:EURUSD moved in our favor but reversed and even pulled against us. Momentum returned, but instead of pushing toward our 2% target, price lost steam mid-way and reversed. The result: a 1% loss
The important lesson here is that a losing trade executed according to plan is still a successful trade. We didn’t chase the liquidity sweep. We didn’t anticipate the break of structure. We didn’t force an early entry. Every box was ticked, and the trade simply didn’t play out. That’s trading. The Judas Swing isn’t about winning every setup, it’s about trusting the process over the long run. By managing risk and staying consistent, we position ourselves for sustainable growth, even when individual trades don’t hit target.

AUD_JPY SWING LONG|
✅AUD_JPY is trading in an
Uptrend and the pair was
Making a bearish correction
But is now about to retest
A horizontal support
Level of 97.400 from where
I am expecting the pair to go up
LONG🚀
✅Like and subscribe to never miss a new idea!✅

NZD-JPY Local Long! Buy!
Hello,Traders!
NZD-JPY is trading in a
Local uptrend and the pair
Will soon retest a horizontal
Support level around 87.200
From where we will be expecting
A local rebound and a move up
Buy!
Comment and subscribe to help us grow!
Check out other forecasts below too!
Disclosure: I am part of Trade Nation's Influencer program and receive a monthly fee for using their TradingView charts in my analysis.

GBP_JPY WILL GO UP|LONG|
✅GBP_JPY is trading along
The rising support line
And as the pair is going up now
After the retest of the line
I am expecting the price
To keep growing to retest
The supply levels
Above around 200.200
LONG🚀
✅Like and subscribe to never miss a new idea!✅

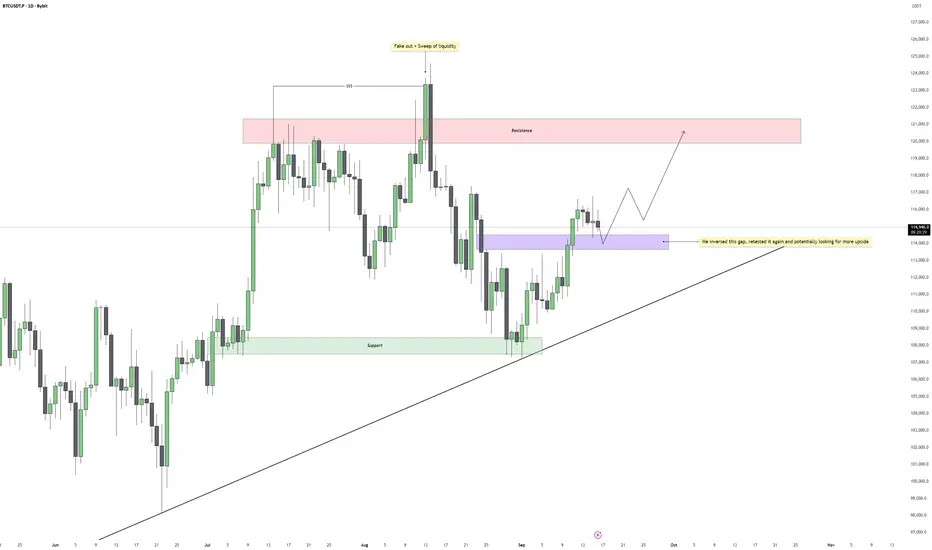
Bitcoin - Daily Gap Inversion Aligns with UptrendBitcoin recently made a push higher that cleared local highs and swept liquidity above the previous range. This move created a temporary fake out before price sharply retraced, filling inefficiencies left behind in the market. After completing this corrective move, price has begun reclaiming structure and is now respecting higher timeframe demand zones.
Daily Structure
The daily chart continues to show a clean uptrend, with higher lows forming along the rising trendline. After the liquidity sweep, price retraced to test key imbalances and has since confirmed a bullish shift by inverting a daily gap. This gap has been retested multiple times, suggesting it is holding firm as support and reinforcing the bullish continuation bias.
Liquidity Dynamics
The sweep of liquidity at the highs cleared buy-side pressure, resetting the market. This type of liquidity event often precedes sustained directional moves as the market seeks out new inefficiencies and liquidity pools. For now, downside liquidity has been satisfied and the path of least resistance appears to be higher.
Upside Scenarios
If the inverted daily gap continues to hold, price could target the major resistance block above 120,000 USDT. This zone aligns with the previous rejection area, where liquidity remains untested. Any approach into this resistance will be key to monitor for continuation or rejection.
Downside Risk
Should Bitcoin lose the daily inverted gap and trendline support, further retracement toward 111,000 to 112,000 USDT becomes possible, where a deeper liquidity pocket and structural support remain. Until then, the higher low structure remains intact.
Conclusion
Bitcoin has absorbed liquidity, filled inefficiencies, and inverted a daily gap that is now holding as support. Combined with the ongoing daily uptrend, this strengthens the bullish outlook with a clear target toward the 120,000 USDT resistance zone.
___________________________________
Thanks for your support!
If you found this idea helpful or learned something new, drop a like 👍 and leave a comment, I’d love to hear your thoughts! 🚀
EUR-USD Will Keep Growing! Buy!
Hello,Traders!
EUR-USD is trading in
An uptrend and the
Pair is now making a
Local bearish correction
But we are bullish biased
And we will be expecting
A further bullish move up
Buy!
Comment and subscribe to help us grow!
Check out other forecasts below too!
Disclosure: I am part of Trade Nation's Influencer program and receive a monthly fee for using their TradingView charts in my analysis.

USD-JPY Local Long! Buy!
Hello,Traders!
USD-JPY made a retest
Of the horizontal support
Level around 146.279
And we are already seeing
A local bullish reaction so
A further bullish correction
Is to be expected
Buy!
Comment and subscribe to help us grow!
Check out other forecasts below too!
Disclosure: I am part of Trade Nation's Influencer program and receive a monthly fee for using their TradingView charts in my analysis.
