Bullish Pop > Daily Highs?Quick and easy BTC technical analysis on the hourly chart. price is currently retraced into 50% of the previous bullish leg where you also have a OB + 1h FVG zone and a general supply/demand zone.
This price level could potentially give price another bullish pop to the upside.
Aman
Smartmoneyconcepts

SPY Free Signal! Sell! (For Monday)
Hello,Traders!
SPY has tapped into a premium supply zone, triggering a potential bearish delivery after a clean liquidity grab above equal highs. Expect continuation toward sell-side imbalance.
---------------------
Stop Loss: 674.31$
Take Profit: 666.68$
Entry Level: 670.89$
Time Frame: 2H
---------------------
Sell!
Comment and subscribe to help us grow!
Check out other forecasts below too!
Disclosure: I am part of Trade Nation's Influencer program and receive a monthly fee for using their TradingView charts in my analysis.

Copper(XCU/USD) Ready to Explode | Wave 3 to $10, Wave 5 to $100🧠 COPPER — The Sleeping Giant Ready for a Supercycle 🌍⚡
Copper, the “metal of electrification,” is setting up for one of the biggest macro-bull markets we’ve ever seen. From EVs to renewable grids to AI data-center power demand, copper is literally the blood of the new industrial era . Let’s break it down step-by-step 👇
🔮 Wave Theory Confluence (Elliott + Fibonacci Extensions)
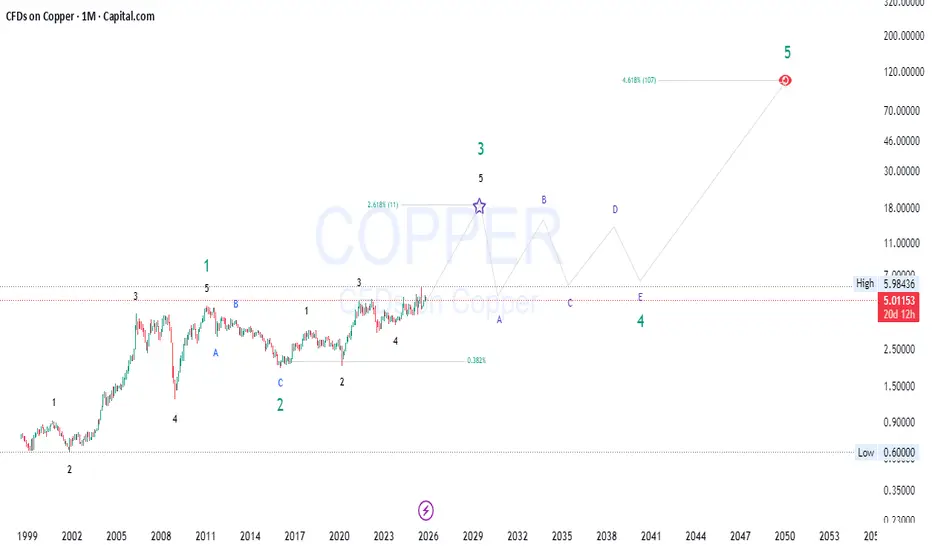
Zooming out to the monthly timeframe , we can clearly see Copper finishing its Wave 3 within a long-term 5-wave impulsive supercycle.
✅ Wave 1 (2001-2008) fueled by China’s infrastructure boom.
✅ Wave 2 (2008-2016) a deep corrective phase, classic ABC zigzag.
⚡ Wave 3 (2016-2026) now unfolding with a 2.618 Fibonacci extension , targeting around $10–11 levels per pound by the late 2020s.
📉 After that, expect a macro Wave 4 correction —likely a complex ABCDE structure —before the final parabolic Wave 5 projection toward $100+ in the 2040s according to long-term fib confluence (4.618x extension).
This aligns perfectly with historical commodity supercycles—massive runs followed by decades of consolidation before exponential growth again.
🧩 Smart Money Concepts (SMC) – Liquidity & Institutional Order Flow
Smart Money has been quietly accumulating since 2016 👀
Liquidity grab below the 2020 lows cleaned out retail longs, allowing institutions to build heavy long positions.
The current structure shows higher highs (HHs) and higher lows (HLs) — the signature of a bullish market structure shift.
Premium/Discount zones show Copper still trading in the discount range of the macro leg (below the 50% equilibrium), suggesting Smart Money accumulation continues.
Expect Wyckoff-style reaccumulation as price coils between $4–$6 before the breakout into the next expansion leg 🚀
🧭 Price Action & Market Structure
Monthly BOS (Break of Structure) confirmed above $5, flipping long-term market structure bullish.
Demand zones at $4.0–$4.5 act as strong re-entry levels.
Liquidity pools above the $6 level (previous highs) likely to be taken out as price seeks expansion to the Wave 3 target zone.
Look for a final shakeout into Wave 4 later in the decade before the next true parabolic move.
This PA structure mirrors textbook “smart accumulation > markup > distribution > reaccumulation” phases seen in previous copper supercycles.
💹 Fundamentals: The Perfect Storm
⚙️ Electrification Boom – Copper is the backbone of EVs, renewable grids, AI data centers, and defense manufacturing.
🔋 Supply Constraints – Global mine production growth slowing while demand from green tech surges.
🌎 Geopolitical Tensions – Supply concentration in Chile, Peru, and DRC adds a geopolitical risk premium.
💰 Inflation Hedge – Commodities entering a reflation cycle as central banks pivot back to stimulus.
All fundamentals point to structural deficits by 2026-2030, aligning perfectly with Wave 3’s macro push.
🧮 Fibonacci Confluence & Cycle Timing
Wave 3 projection: 2.618 × Wave 1 = ~$10.7
Wave 4 retracement: likely 0.382 fib (~$6–$7 zone)
Wave 5 extension: 4.618 × Wave 1 = $100+
The time cycle between major waves (≈10–12 years) also aligns with commodity supercycles, putting Wave 5’s blow-off top around 2045-2050.
🔔 Conclusion: The Long Game
Copper isn’t just a trade — it’s a multi-decade macro opportunity .
While short-term volatility (Wave 4) will shake weak hands, the structural setup screams “supercycle incoming.”
🟢 Bias: Long-term bullish
🕰 Accumulation Zone: $4–$5
🎯 Targets:
Mid-term (2026-2028): $10–11
Long-term (2040s): $100+
⚡ “Commodities move slow… until they don’t.”
The smart money has already positioned. The rest will chase the breakout. Don’t be the last one in.
#Copper #ElliottWave #SmartMoneyConcepts #Commodities #MacroCycle #PriceAction #Fibonacci #TradingView #Investing #Metals
NATURAL GAS(XNGUSD) | Final Wave 2 Flush Before Mega Wave 3⚡ NATURAL GAS – The Final Flush Before the Supercycle ⚡
After topping out in 2005 , Natural Gas has spent nearly two decades inside a massive corrective structure — slowly grinding lower, retracing, and shaking out every long-term bull in sight.
What we’re seeing now could be the final leg of Wave 2 in that entire supercycle.
This ongoing correction, stretching from 2005 to now, is likely entering its final phase — an exhaustion move that could complete between $1.466–$1.413 .
This zone aligns perfectly with:
✅ Deep 0.786 Fibonacci retracement of the previous impulse
✅ Historical demand and structural support
✅ Liquidity resting beneath long-term lows
✅ Smart Money accumulation footprints beginning to show
If price stabilizes here, we could be witnessing the foundation of a new multi-year Wave 3 , which historically tends to be the most explosive move in the Elliott Wave cycle.
🧭 Technical & Structural Overview
📊 Elliott Wave View:
Wave 1: 2005–2021 impulsive phase
Wave 2: 2021–present, deep ABC correction (now in the C-wave)
Expected completion: $1.466–$1.413 zone
Next: Wave 3 lift-off → potential parabolic move
📐 Fibonacci & Wave Confluence:
0.786 retracement zone → $1.4–$1.5 (ideal Wave 2 termination area)
Wave 3 1.618 extension → $68
Supercycle 2.618 projection → $700+
🧠 Smart Money Concept:
Institutions love to accumulate during despair.
We can already see signs of a liquidity sweep , followed by potential accumulation and a pending market structure shift once price reclaims levels above $3.5–$4.0.
🌍 Fundamentals Align
Global LNG demand continues to rise, especially across Asia and Europe.
US export capacity and infrastructure expansion add long-term bullish pressure.
Supply investment remains underweight — a key setup for future price shocks.
Despite green energy growth, Natural Gas remains the bridge fuel for stability.
This macro alignment supports a generational reversal once the current flush completes.
🎯 Price Map
💎 Wave 2 Completion Zone: $1.466–$1.413
🚀 Wave 3 Target (1.618 ext): $60–$70
🌠 Supercycle Wave 5 (2.618 ext): $700+
⚠️ Invalidation: Sustained breakdown below $1.40
💬 Summary
Natural Gas is approaching the final phase of a two-decade correction — an extremely rare setup in macro wave structure.
When Wave 2 completes, the stage will be set for one of the strongest commodity bull waves in modern market history.
📈 “When the crowd sees destruction, smart money sees construction — and that construction may already be starting around $1.4.”
What are you seeing in your charts? Do you think the bottom is in, or do we need one more liquidity sweep first? 👇
#NaturalGas #NatGasUSD #ElliottWave #WaveAnalysis #SmartMoney #Fibonacci #MarketStructure #Commodities #EnergyMarkets #MacroCycle #CommoditySupercycle #Wave3Setup #TechnicalAnalysis #TradingView #Investing

ETHEREUM FREE SIGNAL|SHORT|
✅ETHUSD is reacting from a premium supply level after internal liquidity sweep and mitigation of an old imbalance. Expect bearish delivery toward the sell-side liquidity below.
—————————
Entry: 3,457.5$
Stop Loss: 3,502$
Take Profit: 3,400$
Time Frame: 2H
—————————
SHORT🔥
✅Like and subscribe to never miss a new idea!✅

EUR-USD Move Down Ahead! Sell!
Hello,Traders!
EURUSD traded back into a premium supply zone after internal liquidity sweep, showing bearish displacement from the order block. Expect continuation lower toward the next liquidity void. Time Frame 5H.
Sell!
Comment and subscribe to help us grow!
Check out other forecasts below too!
Disclosure: I am part of Trade Nation's Influencer program and receive a monthly fee for using their TradingView charts in my analysis.

GBP-USD Free Signal! Sell!
Hello,Traders!
GBPUSD tapped into a premium supply zone, creating a liquidity grab above equal highs and forming bearish displacement—confirming order block mitigation.
---------------------
Stop Loss: 1.3166$
Take Profit: 1.3110$
Entry Level: 1.3144$
Time Frame: 2H
---------------------
Sell!
Comment and subscribe to help us grow!
Check out other forecasts below too!
Disclosure: I am part of Trade Nation's Influencer program and receive a monthly fee for using their TradingView charts in my analysis.

GOLD Local Short! Sell!
Hello,Traders!
GOLD tapped into a premium supply zone, engineering liquidity above equal highs before showing bearish displacement. Expect a continuation move toward the downside imbalance. Time Frame 5H.
Sell!
Comment and subscribe to help us grow!
Check out other forecasts below too!
Disclosure: I am part of Trade Nation's Influencer program and receive a monthly fee for using their TradingView charts in my analysis.

GOLD Smart Money Might Be Preparing for Bullish Structure ShiftGold (XAU/USD) is showing early signs that Smart Money may be shifting from a distribution phase into a short-term accumulation phase.
After a strong bearish leg marked by multiple Breaks of Structure (BOS), recent price behavior now suggests the potential formation of a Market Structure Shift (MSS) — an early indication that institutional flow could be changing direction.
💭 1️⃣ Market Structure – When the Market “Whispers” About Reversal
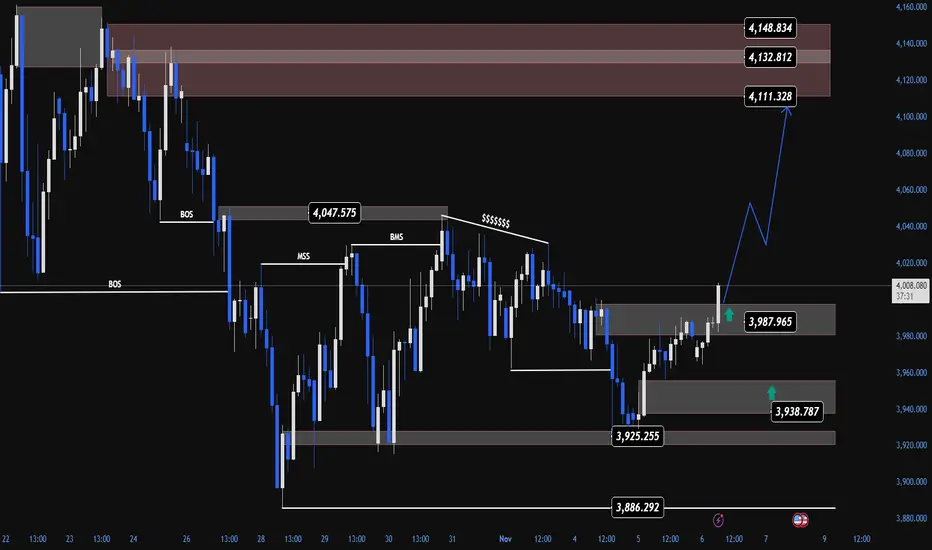
On the H1 timeframe, we can clearly observe a chain of consecutive BOSs since the 4,150 zone, but what’s intriguing is the reaction around 3,925 – 3,940.
Here, price failed to make new lower lows and began rejecting strongly — leaving several rejection wicks that reveal smart money absorption at discounted prices.
This area represents the discount zone of the current range — where institutions often collect liquidity from trapped sellers before pushing price toward premium levels for redistribution.
The latest Break of Market Structure (BMS) around 3,987 confirms that bearish momentum is weakening, and buyers may be starting to reclaim control in the short term.
🩶 2️⃣ Supply & Demand Zones – Footprints of Smart Money
Karina is currently watching three key zones shaping this market phase:
Demand Zones:
3,938 – 3,925: A strong demand base formed after the initial push upward — acting as a key support if price retraces.
3,986 – 3,988: A minor demand zone formed post-BMS, serving as a potential “reaccumulation point” for the next bullish leg.
Supply Zones:
4,111 – 4,149: Unmitigated Bearish Order Block from the previous decline — the most probable upside target for Smart Money in the current swing.
The projected SMC scenario: Smart Money accumulates at demand → builds liquidity → drives price into the upper supply zones.
🧭 3️⃣ Liquidity Context – Quiet but Purposeful Movement
Gold currently sits within a liquidity equilibrium — a transitional area where both buy- and sell-side liquidity coexist.
Below, 3,886 remains a pocket of sell-side liquidity, while above, large buy-side liquidity pools rest around 4,110 – 4,150.
Smart Money may first collect the remaining sell-side liquidity before triggering a strong upward displacement toward the upper supply zones — following the familiar pattern:
liquidity sweep → displacement → continuation.
🌙 4️⃣ Trade Scenario – Flow With Smart Money, Not Against It
As long as price holds above 3,938 – 3,987, the short-term bias for Karina is bullish.
If price retests these demand zones and forms bullish confirmations (e.g., bullish engulfing or clear order flow shift), it may set the stage for a push toward the 4,111 – 4,148 region.
Entry: 3,938 – 3,987
Stop Loss: 3,925
Take Profit: 4,111 – 4,148
This setup presents roughly a 1:4 R:R, consistent with a buy-side liquidity grab strategy under SMC principles.
🌷 5️⃣ Reflection – When the Market Moves in Silence
After an extended bearish phase, Gold now seems to be accumulating strength in quiet preparation.
This is not a loud reversal — it’s a subtle rebalancing of institutional flow.
To Karina, the market right now feels like a slow, gentle rhythm — calm, deliberate, and full of hidden intent. Sometimes, the key isn’t chasing volatility, but listening to the whispers of Smart Money in the silence of price action. 🌸
This analysis reflects Karina’s personal perspective and is not financial advice.
Do you see the same structure forming? Could this be the early stage of a bullish cycle, or just another liquidity grab? Let’s discuss below 💬
US100 Free Signal! Sell!
Hello,Traders!
US100 is expected to soon retest the horizontal supply area before continuing its bearish move toward the target zone.
---------------------
Stop Loss: 25,877$
Take Profit: 25,607$
Entry: 25,728$
Time Frame: 2H
---------------------
Sell!
Comment and subscribe to help us grow!
Check out other forecasts below too!
Disclosure: I am part of Trade Nation's Influencer program and receive a monthly fee for using their TradingView charts in my analysis.

USD-JPY Will Keep Growing! Buy!
Hello,Traders!
USDJPY continues its strong uptrend after tapping into the horizontal demand area, showing clear bullish momentum toward 154.200 target zone. Time Frame 6H.
Buy!
Comment and subscribe to help us grow!
Check out other forecasts below too!
Disclosure: I am part of Trade Nation's Influencer program and receive a monthly fee for using their TradingView charts in my analysis.

Siemens (SIE) Rally in Full Swing | Supercycle Target Above 700+⚡️ Siemens – Supercycle Wave 3 Heating Up! 🌊
Siemens (SIE) is mid-flight in Wave (3) of the Supercycle Wave 5 — the most explosive leg of the macro move.
Momentum still looks 🔥 with upside potential toward the 3.618 Fib extension around 330 , where Wave 3 could complete before a healthy Wave 4 dip.
Smart money’s been quietly reloading through each consolidation 🧠 — structure stays bullish, trend intact, and sentiment still building.
Wave 4 = opportunity. Wave 5 = potential breakout zone 🚀
Is smart money really in? Drop your analysis below!
#Siemens #SIE #ElliottWave #SmartMoneyConcepts #FibonacciTrading #PriceAction #TechnicalAnalysis #WaveTheory #Investing #TradingView #BullMarket #GermanStocks #MarketCycle #TrendTrading

GOLD Free Signal! Buy!
Hello,Traders!
GOLD Price has tapped into a strong horizontal demand area, showing early signs of bullish rejection. Buyers may aim toward 3,970$ as the next liquidity target.
-------------------
Stop Loss: 3,915$
Take Profit: 3,970$
Entry: 3,940$
Time Frame: 2H
-------------------
Buy!
Comment and subscribe to help us grow!
Check out other forecasts below too!
Disclosure: I am part of Trade Nation's Influencer program and receive a monthly fee for using their TradingView charts in my analysis.

EUR/JPY Sell Momentum BuildsEUR/JPY has officially transitioned into a sell-side trend following clear exhaustion of its previous bullish cycle. The market structure shows consecutive lower highs and strong downside displacement, confirming that sellers are now in control of short-term momentum.
Recent liquidity sweeps above prior highs were quickly rejected, signaling institutional distribution and profit-taking. Order flow dynamics continue to favor the downside, with bearish impulses showing higher efficiency than any corrective rebounds.
Momentum and sentiment both align with sustained selling pressure. The pair is operating within a redistribution phase, and the market tone remains defensive as participants seek lower value zones.
Overall outlook: Bearish bias remains dominant. The market is expected to extend lower while maintaining controlled volatility until meaningful demand re-enters the market.

NZDJPY FREE SIGNAL|LONG|
✅NZDJPY Price has tapped into the demand level with a clean rejection wick, signaling potential short-term bullish reversal toward 87.40. Liquidity resting above equal highs could attract price.
—————————
Entry: 86.95
Stop Loss: 86.64
Take Profit: 87.40
Time Frame: 2H
—————————
LONG🚀
✅Like and subscribe to never miss a new idea!✅

EUR-AUD Local Short! Sell!
Hello,Traders!
EURAUD is reacting from the horizontal supply area after a corrective pullback. Liquidity has been engineered above equal highs, signaling potential bearish continuation to 1.7680$. Time Frame 5H.
Sell!
Comment and subscribe to help us grow!
Check out other forecasts below too!
Disclosure: I am part of Trade Nation's Influencer program and receive a monthly fee for using their TradingView charts in my analysis.

AUD-JPY Free Signal! Sell!
Hello,Traders!
AUDJPY recent break below structure and rejection from double-top premium zone confirms bearish order flow. Retrace into broken trendline acts as mitigation before expansion lower toward discount levels.
-------------------
Stop Loss: 101.230
Take Profit: 100.406
Entry: 100.830
Time Frame: 3H
-------------------
Sell!
Comment and subscribe to help us grow!
Check out other forecasts below too!
Disclosure: I am part of Trade Nation's Influencer program and receive a monthly fee for using their TradingView charts in my analysis.

EUR-CAD Local Short! Sell!
Hello,Traders!
EURCAD Price is reacting from a horizontal supply area after a corrective push upward. Smart money may seek liquidity below the previous lows before the next structural decision. Time Frame 2H.
Sell!
Comment and subscribe to help us grow!
Check out other forecasts below too!
Disclosure: I am part of Trade Nation's Influencer program and receive a monthly fee for using their TradingView charts in my analysis.

GBP-USD Bearish Bias! Sell!
Hello,Traders!
GBPUSD Price continues its bearish structure after rejecting from the horizontal supply area. Smart money is targeting the liquidity resting below the recent swing lows. Time Frame 5H.
Sell!
Comment and subscribe to help us grow!
Check out other forecasts below too!
Disclosure: I am part of Trade Nation's Influencer program and receive a monthly fee for using their TradingView charts in my analysis.

NIFTY Wave 3 Exhausted? — Wave 4 Short Setup Loading🔥 NIFTY 50 – Supercycle Wave 5 Exhaustion! Short Setup Loading ⚠️📉 🔥
Hey traders 👋 — NIFTY looks like it’s entering the most critical phase of its multi-decade Elliott Wave structure . The chart is screaming exhaustion — and all the technical confluences are lining up for a macro short setup before the final leg of this supercycle. Let’s break it down 👇
🌊 Elliott Wave Structure – The Supercycle Story Unfolding
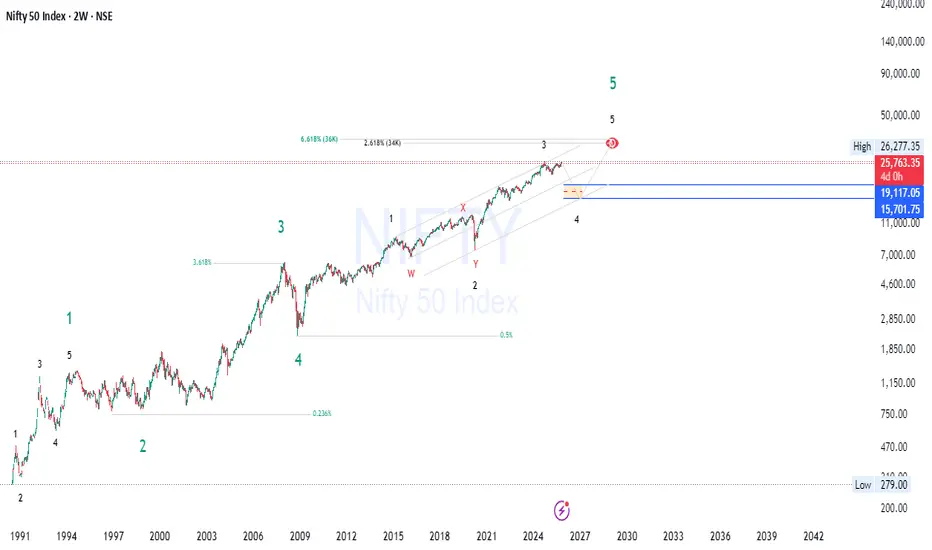
We’ve been in a massive 5-wave supercycle since the early 1990s, and we’re now deep inside Wave (5) — the last impulsive leg of this cycle.
Here’s the roadmap so far:
🟢 Wave 1: Topped in 1994
🔵 Wave 2: Bottomed in 1998
🟢 Wave 3: Ended in 2007 (the euphoric pre-crash top)
🔵 Wave 4: Bottomed in 2008
🟢 Wave 5: Currently unfolding with 5 macro waves
Inside Wave 5:
Wave 1 topped in 2015
Wave 2 corrected into 2020 (W–X–Y structure)
Wave 3 topped in 2024 — the strongest impulsive phase
Wave 4 correction is now developing and expected to run until 2026
Wave 5 to top around 2029 near 34K–36K (2.618 Fib)
But here’s the key 👇
We’re at the end of Wave 3 of 5 , and Wave 4 is just starting — meaning a significant correction is due .
⚙️ Fibonacci & Price Confluence
Wave 3 extended powerfully, testing the 2.618 Fib zone , with heavy confluence near 26K–27K — a perfect resistance band.
From here:
0.236 retracement target (minor correction): ~₹19,100
0.382 retracement (major correction): ~₹15,700
That gives us a short setup zone from 26K–27K , with targets between 19K–15.7K over the next 12–18 months 📉
💰 Smart Money Concepts (SMC) – Distribution Confirmed
SMC structure is showing clear distribution behavior at the highs:
Liquidity sweeps above equal highs near 26K
Signs of Change of Character (CHoCH) on lower timeframes
Weak reaction from demand zones → sellers stepping in
Premium-to-discount shift beginning
Institutions are distributing , not accumulating.
Once 24K–23.8K breaks, we’ll have full confirmation of bearish displacement and macro BOS (Break of Structure) — validating the short thesis.
🧱 Market Structure & Price Action
The uptrend is losing momentum; price is grinding instead of impulsing.
A rising wedge / ending diagonal pattern is visible — classic Wave 5 exhaustion signal.
Momentum divergences on weekly RSI and MACD confirm weakening internal strength.
A confirmed break below 24K will open clean liquidity voids toward 19K, then 15.7K.
🧭 Market Cycle & Sentiment
We’re in the Euphoria → Distribution transition — the same emotional shift seen before major corrections:
Retail believes “the market always goes up,” while Smart Money quietly exits.
Once the correction gains traction, expect sentiment to swing toward Complacency and Anxiety , setting up the bottom of Wave 4 around 2026.
🧮 Fundamentals Aligning with Technicals
Valuations remain stretched — NIFTY’s P/E above long-term averages.
Global risk factors (rates, oil, geopolitics) are aligning for a liquidity squeeze .
Earnings momentum is flattening; price has outpaced fundamentals.
All these align perfectly with a macro corrective phase (Wave 4).
⚡ Short Setup Plan (Swing / Positional Idea)
📍 Zone of Interest: 26K–27K (Fibonacci extension + structural resistance)
📍 Confirmation Trigger: Breakdown below 24K (CHoCH + BOS confirmation)
📍 Targets:
TP1 → ₹19,100 (Fib 0.236 + demand zone)
TP2 → ₹15,700 (Fib 0.382 + structural low)
📍 Invalidation: Sustained breakout above 27K with volume (would imply Wave 3 still extending).
🧨 Summary – Short Setup View
🟥 Wave 5’s internal Wave 3 likely topped at 26K–27K
🟧 Smart Money distributing at premium
🟨 Rising wedge + divergence confirming exhaustion
🟩 Breakdown below 24K = Wave 4 confirmed
🟢 Short targets: 19K → 15.7K
💬 Final Thoughts:
NIFTY’s long-term trend is still intact — but short-term, this is a golden short setup inside a major Wave 4 correction . The correction could last well into 2026 before the final euphoric push to 34K–36K by 2029.
Patience + confirmation = profit 💯
👇 What do you think — has Wave 4 already begun, or will we see one last liquidity sweep above 26K?
#Nifty50 #ElliottWave #SmartMoneyConcepts #Wave4 #ShortSetup #MarketStructure #TechnicalAnalysis #TradingView
Adidas AG (ADS) | Preparing for Wave 5 Rally Toward €500–€1,200Adidas AG (XETR:ADS) | Long-Term Elliott Wave & Structural Outlook
Adidas AG is completing a Wave 4 correction near key Fibonacci support, aligning technical structure and smart money accumulation for a potential long-term Wave 5 expansion toward €500–€1,200.
📊 Technical & Fundamental Confluence for Multi-Year Expansion Potential
Summary:
Adidas AG (ADS) is approaching the completion of a major Wave 4 correction within a long-term Elliott Wave structure originating from the 2009 low. The broader market structure remains intact, suggesting the potential for a strong Wave 5 impulsive advance in the coming years.
Technical Overview 🌀
The current corrective leg has retraced near the 0.382 Fibonacci level , a typical Wave 4 depth before a continuation move.
Elliott Wave projections indicate potential Wave 5 extensions toward €529 (3.618) and €1,290 (4.618) , aligning with historical impulsive proportions.
Price has recently swept liquidity below key swing lows, hinting at accumulation within a higher-timeframe demand zone.
Smart Money & Market Structure 💰
Evidence of institutional accumulation and potential reaccumulation phase.
A confirmed break of structure (BoS) and impulsive follow-through would validate the transition into the markup phase .
The long-term uptrend remains valid as long as Wave 4 support holds.
Market Cycle & Fundamentals ⚙️
Adidas may be shifting from markdown to accumulation , aligning with the early stages of a new expansion cycle .
Fundamentally supported by strong brand equity, global positioning, and improving margins as macro conditions stabilize.
Long-term investors could find value within current price ranges.
Outlook 🚀
As long as the €130–€160 accumulation zone remains intact, confluence across wave theory, Fibonacci structure, and smart money behavior supports a bullish long-term scenario toward €500–€1,200 .
📈 Bias: Long-Term Bullish
📍 Accumulation Zone: €130 – €160
🎯 Targets: €529 → €1,290
#Adidas #ADS #ElliottWave #SmartMoneyConcepts #PriceAction #Fibonacci #MarketStructure #Fundamentals #LongTermInvesting #TradingView

BYD : Smart Money Loading Before a Massive Wave 5 Breakout🚀 BYD Company Limited Class A (SZSE: 002594) — Wave 5 Expansion Setup
Big structure, clean levels, and solid fundamentals… Wave 5 might surprise a lot of people 👇
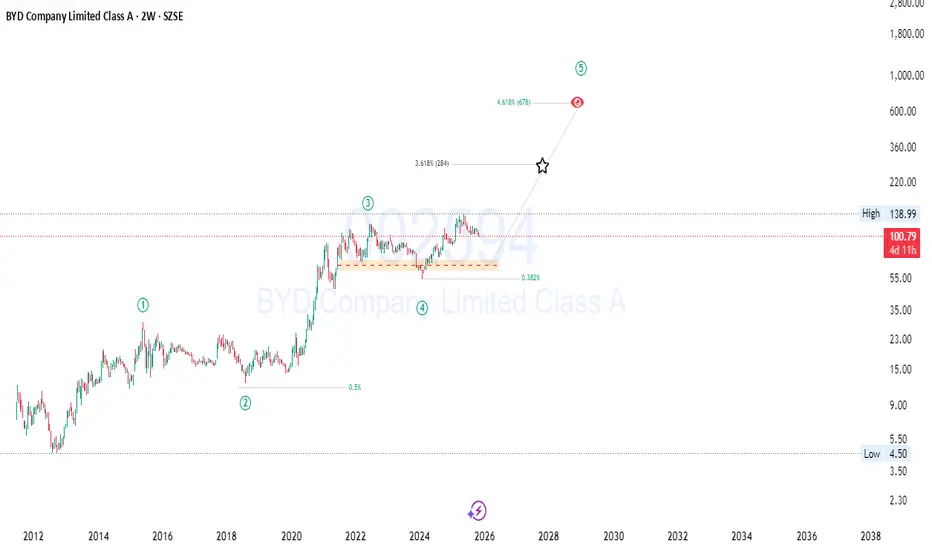
BYD has been quietly building strength, and the chart now suggests that the next major bullish wave could be setting up. After a long consolidation phase (Wave 4), smart money appears to be accumulating again — a classic sign of preparation for the next impulsive move.
A clean breakout above 138.99 would confirm Wave 5 , potentially targeting the 284–676 CNY zone based on Fibonacci extensions .
With solid fundamentals, supportive market structure, and a strong Elliott Wave setup, BYD could be entering a new long-term expansion phase. ⚡
Follow for updates on Wave 5 development and smart money reactions in the breakout zone! 📊
#BYD #002594 #ElliottWave #SmartMoneyConcepts #Fibonacci #WaveAnalysis #MarketStructure #PriceAction #EVstocks #GrowthStocks #ChinaMarket #LongTermInvesting #SwingTrade #TechnicalAnalysis #StockMarket
AUD-CAD Free Signal! Buy!
Hello,Traders!
AUDCAD is reacting from a horizontal demand area, showing signs of accumulation before a potential bullish move. Liquidity below recent lows has been swept, favoring buyers.
-------------------
Stop Loss: 0.9145
Take Profit: 0.9195
Entry Level: 0.9169
Time Frame: 5H
-------------------
Buy!
Comment and subscribe to help us grow!
Check out other forecasts below too!
Disclosure: I am part of Trade Nation's Influencer program and receive a monthly fee for using their TradingView charts in my analysis.
