EURUSD 14 Nov – Pullback SetupPrice remains within its broader bullish trend, and a potential rebound may occur from the 1.15934 zone. However, a 15-minute candle close inside the order block is very important for confirmation, especially since price recently broke internal structure, which increases the possibility of a deeper short-term pullback
If the order block holds and a valid rejection forms, EURUSD may resume its upward movement. Otherwise, the bearish correction may extend further before buyers step back in
SMC-ICT

NZDUSD WILL FALL|SHORT|
✅ NZDUSD taps a premium supply zone and shows corrective delivery. A shift in order flow suggests downside repricing toward the next draw on liquidity. Time Frame 4H.
SHORT🔥
✅Like and subscribe to never miss a new idea!✅

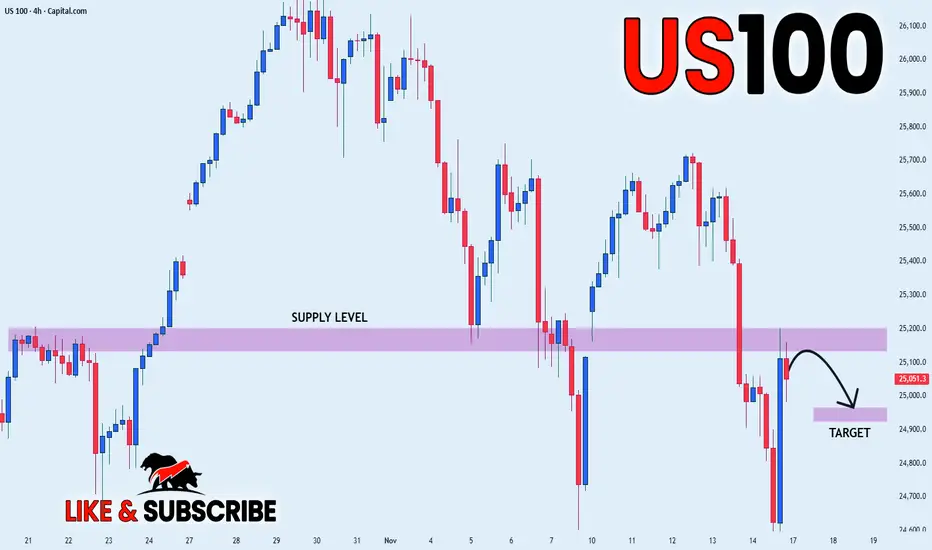
US100 LOCAL SHORT|
✅US100 price rejects the supply block and forms a clean displacement lower, hinting at a draw on liquidity toward the inefficiency below. A corrective retrace before targeting the marked zone is likely. Time Frame 4H.
SHORT🔥
✅Like and subscribe to never miss a new idea!✅
NZDCHF FREE SIGNAL|SHORT|
✅NZDCHF retests the supply level after a liquidity sweep, with displacement aligning bearish. A clean mitigation inside the zone suggests downside continuation toward the next liquidity pocket.
———————————
Entry: 0.4509
Stop Loss: 0.4515
Take Profit: 0.4500
Time Frame: 2H
———————————
SHORT🔥
✅Like and subscribe to never miss a new idea!✅

SPY FREE SIGNAL|SHORT|
✅SPY price rejects a major supply block after running buy-side liquidity, shifting intraday flow bearish. With displacement confirming downside intent, a draw toward the discount target zone is likely.
———————————
Entry: 671.95$
Stop Loss: 675.80$
Take Profit: 667.20$
Time Frame: 2H
———————————
SHORT🔥
✅Like and subscribe to never miss a new idea!✅

DXY LOCAL SHORT|
✅DXY rejects a premium-zone supply block, with intraday structure shifting bearish after collecting liquidity above recent highs. A drawdown toward the inefficiency below remains likely as momentum weakens. Time Frame 1H.
SHORT🔥
✅Like and subscribe to never miss a new idea!✅

CADCHF FREE SIGNAL|SHORT|
✅CADCHF price taps a clean supply block after an aggressive displacement lower, forming a premium-zone retracement ideal for continuation. Liquidity above minor highs has been harvested, favoring downside flow.
———————————
Entry: 0.56650
Stop Loss: 0.56740
Take Profit: 0.56480
Time Frame: 2H
———————————
SHORT🔥
✅Like and subscribe to never miss a new idea!✅

EURUSD BULLISH REBOUND|LONG|
✅EURUSD price is drawing back into the demand block, where internal liquidity sits below the short-term lows. A clean rebalance from this zone can fuel a continuation toward the next upside target. Time Frame 2H.
LONG🚀
✅Like and subscribe to never miss a new idea!✅

GOLD FREE SIGNAL|SHORT|
✅XAUUSD momentum shifted sharply after tapping the supply block, driving price into a clean displacement swing. With liquidity resting below, continuation toward the lower imbalance remains likely. Time Frame 1H.
—————————
Entry: 4084$
Stop Loss: 4110$
Take Profit: 4050$
Time Frame: 2H
—————————
SHORT🔥
✅Like and subscribe to never miss a new idea!✅

NZDCAD WILL KEEP GROWIING|LONG|
✅NZDCAD rebounded from a strong demand level, signaling possible continuation toward the liquidity pocket above 0.7980. A retracement into fair value gap could offer optimal entry. Time Frame 3H.
LONG🚀
✅Like and subscribe to never miss a new idea!✅

EURUSD – Possible Pullback Before Going HigherPrice may potentially react from the order block around the 1.16167 level. However, since there is a liquidity void located directly below this zone, there is a real possibility that price could break through it before finding stronger demand
For that reason, it is safer to wait for a clear rejection signal on the 15-minute timeframe before considering long positions from this level
If price continues to decline without showing any bullish confirmation, the next optimal buying level would be around 1.15938, where deeper liquidity and stronger demand are likely to be found

EUR/USD - Repeat of 2015 Cycle?🔁 Is History Repeating Itself on EUR/USD?
(Monthly timeframe breakdown — impulse, consolidation, sweep, impulse, pullback… all lining up again)
Your chart highlights two major market cycles, years apart, that look almost identical in structure. Let’s walk through it clearly.
✅ 1. First Cycle (2015–2018)
A) Consolidation Phase (Orange Box)
Price moved sideways for months.
No clear direction — accumulation/distribution.
Market was building energy.
B) Sweep / Manipulation
Price dipped below consolidation lows (labelled X).
Classic liquidity grab.
Smart money entry zone.
C) Impulse Phase (Green)
Strong bullish move immediately after the sweep.
Buyers stepped in aggressively.
Market structure shifted bullish.
D) Pullback Phase (Red)
First correction after the strong impulse.
Healthy sign — market resetting before continuation.
This forms the classic 4-step macro cycle:
👉 Consolidation → Sweep → Impulse → Pullback
✅ 2. Current Cycle (2023–2025)
Your right-side circle mirrors the exact same pattern.
A) Consolidation Phase (Orange Box)
Range-bound market identical to 2015–2016.
Energy building again.
B) Sweep / Manipulation
Price runs liquidity under the range.
Same "grab the lows before reversing" behaviour.
C) Impulse Phase (Green)
Strong bullish run out of the sweep.
Again, identical structure as the previous cycle.
D) Pullback Phase (Red)
Market currently correcting.
Exactly like the 2017 correction before continuation.
🔥 3. Are We Literally Repeating the Same Playbook?
Yes — the structure is almost a 1:1 replica.
Both cycles show:
✔ Long consolidation
✔ Sweep of the lows
✔ Major bullish impulse
✔ Initial corrective pullback
This suggests that EUR/USD is following the same macro script it used last time before rallying even further.
📈 4. What This Might Mean for Traders
If history continues to rhyme:
The current pullback may be the “reset” before another bullish leg.
The last time this pattern formed, price continued higher for months.
Smart money behaviour (sweep → impulse → pullback) indicates bullish continuation is likely, unless the pullback breaks the previous swing low.
🎯 5. Bottom Line
Yes — history is repeating itself.
The same 4-stage macro cycle is unfolding again:
Consolidation → Sweep → Impulse → Pullback → (Potential continuation)
Your chart perfectly highlights the symmetry, and traders should take note:
📍 If the macro structure remains valid, EUR/USD may be gearing up for another HTF bullish continuation.

US100 REBOUND AHEAD|LONG|
✅US100 is approaching a defined demand level where discount pricing aligns with bullish order flow. A potential rebound may deliver price toward the imbalance above. Time Frame 5H.
LONG🚀
✅Like and subscribe to never miss a new idea!✅

GBPUSD H1 Analysis (Bullish movement)After the strong bullish rally on GBPUSD, a short-term correction is expected toward the 1.31229 level before the pair potentially resumes its upward movement.
This retracement could serve as a healthy pullback within the overall bullish structure, allowing the market to gather more liquidity and confirm buyer interest. There is a trendline liquidity zone above the current price that may act as a magnet, attracting price higher once the retracement completes.
If bullish momentum continues, price could extend toward the 1.31845 level. However, it’s important to monitor price behavior around the first target zone to see whether buyers maintain control or if signs of exhaustion begin to appear.

CADJPY FREE SIGNAL|LONG|
✅CADJPY swept equal lows and shifted structure bullish after tapping a key discount zone. Price is likely to rebalance inefficiency toward premium liquidity above.
—————————
Entry: 110.512
Stop Loss: 110.239
Take Profit: 110.969
Time Frame: 4H
—————————
LONG🚀
✅Like and subscribe to never miss a new idea!✅

GBPCAD LOCAL LONG|
✅GBPCAD swept sell-side liquidity below a key low and rebounded from a refined demand zone, signaling potential bullish displacement toward the next internal range high. Time Frame 3H.
LONG🚀
✅Like and subscribe to never miss a new idea!✅

EURUSD bullish Signal 12 NovFollowing up on the previous EURUSD analysis, the price is expected to continue its upward movement, aiming to break the previous high and potentially reach the 1.16055 level.
However, before doing so, a short-term pullback could occur from the order block around 1.15675. This area represents a strong zone of previous momentum and liquidity, making it a key region to watch for potential reactions.
A sweep of liquidity from this zone could provide the necessary fuel for the next bullish leg. It is preferable to wait for confirmation — such as a 15-minute candle close inside the order block — before considering long entries, as this would strengthen the bullish bias and confirm order flow alignment.

EURUDF quick sell opportunityAfter EURUSD rallied from a strong order block zone, the pair is now expected to retrace from the 1.15833 level. This area aligns with potential short-term resistance and could trigger a bearish reaction targeting the trendline liquidity on the 15-minute timeframe.
The recent sweep of liquidity around this level reinforces its significance, suggesting that sell-side pressure may start building up. As a result, the price could move lower to capture liquidity resting beneath recent swing lows before finding new demand or continuing its broader trend.

CADCHF STRONG REJECTION|LONG|
✅CADCHF swept liquidity beneath the previous swing low and is now reacting from a clean demand block, hinting at a possible short-term reversal toward internal range liquidity. Time Frame 3H.
LONG🚀
✅Like and subscribe to never miss a new idea!✅

EURJPY FREE SIGNAL|SHORT|
✅EURJPY shows price delivery into a premium area, mitigating a clear supply level while forming bearish order flow. Short-term target sits below the recent internal range low. Time Frame 3H.
—————————
Entry: 178.640
Stop Loss: 178.900
Take Profit: 178.150
—————————
SHORT🔥
✅Like and subscribe to never miss a new idea!✅

EURCHF LOCAL LONG|
✅EURCHF tapped into a clean demand zone, sweeping liquidity below previous lows before showing bullish displacement. A retracement could now aim for the imbalance zone overhead. Time Frame 3H.
LONG🚀
✅Like and subscribe to never miss a new idea!✅

GAL Head & Shoulders Breakdown Ahead? | Smart Money Targeting FAThe Ghandhara Automobiles Limited (PSX: GAL) chart is showing a clear Head and Shoulders reversal pattern at the top of a long-term ascending channel — hinting at potential bearish movement before any new bullish cycle begins.
📊 Technical Insights:
🧩 Head & Shoulders Pattern signaling trend exhaustion.
🟪 IMB Zone (Imbalance) yet to be fully mitigated — price likely to rebalance before continuation.
🔻 Fundamental Area around 400–420 PKR could act as a major demand zone for Smart Money accumulation.
🟢 Long-term channel still intact, suggesting possible rebound after discount pricing.
💡 Outlook:
Expect short-term bearish pressure targeting the IMB and Fundamental Zone before the next potential bullish leg. Patience and confirmation at the lower levels will be key for investors and SMC traders.

EURGBP FREE SIGNAL|LONG|
✅EURGBP formed a clean liquidity sweep below the equal lows, tapping into a defined demand block before showing displacement to the upside. Targeting the imbalance left behind by impulsive selling.
—————————
Entry: 0.8770
Stop Loss: 0.8762
Take Profit: 0.8785
Time Frame: 2H
—————————
LONG🚀
✅Like and subscribe to never miss a new idea!✅
