GAL Head & Shoulders Breakdown Ahead? | Smart Money Targeting FAThe Ghandhara Automobiles Limited (PSX: GAL) chart is showing a clear Head and Shoulders reversal pattern at the top of a long-term ascending channel — hinting at potential bearish movement before any new bullish cycle begins.
📊 Technical Insights:
🧩 Head & Shoulders Pattern signaling trend exhaustion.
🟪 IMB Zone (Imbalance) yet to be fully mitigated — price likely to rebalance before continuation.
🔻 Fundamental Area around 400–420 PKR could act as a major demand zone for Smart Money accumulation.
🟢 Long-term channel still intact, suggesting possible rebound after discount pricing.
💡 Outlook:
Expect short-term bearish pressure targeting the IMB and Fundamental Zone before the next potential bullish leg. Patience and confirmation at the lower levels will be key for investors and SMC traders.
SMC-ICT

EURGBP FREE SIGNAL|LONG|
✅EURGBP formed a clean liquidity sweep below the equal lows, tapping into a defined demand block before showing displacement to the upside. Targeting the imbalance left behind by impulsive selling.
—————————
Entry: 0.8770
Stop Loss: 0.8762
Take Profit: 0.8785
Time Frame: 2H
—————————
LONG🚀
✅Like and subscribe to never miss a new idea!✅

SILVER WILL KEEP GROWING|LONG|
✅SILVER is rallying from a refined demand zone, showing bullish orderflow continuation. With liquidity swept below previous lows, institutions may target the next imbalance near $51.00. Time Frame 3H.
LONG🚀
✅Like and subscribe to never miss a new idea!✅

GBPCHF LOCAL SHORT|
✅GBPCHF is tapping into a clear supply level after an inefficient move upward. Institutional traders may look to rebalance the range by driving price toward the liquidity resting below 1.0590. Time Frame 3H.
SHORT🔥
✅Like and subscribe to never miss a new idea!✅

SPY FREE SIGNAL|SHORT|
✅SPY is currently retesting a premium supply zone after clearing buy-side liquidity. If the retest confirms rejection with displacement, a bearish continuation toward imbalance below is likely.
—————————
Entry: 670.89$
Stop Loss: 674.31$
Take Profit: 666.68$
Time Frame: 2H
—————————
SHORT🔥
✅Like and subscribe to never miss a new idea!✅

EURUSD MOVE UP AHEAD|LONG|
✅EURUSD retraced into a refined bullish order block within the discount zone, showing strong displacement after mitigation. Liquidity below equal lows has been swept, favoring a continuation toward premium imbalance. Time Frame 2H.
LONG🚀
✅Like and subscribe to never miss a new idea!✅

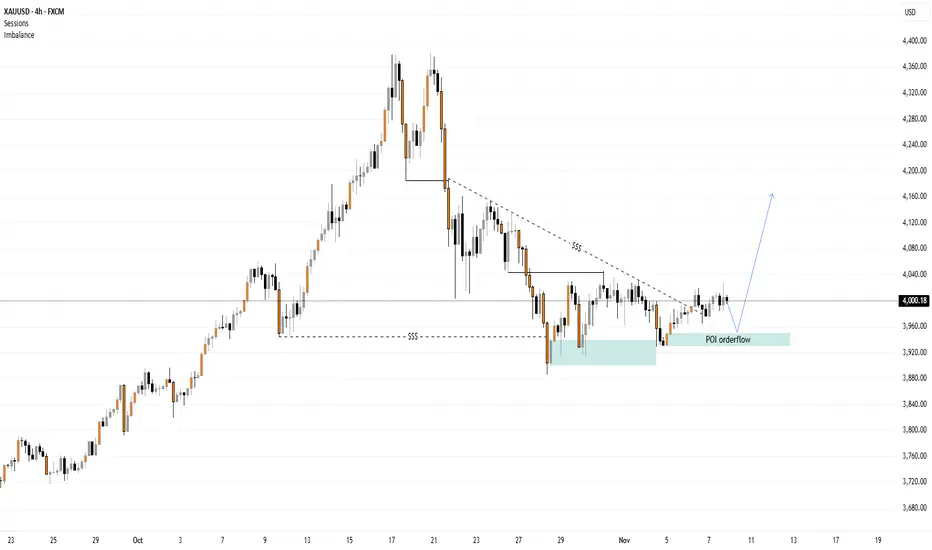
Gold Analysis H4 - Bullish orderflowAfter gold broke below the 3944.48 level, the market initially showed signs of further downside movement, potentially aiming to sweep more liquidity resting beneath that zone. However, the nature of the breakout suggests that it could itself be a liquidity grab rather than the start of a genuine bearish continuation.
The candle that broke this level was quickly rejected, indicating that selling pressure may have been absorbed by strong buy orders. This kind of price reaction often signals the presence of institutional accumulation or smart money activity.
As a result, the order flow now appears to be shifting, potentially preparing for a bullish move. If momentum continues to build, price may aim to sweep the liquidity resting above the trendline before deciding on the next directional move.
NZDUSD LOCAL SHORT|
✅NZDUSD Price retraced to a premium zone, tapping into an unmitigated supply block that aligns with prior imbalance. A short-term bearish delivery is expected toward the discounted area below. Time Frame 1H.
SHORT🔥
✅Like and subscribe to never miss a new idea!✅

GBPUSD BULLISH BREAKOUT|LONG|
✅GBPUSD after a clean breakout above the key level, price is retracing to rebalance inefficiency before likely expansion into buy-side liquidity. Smart money longs are now aligned with order flow. Time Frame 2H.
LONG🚀
✅Like and subscribe to never miss a new idea!✅

US100 FREE SIGNAL|SHORT|
✅US100 is pushing towards the premium supply zone and after a liquidity sweep above short-term highs we will expect continuation toward the next downside inefficiency as sell-side liquidity gets targeted on Monday!
—————————
Entry: 25,115.5$
Stop Loss: 25,200$
Take Profit: 24,900$
Time Frame: 3H
—————————
** SHORT🔥
✅Like and subscribe to never miss a new idea!✅

NZDCHF REBOUND AHEAD|LONG|
✅NZDCHF is tapping into a major demand zone after a deep liquidity sweep and imbalance fill. Expect bullish reaction as price seeks to rebalance inefficiency toward the next liquidity pool. Time Frame 4H.
LONG🚀
✅Like and subscribe to never miss a new idea!✅

GBPCAD FREE SIGNAL|
✅GBPCAD tapped into a premium supply zone and reacted with bearish displacement, confirming distribution phase. Expect continuation toward the next internal liquidity pool below. Time Frame 4H.
SHORT🔥
✅Like and subscribe to never miss a new idea!✅

EURAUD LOCAL SHORT|
✅EURAUD Price reached a premium supply level, engineered liquidity above equal highs, and confirmed bearish displacement. Expect continuation lower as smart money targets sell-side liquidity below. Time Frame 3H.
SHORT🔥
✅Like and subscribe to never miss a new idea!✅

EURUSD CORRECTION AHEAD|SHORT|
✅EURUSD retraced into a premium supply level after a clear bearish displacement, mitigating an order block and collecting liquidity above short-term highs. Expect continuation toward the downside. Time Frame 3H.
SHORT🔥
✅Like and subscribe to never miss a new idea!✅

NZDCAD WILL FALL|SHORT|
✅NZDCAD has pulled back into a premium supply zone after a displacement leg that broke structure. Liquidity above internal highs has likely been swept—expect a move toward the next imbalance. Time Frame 3H.
SHORT🔥
✅Like and subscribe to never miss a new idea!✅

SILVER FREE SIGNAL|SHORT|
✅SILVER Price is reacting from the supply level after a strong retracement, confirming sellers’ presence. Expect a move toward the $47.80 target area.
—————————
Entry: $48.20
Stop Loss: $48.45
Take Profit: $47.80
Time Frame: 2H
—————————
SHORT🔥
✅Like and subscribe to never miss a new idea!✅

USOIL LOCAL LONG|
✅WTI OIL is expected to bounce from the demand level near $60.00, targeting the $60.70 resistance zone as bullish momentum builds. Time Frame 3H.
LONG🚀
✅Like and subscribe to never miss a new idea!✅

GBPAUD BEARISH WEDGE PATTERN|SHORT|
✅GBPAUD price is consolidating in a bearish wedge after a sharp drop, suggesting continuation toward the 1.9950 target zone once support breaks. Time Frame 5H.
SHORT🔥
✅Like and subscribe to never miss a new idea!✅

GOLD MASSIVE DEMAND LEVEL BELOW|LONG|
✅XAUUSD Price is about to retest a massive demand area after a clean downside move. A strong bullish reaction could send it toward 3,960$ as a short-term target. Time Frame 2H.
LONG🚀
✅Like and subscribe to never miss a new idea!✅

SPY DEMAND LEVEL BELOW|LONG|
✅SPY tapped into the demand level and printed bullish reaction wicks, signaling a short-term rebound toward 678$. Liquidity above minor highs could be targeted. Time Frame 2H.
LONG🚀
✅Like and subscribe to never miss a new idea!✅

NZDJPY FREE SIGNAL|LONG|
✅NZDJPY Price has tapped into the demand level with a clean rejection wick, signaling potential short-term bullish reversal toward 87.40. Liquidity resting above equal highs could attract price.
—————————
Entry: 86.95
Stop Loss: 86.64
Take Profit: 87.40
Time Frame: 2H
—————————
LONG🚀
✅Like and subscribe to never miss a new idea!✅

GOLD LOCAL SHORT|
✅XAUUSD Price has tapped into a strong supply level and is expected to retest it soon before continuing lower. Liquidity above recent highs has been taken, suggesting bearish delivery toward 3980$. Time Frame 2H.
SHORT🔥
✅Like and subscribe to never miss a new idea!✅
