USD-CHF Local Long! Buy!
Hello,Traders!
USDCHF will tap into the horizontal demand area, where Smart Money aims to collect liquidity before a bullish expansion. Expect price to target inefficiency near 0.7974. Time Frame 2H.
Buy!
Comment and subscribe to help us grow!
Check out other forecasts below too!
Disclosure: I am part of Trade Nation's Influencer program and receive a monthly fee for using their TradingView charts in my analysis.
SMC

NZDCAD WILL GROW|LONG|
✅NZDCAD Price reacted from the daily demand level after a clean liquidity sweep below equal lows. Smart money buyers are now targeting buy-side liquidity near 0.8155. Time Frame 4H.
LONG🚀
✅Like and subscribe to never miss a new idea!✅

GBP-USD Will Keep Growing! Buy!
Hello,Traders!
GBPUSD Price broke structure above the horizontal demand area, showing smart money accumulation before a possible continuation. Liquidity below has been swept, confirming bullish intent. Time Frame 1H.
Buy!
Comment and subscribe to help us grow!
Check out other forecasts below too!
Disclosure: I am part of Trade Nation's Influencer program and receive a monthly fee for using their TradingView charts in my analysis.

Bearish Movement Coming UpPotential move to the downside, waiting for price to make it up to at least 50% of the operative range, aligning with an Bearish OB.

Order Blocks: Where Smart Money Leaves Its Footprints“The market doesn’t move randomly.
Every big push leaves a shadow — a clue of who was in control.”
That clue is what traders call an Order Block .
What is an Order Block?
An Order Block (OB) is the last bullish or bearish candle before a strong impulsive move in the opposite direction.
Think of it as the area where institutions placed their orders to fuel that move.
In an uptrend , look for the last down candle before a strong rally.
In a downtrend , look for the last up candle before a sharp drop.
These zones often act like magnets — price revisits them to “retest” before continuing.
Why Do Order Blocks Matter?
They reveal where the big money entered.
They create high-probability zones for entries.
They help traders avoid chasing moves at highs or lows.
How to Spot an Order Block
Identify a strong impulsive move (long-bodied candles, clear displacement).
Mark the last opposite candle before that move.
Wait for price to return to that zone.
Look for LTF confirmation — a ChoCH, BOS, or rejection wick.
Align with higher timeframe bias (H4/H1) for best results.
Example
Refer to the XAUUSD M15 chart above:
Gold formed a strong bullish rally, leaving behind a bullish order block zone at 3764.5 – 3757.5 .
When price retraced into this OB, it tapped liquidity from the stop area, then gave LTF confirmation (micro structure shift).
This long setup delivered an impressive 1:8 RR rally for disciplined traders who waited for the OB mitigation and entry confirmation.
Smart money doesn’t chase price — it waits for the market to come back home.
But here’s the secret most traders miss:
Order blocks alone are never the full story.
They work best when combined with liquidity sweeps, structure shifts, and precise timing .
That’s where the deeper edge lies — and it’s what separates surface-level knowledge from mastery.
📘 Shared by @ChartIsMirror

GBPUSD LOCAL LONG|
✅GBPUSD Smart money trapped liquidity below demand with a fakeout, before shifting orderflow bullish. ICT concepts show price now seeks external liquidity higher. Time Frame 4H.
LONG🚀
✅Like and subscribe to never miss a new idea!✅

USOIL WILL GO DOWN|SHORT|
✅WTI OIL Price rejects supply after distribution and forms bearish orderflow, ICT suggests liquidity is being targeted below. Market likely seeks drawdown into 60.00 demand imbalance. Time Frame 4H.
SHORT🔥
✅Like and subscribe to never miss a new idea!✅

GOLD Strong Supply Zone 3900$! Sell!
Hello,Traders!
GOLD SMC expects a rejection from the $3,900 strong supply zone. Smart Money confirms short positioning as price hunts inefficiencies, with liquidity pools sitting below.
Time Frame: 1H
Sell!
Comment and subscribe to help us grow!
Check out other forecasts below too!
Disclosure: I am part of Trade Nation's Influencer program and receive a monthly fee for using their TradingView charts in my analysis.

GOLD FREE SIGNAL|SHORT|
✅XAUUSD Price pushes back into supply as ICT logic signals distribution near highs. Liquidity sits above the prior top, and a retest of all-time high levels could provide engineered exit points.
—————————
Entry: 3,887$
Stop Loss: 3,896$
Take Profit: 3,876$
Time Frame: 1H
—————————
SHORT🔥
✅Like and subscribe to never miss a new idea!✅

NZD-CAD Free Signal! Buy!
Hello,Traders!
NZDCAD taps into demand and holds structure, with Smart Money accumulation pointing to higher pricing. Imbalance fills hint at continuation toward premium levels.
-------------------
Stop Loss: 0.8105
Take Profit: 0.8158
Entry: 0.8136
Time Frame: 3H
-------------------
Buy!
Comment and subscribe to help us grow!
Check out other forecasts below too!
Disclosure: I am part of Trade Nation's Influencer program and receive a monthly fee for using their TradingView charts in my analysis.

CHF-JPY Short From Supply Ahead! Sell!
Hello,Traders!
CHFJPY is about to retest the horizontal supply area, where Smart Money seeks to mitigate orders. A rejection from this zone signals distribution, with price likely to rebalance inefficiency toward 184.95. Time Frame 3H.
Sell!
Comment and subscribe to help us grow!
Check out other forecasts below too!
Disclosure: I am part of Trade Nation's Influencer program and receive a monthly fee for using their TradingView charts in my analysis.

GOLD PULLBACK AHEAD|SHORT|
✅XAUUSD rejects the wide supply zone, showing bearish order flow as price seeks a liquidity draw lower. The move aligns with ICT principles, targeting inefficiency cleanup around 3,844$. Time Frame 1H.
SHORT🔥
✅Like and subscribe to never miss a new idea!✅

SILVER Local Short! Sell!
Hello,Traders!
SILVER is about to reject the horizontal supply zone after liquidity sweep, confirming Smart Money distribution. Price is set to rebalance inefficiency with target aligned near $4,690. Time Frame 3H.
Sell!
Comment and subscribe to help us grow!
Check out other forecasts below too!
Disclosure: I am part of Trade Nation's Influencer program and receive a monthly fee for using their TradingView charts in my analysis.

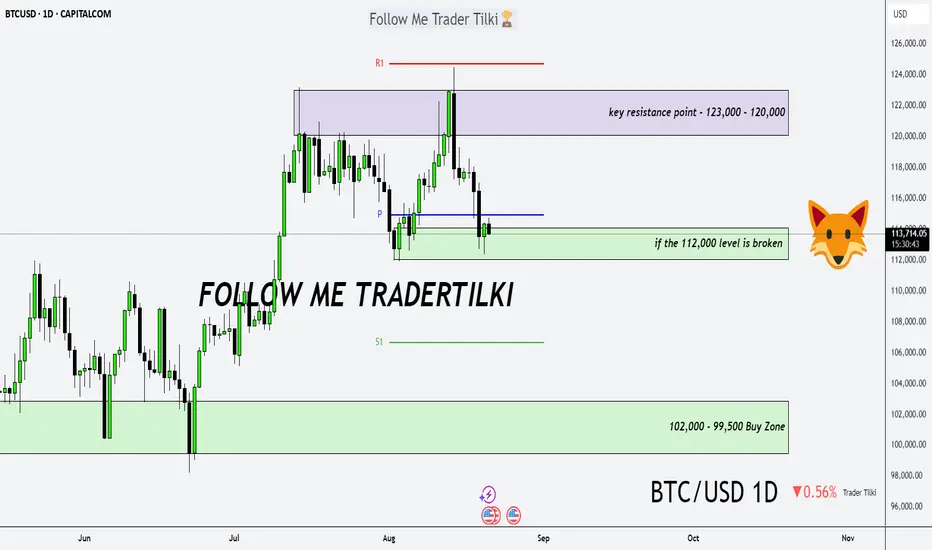
Bitcoin Daily Analysis – The Trend Is Our FriendGood morning, Guys,
I’ve prepared a fresh Bitcoin analysis for you.
🔹 First off, I stand firmly behind my long-term targets of **127,000 – 137,000 – 146,000**. I previously shared these levels with you in a weekly analysis.
🔍 Now let’s shift to the 1-day chart:
What is Bitcoin telling us right now?
📉 If the **112,000 level breaks downward**, we could enter a correction phase toward **102,000** or even **99,500**. I expect strong buying interest to return from those zones.
📈 After that, we’re facing a key resistance structure between **123,000 – 120,000**.
But I believe this zone will also be broken—because we’re in an **uptrend**, and…
💬 **The trend is our friend. Never forget that.**
DAX Bearish Bias! Sell!
Hello,Traders!
DAX taps into horizontal supply where Smart Money distributes orders. The rejection signals bearish flow, with liquidity likely drawn toward inefficiency near 24,300 zone. Time Frame 3H.
Sell!
Comment and subscribe to help us grow!
Check out other forecasts below too!
Disclosure: I am part of Trade Nation's Influencer program and receive a monthly fee for using their TradingView charts in my analysis.

EURUSD FREE SIGNAL|SHORT|
✅EURUSD formed a triple top near premium structure, signaling exhaustion. Break below neckline confirms bearish intent, with liquidity draw targeting imbalance around 1.1670 zone. Time Frame: 3H.
—————————
Entry: 1.1720
Stop Loss: 1.1755
Take Profit: 1.1670
Time Frame: 3H
Risk: High
—————————
SHORT🔥
✅Like and subscribe to never miss a new idea!✅

ETHEREUM LOCAL SHORT|
✅ETHUSD rejected a premium supply level, showing displacement after inefficiency fill. Order flow signals bearish intent, with liquidity below 4,320$ likely targeted for rebalancing. Time Frame 8H.
SHORT🔥
✅Like and subscribe to never miss a new idea!✅

GBP-NZD Free Signal! Sell!
Hello,Traders!
GBPNZD rejected a premium supply zone after liquidity sweep, confirming smart money distribution. Price aims to rebalance inefficiency below, with sell-side liquidity at 2.3074 in focus.
-------------------
Stop Loss: 2.3152
Take Profit: 2.3074
Entry: 2.3120
Time Frame: 3H
-------------------
Sell!
Comment and subscribe to help us grow!
Check out other forecasts below too!
Disclosure: I am part of Trade Nation's Influencer program and receive a monthly fee for using their TradingView charts in my analysis.

EURUSD buy opportunity There is a current buying opportunity on the EURUSD to break the previous high and collect more liquidity and fill the large liquidity void resulting from the sharp drop that occurred on September 24th

USOIL STRONG DEMAND AREA|LONG|
✅WTI OIL price reacts at demand level, showing signs of absorption with liquidity grabs. ICT model points to bullish orderflow aiming for the nearby target zone. Time Frame: 4H.
LONG🚀
✅Like and subscribe to never miss a new idea!✅

Gbp/Usd - SMC Setup, Demand Zone Reaction Loading Price is currently pulling back after a strong bullish impulse, showing signs of a potential continuation to the upside.
Key Observations:
BOS (Break of Structure): Multiple bullish BOS confirm market structure shift.
Support Zone: Price is approaching a key demand area that previously led to a strong rally.
Liquidity Target: A weak high is identified above, likely to be taken out in the next bullish leg.
Projected Price Action: Expecting a deeper pullback into support before a bullish reversal targeting the weak high and beyond.
Trade Idea:
Wait for confirmation inside the support zone (e.g., bullish engulfing or break of short-term lower high).
Entry: Upon confirmation in the support zone.
Target: Above 1.35200 – targeting liquidity and weak high.
Stop Loss: Below the support zone (low of the demand area).

CRUDE OIL Free Signal! Buy!
Hello,Traders!
CRUDE OIL taps into a horizontal demand area, showing strong bullish reaction. Liquidity beneath recent lows is swept, signalling smart money positioning for upside continuation.
-------------------
Stop Loss: 61.35$
Take Profit: 62.87$
Entry: 61.94$
Time Frame: 8H
-------------------
Buy!
Comment and subscribe to help us grow!
Check out other forecasts below too!
Disclosure: I am part of Trade Nation's Influencer program and receive a monthly fee for using their TradingView charts in my analysis.

SPY MONEY PRINTER GO BRRR|LONG|
✅SPY with the FED lowering rates, liquidity injections perspective fuel risk assets. Price has broken out above the key level, signaling bullish order flow. SMC outlook suggests momentum could push into new all-time highs as money printer effects unfold. Time Frame 1H.
LONG🚀
✅Like and subscribe to never miss a new idea!✅
