Bitcoin Daily Analysis – The Trend Is Our FriendGood morning, Guys,
I’ve prepared a fresh Bitcoin analysis for you.
🔹 First off, I stand firmly behind my long-term targets of **127,000 – 137,000 – 146,000**. I previously shared these levels with you in a weekly analysis.
🔍 Now let’s shift to the 1-day chart:
What is Bitcoin telling us right now?
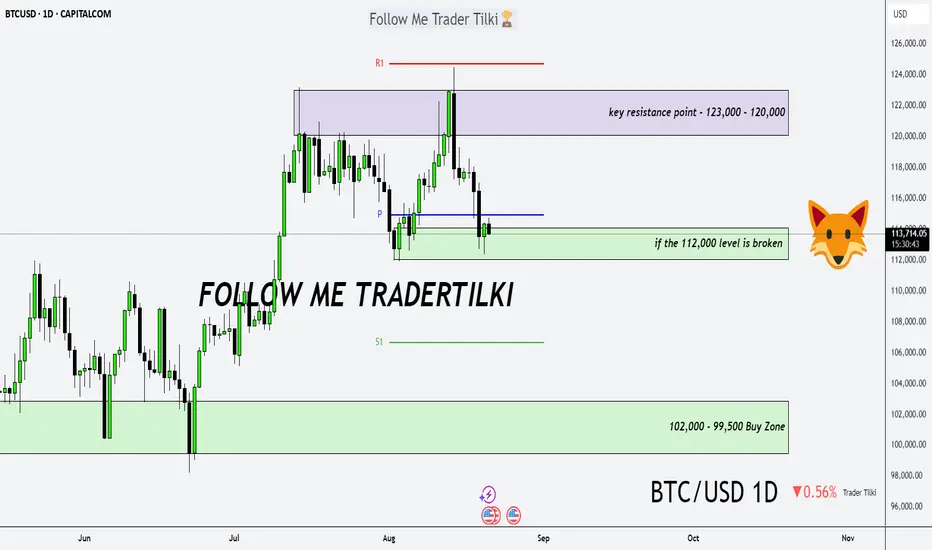
📉 If the **112,000 level breaks downward**, we could enter a correction phase toward **102,000** or even **99,500**. I expect strong buying interest to return from those zones.
📈 After that, we’re facing a key resistance structure between **123,000 – 120,000**.
But I believe this zone will also be broken—because we’re in an **uptrend**, and…
💬 **The trend is our friend. Never forget that.**
SMC
DAX Bearish Bias! Sell!
Hello,Traders!
DAX taps into horizontal supply where Smart Money distributes orders. The rejection signals bearish flow, with liquidity likely drawn toward inefficiency near 24,300 zone. Time Frame 3H.
Sell!
Comment and subscribe to help us grow!
Check out other forecasts below too!
Disclosure: I am part of Trade Nation's Influencer program and receive a monthly fee for using their TradingView charts in my analysis.

EURUSD FREE SIGNAL|SHORT|
✅EURUSD formed a triple top near premium structure, signaling exhaustion. Break below neckline confirms bearish intent, with liquidity draw targeting imbalance around 1.1670 zone. Time Frame: 3H.
—————————
Entry: 1.1720
Stop Loss: 1.1755
Take Profit: 1.1670
Time Frame: 3H
Risk: High
—————————
SHORT🔥
✅Like and subscribe to never miss a new idea!✅

ETHEREUM LOCAL SHORT|
✅ETHUSD rejected a premium supply level, showing displacement after inefficiency fill. Order flow signals bearish intent, with liquidity below 4,320$ likely targeted for rebalancing. Time Frame 8H.
SHORT🔥
✅Like and subscribe to never miss a new idea!✅

GBP-NZD Free Signal! Sell!
Hello,Traders!
GBPNZD rejected a premium supply zone after liquidity sweep, confirming smart money distribution. Price aims to rebalance inefficiency below, with sell-side liquidity at 2.3074 in focus.
-------------------
Stop Loss: 2.3152
Take Profit: 2.3074
Entry: 2.3120
Time Frame: 3H
-------------------
Sell!
Comment and subscribe to help us grow!
Check out other forecasts below too!
Disclosure: I am part of Trade Nation's Influencer program and receive a monthly fee for using their TradingView charts in my analysis.

EURUSD buy opportunity There is a current buying opportunity on the EURUSD to break the previous high and collect more liquidity and fill the large liquidity void resulting from the sharp drop that occurred on September 24th

USOIL STRONG DEMAND AREA|LONG|
✅WTI OIL price reacts at demand level, showing signs of absorption with liquidity grabs. ICT model points to bullish orderflow aiming for the nearby target zone. Time Frame: 4H.
LONG🚀
✅Like and subscribe to never miss a new idea!✅

Gbp/Usd - SMC Setup, Demand Zone Reaction Loading Price is currently pulling back after a strong bullish impulse, showing signs of a potential continuation to the upside.
Key Observations:
BOS (Break of Structure): Multiple bullish BOS confirm market structure shift.
Support Zone: Price is approaching a key demand area that previously led to a strong rally.
Liquidity Target: A weak high is identified above, likely to be taken out in the next bullish leg.
Projected Price Action: Expecting a deeper pullback into support before a bullish reversal targeting the weak high and beyond.
Trade Idea:
Wait for confirmation inside the support zone (e.g., bullish engulfing or break of short-term lower high).
Entry: Upon confirmation in the support zone.
Target: Above 1.35200 – targeting liquidity and weak high.
Stop Loss: Below the support zone (low of the demand area).

CRUDE OIL Free Signal! Buy!
Hello,Traders!
CRUDE OIL taps into a horizontal demand area, showing strong bullish reaction. Liquidity beneath recent lows is swept, signalling smart money positioning for upside continuation.
-------------------
Stop Loss: 61.35$
Take Profit: 62.87$
Entry: 61.94$
Time Frame: 8H
-------------------
Buy!
Comment and subscribe to help us grow!
Check out other forecasts below too!
Disclosure: I am part of Trade Nation's Influencer program and receive a monthly fee for using their TradingView charts in my analysis.

SPY MONEY PRINTER GO BRRR|LONG|
✅SPY with the FED lowering rates, liquidity injections perspective fuel risk assets. Price has broken out above the key level, signaling bullish order flow. SMC outlook suggests momentum could push into new all-time highs as money printer effects unfold. Time Frame 1H.
LONG🚀
✅Like and subscribe to never miss a new idea!✅

BITCOIN Strong Rejection! Sell!
Hello,Traders!
BITCOIN After a sharp push into the horizontal supply area, price printed a fakeout and rejected liquidity above. SMC outlook suggests downside continuation toward intraday inefficiency fills. Time Frame 2H.
Sell!
Comment and subscribe to help us grow!
Check out other forecasts below too!
Disclosure: I am part of Trade Nation's Influencer program and receive a monthly fee for using their TradingView charts in my analysis.

NZDCAD FREE SIGNAL|SHORT|
✅NZDCAD Price has tapped into the supply level after a corrective push, rejecting inefficiency and signaling continuation lower. ICT perspective suggests targeting liquidity resting below recent lows. Time Frame 4H.
—————————
Entry: 0.8115
Stop Loss: 0.8135
Take Profit: 0.8085
Time Frame: 4H
—————————
SHORT🔥
✅Like and subscribe to never miss a new idea!✅

EUR-JPY Rebound Ahead! Buy!
Hello,Traders!
EURJPY price tapped into the horizontal demand area, after a sharp decline, sweeping liquidity and rejecting imbalance. From an SMC viewpoint, we anticipate a relief rally toward the marked target level. Time Frame 5H.
Buy!
Comment and subscribe to help us grow!
Check out other forecasts below too!
Disclosure: I am part of Trade Nation's Influencer program and receive a monthly fee for using their TradingView charts in my analysis.

BUY IDEA FOR GOLD! 🔎 Trade Setup Analysis
We’re currently seeing liquidity forming above/below recent highs and lows. I’m waiting for a Change of Character (ChoCh), which would confirm that the market is shifting direction. Once the ChoCh occurs, I’ll anticipate a retracement into my Fair Value Gap (FVG) zone.
📉 Entry Plan
I expect price to dip into the identified FVG zone, which aligns with an area of imbalance and potential demand.
From this level, I’ll look to take a buy position, as the mitigation of the FVG could act as a springboard for continuation to the upside.
🎯 Targets
First target: recent liquidity highs (to secure partial profits).
Second target: higher timeframe imbalance zone or next liquidity pool.
⚠️ Risk Management
Stop loss will be placed just below the FVG zone (to protect against deeper liquidity grabs).
Risk-to-reward ratio aimed at minimum 1:3 for the trade.
📊 Bias
The structure suggests a bullish continuation once the retracement is complete, provided the ChoCh confirms momentum shift.

GBP/JPY - Breakdown 1H🔥 GBP/JPY – 1H Breakdown 🔥
Alright fam, let’s cook this chart 👇
📊 Structure Check
Price has been tanking hard from that 4H supply zone up top.
We formed a lower high (LP S) and then rolled over, continuing bearish structure.
Currently price is consolidating under a descending trendline → looks like it’s coiling for a move.
🎯 Key Zones
Upside liquidity grab: Price could squeeze into that 71% retrace + 15M/1H supply pocket.
🔼 That’s the “snack stop” zone before bigger players slam it.
Downside magnet: We’ve got strong support marked lower (blue zone). That’s the real draw if supply holds.
🛠️ Scenarios
Fakeout Pump → Dump
Price squeezes up into that 71% + supply zone.
Liquidity gets eaten → sellers step in.
Drop straight into strong support.
Direct Breakdown
If no pump happens, this wedge could just crack down.
Same target: strong support area below.
⚖️ Bias
Short-term bullish liquidity sweep possible 🚀
But overall still bearish until strong support proves otherwise.
📝 Game Plan
Watch the 71% + supply combo for rejection entries 🎯
Target the support zone below
Manage risk – don’t chase mid-range chop
⏳ Looks like GBP/JPY wants to bait longs before flushing again. Stay sharp, fam.

CRUDE OIL Will Grow! Buy!
Hello,Traders!
CRUDE OIL after sweeping liquidity from the horizontal demand area, price shows signs of rebalancing inefficiency. From an SMC perspective, buyers may drive the market toward the marked target zone. Time Frame 5H.
Buy!
Comment and subscribe to help us grow!
Check out other forecasts below too!
Disclosure: I am part of Trade Nation's Influencer program and receive a monthly fee for using their TradingView charts in my analysis.

AUDCAD LOCAL CORRECTION|SHORT|
✅AUDCAD price taps into the supply level after an extended rally, hinting at distribution. From an ICT view, this area may trigger a shift in order flow, drawing price toward inefficiency and the marked target zone. Time Frame 4H.
SHORT🔥
✅Like and subscribe to never miss a new idea!✅

AUD-USD Short From Supply Level! Sell!
Hello,Traders!
AUDUSD shows a rejection from the horizontal supply area, signaling Smart Money distribution at premium levels. Price action suggests liquidity sweep above resistance before shifting flow downward. Time Frame 3H.
Sell!
Comment and subscribe to help us grow!
Check out other forecasts below too!
Disclosure: I am part of Trade Nation's Influencer program and receive a monthly fee for using their TradingView charts in my analysis.

NZDUSD FREE SIGNAL|SHORT|
✅NZDUSD from ICT perspective highlights a bearish order flow after price taps into supply. The rejection aligns with premium levels, confirming inefficiency fill and drawing liquidity lower.
—————————
Entry: 0.5798
Stop Loss: 0.5820
Take Profit: 0.5778
Time Frame: 6H
—————————
SHORT🔥
✅Like and subscribe to never miss a new idea!✅

SILVER Free Signal! Sell!
Hello,Traders!
SILVER Triple-top rejection at premium levels confirms distribution phase. SMC shows liquidity sweep above highs before sharp drop through neckline, shifting order flow bearish.
-------------------
Stop Loss: 4,721$
Take Profit: 4,537$
Entry: 4,632$
Time Frame: 3H
-------------------
Sell!
Comment and subscribe to help us grow!
Check out other forecasts below too!
Disclosure: I am part of Trade Nation's Influencer program and receive a monthly fee for using their TradingView charts in my analysis.

NZDJPY LONG FROM DEMAND LEVEL|
✅NZDJPY Price is tapping into a higher-timeframe demand zone, where ICT logic highlights discounted entry levels after sustained bearish order flow. Liquidity resting below prior lows is swept, creating conditions for a relief move toward premium levels. Time Frame 5H.
LONG🚀
✅Like and subscribe to never miss a new idea!✅

EUR-NZD Bearish Breakout! Sell!
Hello,Traders!
EURNZD price has broken down from a rising wedge structure, signaling Smart Money shift from accumulation to distribution. SMC suggests bearish momentum towards the 2.0180 target zone. Time Frame 2H.
Sell!
Comment and subscribe to help us grow!
Check out other forecasts below too!
Disclosure: I am part of Trade Nation's Influencer program and receive a monthly fee for using their TradingView charts in my analysis.

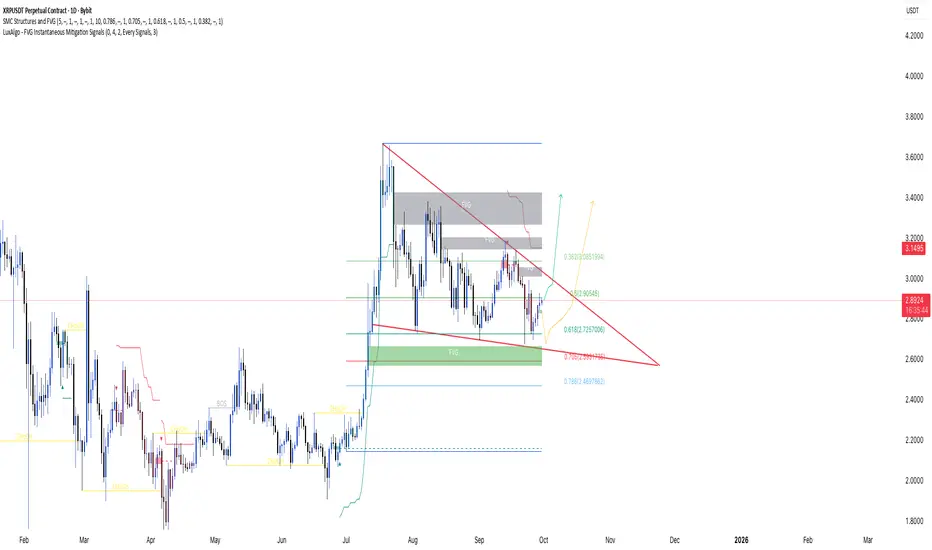
XRPUSDT 1D falling wedge coiling for breakoutPrice is compressing inside a falling wedge with demand below 2.72. A clean daily close above 2.98 opens 3.05 then 3.15.
Trend is corrective after the July impulse, printing lower highs inside a falling wedge. Internal structure is bearish-to-neutral, but compression suggests energy building for a break. Price sits mid range near the 0.5 retracement, with external liquidity resting above 3.05 to 3.15 and equal lows below 2.55 to 2.47. A daily break and hold above the wedge top would mark a change of character back to bullish; a sweep into the lower green box keeps the larger uptrend corrective.
Levels
Wedge resistance: 2.98
FVG supply ceiling: 3.15
0.5 retracement: 2.905
0.618 retracement: 2.726
Liquidity below swing lows: 2.470
Plan A
Trigger and confirmation
Wait for a daily close above 2.98 and the wedge trendline. Look for a retest that holds as a bullish order block or a higher low on 4H.
Invalidation level
A daily close back inside the wedge or below 2.86.
Targets: TP1, TP2, runner
TP1 3.05, TP2 3.15, runner 3.35 toward prior range high.
What would invalidate the idea
Failure to hold the breakout retest and sustained acceptance back under 2.90.
Plan B
If price sweeps the downside first, watch 2.72 to 2.60. Trigger on a sweep and reclaim of 2.70 with a 4H change of character.
Invalidation and targets
Invalidation on a daily close below 2.47. Targets 2.90, 3.05, 3.15.
Confluence
EMAs 20 and 50 are flattening while the 200 remains upsloping, consistent with a corrective pause. RSI is holding near 50 with mild bullish divergence versus the September swing low. Volume has compressed during the wedge, so expansion after a break should confirm. Volume profile favors 2.90 as a local point of control, with value area low near 2.70 aligning with the 0.618. Fib context places current price near the 50 level, with discount bids in the 62 to 79 zone.
Risk
Define risk at invalidation, not by feel. Size positions so a full stop hit is tolerable. Wait for confirmation instead of chasing the first spike.
Disclaimer
Educational content only and not financial advice