Profitable Multiple Time Frames Smart Money Strategy For Trading
In this post, I will share with you a very accurate and profitable SMC Smart Money trading strategy that combines top-down analysis, liquidity, imbalance, order block and inducement.
Step 1 - Identify liquidity zones on a daily
Liquidity zones are the areas on a price chart, where big players are placing their orders. From such areas, significant bullish and bearish movements initiate.
Liquidity zones that are above the current price will be the supply zones, while the liquidity zones that are below the current price will be the demand zones.
We will look for shorting opportunities from supply areas and for buying opportunities from demand zones.
Here are the liquidity zones that I identified on EURJPY.
Step 2 - Wait for a test of one of the liquidity zones
Let the market test the liquidity zone.
For buying, the price should reach a lower boundary of a demand zone.
For shorting, the price should test an upper boundary of a supply zone.
I underlined the exact levels that the price should test on EURJPY.
Here is the test of the lower boundary of the demand zone.
Step 3 - Look for inducement on an hourly time frame
With the inducement, smart money make the market participants think that the liquidity zone that the price is testing doesn't hold anymore.
When the price tests a supply area, an hourly candle close above its upper boundary will be a bullish inducement.
With that, the smart money incentivize buying orders.
When the price tests a demand area, an hourly candle close below its lower boundary will be a bearish inducement.
With that, the smart money incentivize selling orders.
The price closed below a lower boundary of a demand zone on EURJPY on 1H time frame.
Step 4 - Look for imbalance on an hourly time frame
After a violation of a supply area on an hourly time frame, look for a bearish imbalance.
Bearish imbalance is a strong bearish candle with wide range and big body. With that candle, the market should return within a supply zone and closed within or below that.
After a violation of a demand area on an hourly time frame, look for a bullish imbalance.
Bullish imbalance is a strong bullish candle with wide range and big body. With that candle, the market should return within a demand zone and closed within or above that.
Here is the example of a bullish imbalance on EURJPY.
After a bearish inducement, the price formed a high momentum bullish candle and closed within the demand zone.
The imbalance signify that a liquidity zone violation was a trap .
With that, smart money simply was trying to grab the liquidity.
That will be a signal for you to open an order.
Step 5 - Look for an order block
After the formation of the imbalance, the market becomes locally week and quite often corrects to an order block.
Order block will be the closest hourly liquidity zone.
After a formation of a bearish imbalance, look for a supply zone on an hourly time frame. That will be your perfect zone to sell .
After a formation of a bullish imbalance, look for a demand zone on an hourly. That will be your area to buy from.
Here is the order block on EURJPY.
Step 6 - Set a limit order
Set a sell limit order within a supply area after a formation of bearish imbalance on an hourly time frame.
Set a buy limit order within a demand area after a formation of a bullish imbalance on an hourly.
Here is your buy entry level on EURJPY.
Step 7 - Select the target
If you sell, your target should be the closest daily structure support: horizontal or vertical one.
If you buy, your target should be the closest daily structure resistance: horizontal or vertical one.
In our example, our closest structure resistance if a falling trend line.
Step 8 - Set stop loss
If you sell, stop loss will lie above a bullish inducement.
If you buy, stop loss will lie below a bearish inducement.
Here is a perfect point for a stop loss for a long trade on EURJPY.
Step 9 - Trade
Let the price trigger your entry, and then be prepared to wait.
It took many days for EURJPY to reach the target.
Trading Tips:
1. Make sure that you have a positive reward/ratio. It should be at least 1.2
2. Risk no more that 1% of your trading account per trade
Being applied properly, that strategy shows 70%+ accuracy.
Try it by yourself and let me know your results.
❤️Please, support my work with like, thank you!❤️
I am part of Trade Nation's Influencer program and receive a monthly fee for using their TradingView charts in my analysis.
SMC

GBP/JPY - Multi timeframe Analysis (We are ready to sell off)🔥 GBP/JPY – Forecast Breakdown 🔥
Alright traders, let’s slice this beast up 👇
🕰 Weekly View
We’re chilling right inside that weekly supply zone after sweeping the BSL. Price already showed signs of exhaustion here, and the structure screams: "Yo, we might dip." If sellers hold this fort, the swing could correct toward the mid-190s — right where demand is waiting.
📅 Daily Structure
Daily chart shows price running liquidity above 200/201 and tapping into resistance. BOS candles already printed earlier in the leg up, so this could be the last stop hunt before a deeper pullback. Daily demand sits 197 – 196, prime snack zone 🍫 for buyers to reload.
⏱ 4H Breakdown
On the 4H, we’ve got:
71% fib reaction ✅
BOS and liquidity sweep above 200.5
Market tapping into a 4H supply zone
That’s textbook SMC (smart money concepts) for a reversal play. Expectation? A possible short run back into 198 – 197, lining up with the daily zone.
🎯 Summary
Weekly : Tapped supply, sellers flexing 💪
Daily : Liquidity grab above 200, correction eyed
4H : 71% retrace + supply reaction, bearish pressure building
Bias → Short-term bearish targeting 198 – 197. Watch for rejections at current levels, but if buyers somehow break above 202, then the short idea is invalidated.
⚠️ Risk note: Stay nimble, this pair moves like a rocket 🚀 and can hunt stops fast.

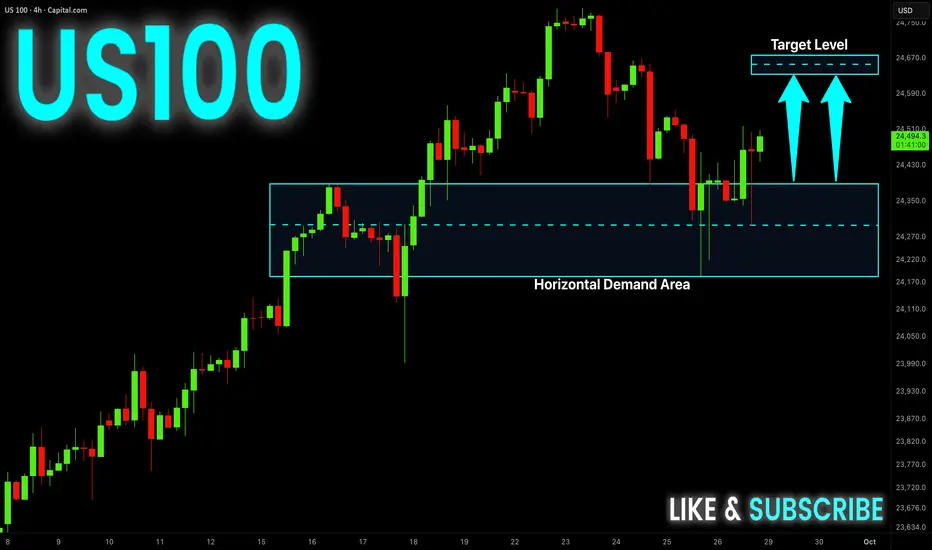
US100 Will Keep Growing! Buy!
Hello,Traders!
US100 Price reacts from the horizontal demand area, shifting order flow bullish. SMC structure favors upside with liquidity targets set at 24,670 zone. Time Frame 4H.
Buy!
Comment and subscribe to help us grow!
Check out other forecasts below too!
Disclosure: I am part of Trade Nation's Influencer program and receive a monthly fee for using their TradingView charts in my analysis.
AMAZON FREE SIGNAL|SHORT|
✅AMZN Price rejects supply area with ICT displacement, showing bearish order flow. Liquidity below 217$ becomes the likely draw as inefficiency invites continuation.
—————————
Entry: 220.10$
Stop Loss: 222.00$
Take Profit: 217.00$
Time Frame: 2H
—————————
SHORT🔥
✅Like and subscribe to never miss a new idea!✅

BITCOIN LOCAL LONG|
✅BTCUSD Price reclaims neckline support, showing ICT displacement from the demand area. Smart Money aims for higher liquidity toward 111,000$ to rebalance inefficiency. Time Frame 1H.
LONG🚀
✅Like and subscribe to never miss a new idea!✅

AUD-USD Bullish Confirmation! Buy!
Hello,Traders!
AUDUSD confirms breakout above neckline, shifting order flow bullish. SMC structure suggests price will expand toward liquidity resting at 0.6555. Time Frame 1H.
Buy!
Comment and subscribe to help us grow!
Check out other forecasts below too!
Disclosure: I am part of Trade Nation's Influencer program and receive a monthly fee for using their TradingView charts in my analysis.

EURUSD WILL GO UP|LONG|
✅EURUSD Price rejects demand area with ICT displacement, suggesting bullish intent. Smart Money likely targets the overhead supply level near 1.1730 for liquidity draw. Time Frame 3H.
LONG🚀
✅Like and subscribe to never miss a new idea!✅

GOLD Free Signal! Sell!
Hello,Traders!
GOLD rejects a horizontal supply area with clear SMC reaction. Liquidity engineered above 3,790$ suggests downside continuation toward 3,770$ imbalance. Time Frame 30M.
-------------------
Stop Loss: 3,791$
Take Profit: 3,769$
Entry: 3,782$
Time Frame: 30M
-------------------
Sell!
Comment and subscribe to help us grow!
Check out other forecasts below too!
Disclosure: I am part of Trade Nation's Influencer program and receive a monthly fee for using their TradingView charts in my analysis.

EUR/USD - Multi time frame Analysis 🕰 Weekly View
Price recently tapped weekly demand around 1.1600 and reacted strong.
But that wick rejection above 1.1900 screams liquidity sweep 🧹—it failed to hold as a true breakout.
Until we see a clean weekly BOS (Break of Structure) above 1.1900, this is still looking like a range play between 1.16–1.19.
📉 Daily Structure
We’ve got a failed break at the highs, confirming liquidity grab.
Daily is chilling near the 71% fib retracement + demand zone. That’s the hot buy area 🏦.
If price bounces here → eyes on 1.1750–1.1800.
If it fails → expect a sweep into 1.1500 zone before any rocket 🚀.
⏱ 4H Breakdown
Two clear scenarios loading…
1️⃣ Idea 1 (deeper dip): Price breaks below current lows, sweeps liquidity into 1.1550–1.1600 (4H demand). Then we catch buys for a run back to 1.1700+.
2️⃣ Idea 2 (bullish push): Price flips short-term highs at 1.1750 → confirms momentum → next stop 1.1850–1.1900 retest.
Both ideas align with higher-timeframe liquidity games—just depends which way market makers want to hunt first 🎯.
🎯 Summary
Weekly = Range between 1.16–1.19 until proven otherwise.
Daily = Sitting on golden demand/discount.
4H = Watch for liquidity sweep down or break above 1.1750.
Big picture → Still bullish bias if demand holds, but don’t be surprised by one more dip before the climb.

EURUSD Daily Forecast -Fun Coupon Fri - Q3 | W39 | D26 | Y25|📅 Q3 | W39 | D26 | Y25|
📊 EURUSD Daily Forecast
Fun Coupon Fri
🔍 Analysis Approach:
I’m applying Smart Money Concepts, focusing on:
Identifying Points of Interest on the Higher Time Frames (HTFs) 🕰️
Using those POIs to define a clear trading range 📐
Refining those zones on Lower Time Frames (LTFs) 🔎
Waiting for a Break of Structure (BoS) for confirmation ✅
This method allows me to stay precise, disciplined, and aligned with the market narrative, rather than chasing price.
💡 My Motto:
"Capital management, discipline, and consistency in your trading edge."
A positive risk-to-reward ratio, paired with a high win rate, is the backbone of any solid trading plan 📈🔐
⚠️ Losses?
They’re part of the mathematical game of trading 🎲
They don’t define you — they’re necessary, they happen, and we move forward 📊➡️
🙏 I appreciate you taking the time to review my Daily Forecast.
Stay sharp, stay consistent, and protect your capital
— FRNGT 🚀
FX:EURUSD

Q3 | W39 | D26 | Y25| -Fun Coupon Fri -GBPUSD Daily Forecast📅 Q3 | W39 | D26 | Y25|
📊 GBPUSD Daily Forecast
Fun Coupon Fri
🔍 Analysis Approach:
I’m applying Smart Money Concepts, focusing on:
Identifying Points of Interest on the Higher Time Frames (HTFs) 🕰️
Using those POIs to define a clear trading range 📐
Refining those zones on Lower Time Frames (LTFs) 🔎
Waiting for a Break of Structure (BoS) for confirmation ✅
This method allows me to stay precise, disciplined, and aligned with the market narrative, rather than chasing price.
💡 My Motto:
"Capital management, discipline, and consistency in your trading edge."
A positive risk-to-reward ratio, paired with a high win rate, is the backbone of any solid trading plan 📈🔐
⚠️ Losses?
They’re part of the mathematical game of trading 🎲
They don’t define you — they’re necessary, they happen, and we move forward 📊➡️
🙏 I appreciate you taking the time to review my Daily Forecast.
Stay sharp, stay consistent, and protect your capital
— FRNGT 🚀
FX:GBPUSD

GOLD BULLISH BIAS|LONG|
✅XAUUSD Price forms a bullish flag above the wide demand area, showing ICT displacement. Smart Money likely drives momentum toward liquidity resting at 3,780$. Time Frame 3H.
LONG🚀
✅Like and subscribe to never miss a new idea!✅

CAD-JPY Free Signal! Sell!
Hello,Traders!
CADJPY rejects a horizontal supply area after a fakeout sweep, signaling SMC distribution. Bears aim to drive price lower into liquidity resting near 107.27. Time Frame 2H.
-------------------
Stop Loss: 107.616
Take Profit: 107.271
Entry: 107.435
Time Frame: 2H
-------------------
Sell!
Comment and subscribe to help us grow!
Check out other forecasts below too!
Disclosure: I am part of Trade Nation's Influencer program and receive a monthly fee for using their TradingView charts in my analysis.

CHF_JPY WILL KEEP GROWING|LONG|
✅CHFJPY Price reacts from demand area, confirming ICT displacement. Liquidity grab hints at bullish continuation, with Smart Money aiming for imbalance near 187.50. Time Frame 2H.
LONG🚀
✅Like and subscribe to never miss a new idea!✅

NZD-JPY Will Go Down! Sell!
Hello,Traders!
NZDJPY taps a supply zone and we see a bearish rejection, with Smart Money pushing price lower toward imbalance cleanup near 86.180. Time Frame 3H.
Sell!
Comment and subscribe to help us grow!
Check out other forecasts below too!
Disclosure: I am part of Trade Nation's Influencer program and receive a monthly fee for using their TradingView charts in my analysis.

GBP_CAD FREE SIGNAL|LONG|
✅GBPCAD sweeps liquidity into the support block, showing a bullish rejection. Smart Money likely shifts flow upward, aiming for inefficiency fill near 1.8611. Time Frame 2H.
—————————
Entry: 1.8575
Stop Loss: 1.8548
Take Profit: 1.8611
Time Frame: 2H
—————————
LONG🚀
✅Like and subscribe to never miss a new idea!✅

EUR-GBP Short From Supply Level! Sell!
Hello,Traders!
EURGBP taps into supply, rejecting premium levels as Smart Money shifts flow. The reaction signals distribution, with price likely targeting 0.8732 to rebalance inefficiency and clear buy-side stops.Time Frame 5H.
Sell!
Comment and subscribe to help us grow!
Check out other forecasts below too!
Disclosure: I am part of Trade Nation's Influencer program and receive a monthly fee for using their TradingView charts in my analysis.

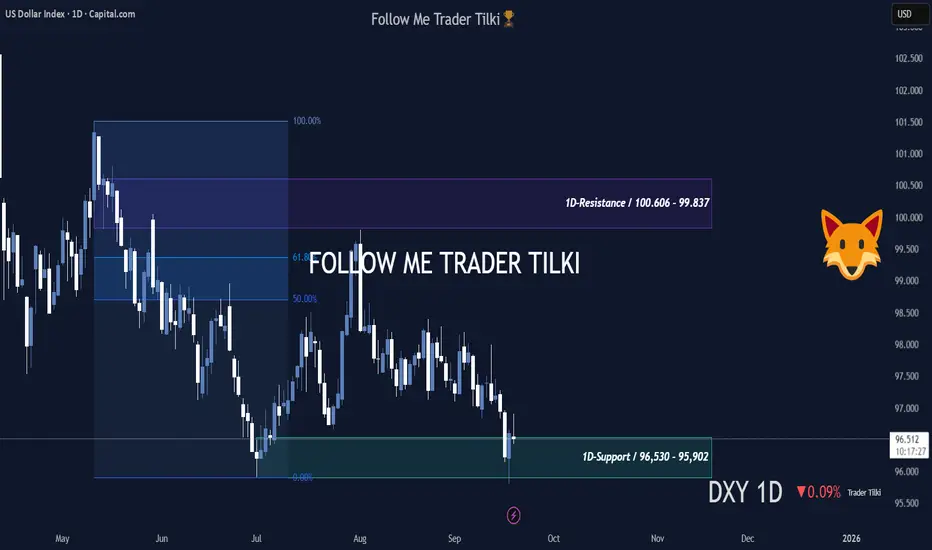
DXY at a Critical Juncture — What’s the Fed’s Next MoveHey Guys,
I’ve put together a swing-style analysis for the DXY.
This one’s been highly requested — my followers are valuable to me, and I never turn them down.
DXY Daily Levels:
- Resistance: 100.606 – 99.837
- Support: 96.530 – 95.902
From a fundamental perspective, the U.S. Dollar Index is currently dropping due to Fed policies.
No steps are being taken to push the dollar higher.
Because of this, investors are choosing gold as a safe haven instead of buying dollars.
Gold keeps hitting new ATHs, and naturally, the dollar index is sliding.
Unless the Fed takes action to support the dollar, this decline will continue.
In short, the drop in the dollar is entirely due to the policies implemented by the Fed Chair.
Remember — DXY isn’t heavily influenced by technical analysis; it’s driven by Fed policy.
That said, since the index has fallen so much, I believe we might see some steps taken in the coming months to lift the dollar.
I’ll be sharing updates right here.📢
Once support or resistance levels are broken, I’ll post new insights immediately.
Every like from you is my biggest motivation to keep sharing these analyses.
Thanks to all my friends who support me — you’re the best. ❤️
EURUSD Quick tradeThere is a good SMT signal on the EURUSD, which the price may react to in order to fill the Liquidity void that occurred yesterday and then continue the decline to target more liquidity areas.

TraderTilki Gold Play: Double Sell, One TargetGood morning, Traders
Back again with my gold analysis.
Right now, gold has a clear target at 3700. It’ll either reach it straight from the 3736 level, or after a move up to 3768.
I’m opening a sell from here, aiming for 3700. If price pushes up to 3768, I’ll open another sell there—same target, 3700.
Gold will absolutely hit 3700.
Once it does, I’ll update you again.
My friends, every single like from you is my biggest motivation to keep sharing these analyses.
Huge thanks to all of you who support me with your likes.

GBP/JPY - NO CONFIRMATION! (Possible failed resistance break)🔥 GBP/JPY – 4H Forecast 💷💴
This pair is dancing inside some serious supply, and sellers are warming up. Let’s break it down 👇
🕰 Market Context
Price tagged into a weekly supply zone and instantly reacted. Sellers defended heavy.
Liquidity sweep above the highs (BSL) → classic stop grab before turning south. ⚡
Daily zone + 8H imbalance already filled, giving sellers control.
📉 Bearish Flow
Market structure flipped bearish with a lower high (LPL) being printed.
1H zone is aligning with 4H supply = confluence for shorts.
Buyer attempts are fading; sell-side pressure is loading for a move into deeper demand.
⚡ Key Zones
Resistance / Supply:
200.40–200.80 (daily/4H supply pocket)
201.20 extreme high liquidity sweep
Support / Demand:
199.00 (short-term intraday demand)
197.80–198.20 = main target demand zone 🎯
🎯 Forecast Path
Expect a possible tiny push back into 200.0–200.4 zone for liquidity grab 📈.
From there → sellers should kick in → drive down toward 198.0 demand. 🕳
Break below 197.8 opens door to 195.5–196.0 macro support.
📝 Trade Idea
Bias: Bearish (supply reaction + liquidity grab confirmed).
Plan : Short from 200.0–200.4 retest.
Targets : 199.0 → 198.0 → extended 196.0.
Invalidation : Clean 4H close above 201.2 kills the short bias.
📌 Summary : GBP/JPY just faked out above highs into weekly supply and is now setting up for a deeper sell-off. Smart money is eyeing the 198.0 demand zone — shorts are the play until 201.2 breaks.

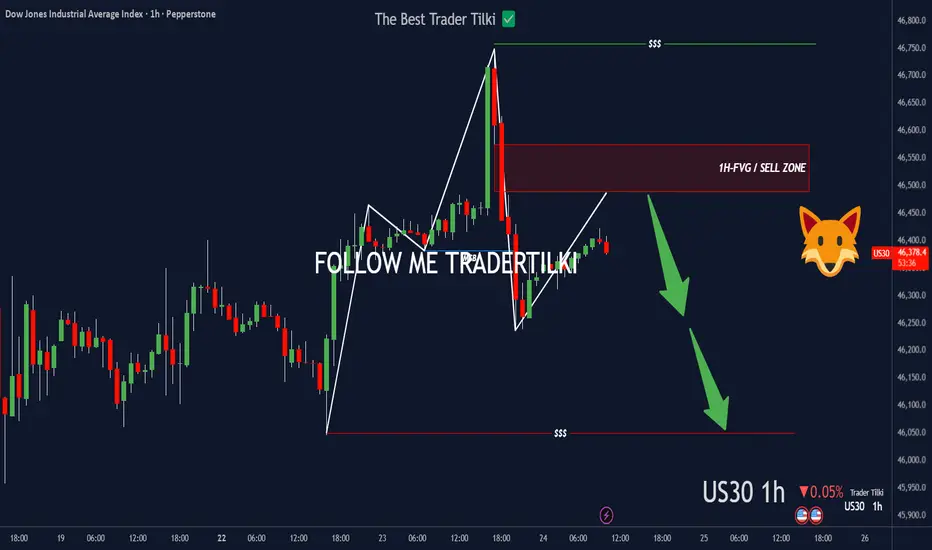
US30 left a footprint—FVG’s callin’.Hey Guys,
Once US30 hits my SELL zone, I’m pulling the trigger—targeting 46049.0
• Entry: 46574.5.0 or 46488.9
Set the stop point according to your own margin, my friends.
Every like you drop pushes me to share more setups like this. Big thanks to everyone showing support!
GBP/USD 15m Bias (SMC + LQC) | 25sept
Daily: Bearish 🟥
4H: Short-term bullish correction 📈
1H: Bullish countertrend but in premium pricing ⚖️
🔹 Price swept internal liquidity above the trendline and tapped into a supply zone.
🔹 Expecting a lower high to form within the shaded POI.
🔹 Plan: Look for a break of structure + LQC confirmation to target 1.3426 & lower daily lows.
