EUR_GBP BULLISH BREAKOUT|LONG|
✅EUR_GBP broke the key
Structure level around 0.8710
While trading in an local
Uptrend which makes me bullish
And as the retest of the level
Is complete bullish continuation
Will follow on Monday
LONG🚀
✅Like and subscribe to never miss a new idea!✅
SMC

AUD-USD Support Below! Buy!
Hello,Traders!
AUD-USD is falling down
In a local downtrend but
The pair will soon hit
A horizontal support level
Of 0.6558 from where
A local bullish rebound
Is to be expected
Buy!
Comment and subscribe to help us grow!
Check out other forecasts below too!
Disclosure: I am part of Trade Nation's Influencer program and receive a monthly fee for using their TradingView charts in my analysis.

NZD_USD SUPPORT AHEAD|LONG|
✅NZD_USD is set to retest
A strong support level
Below around 0.584 after
Trading in a local downtrend
For some time which makes
A bullish rebound a likely
Scenario with the target
Being a local resistance
Above at 0.5870
LONG🚀
✅Like and subscribe to never miss a new idea!✅

EUR-USD Long From Rising Support! Buy!
Hello,Traders!
EUR-USD is making a
Nice bearish correction
After the FED's decision
Crazy trading but now
The pair is close to the
Rising support line so
After the retest we will
Be expecting a local
Bullish rebound
Buy!
Comment and subscribe to help us grow!
Check out other forecasts below too!
Disclosure: I am part of Trade Nation's Influencer program and receive a monthly fee for using their TradingView charts in my analysis.

Gold (XAUUSD) – 19 Sep | Crucial Zone, Watching for Next Move🟡 Gold (XAUUSD) Analysis – 19 September
Market Context
• Gold is currently trading near the H4 Higher Low (HL) zone , suggesting the H4 pullback phase may be nearing completion.
• Yesterday, price action respected our key levels beautifully — both the M15 demand zone (3644–3637) and the M15 LH + Day High zone (3668–3672) offered excellent setups.
• Market has now printed a Break of Structure (BoS) below 3637, confirming M15 is currently in a downtrend.
Key Observations
• Price is in a pullback phase within the M15 downtrend.
• H4 Context: Price is near HL support, which is also the 78.6% Fibonacci retracement level — a critical area to watch for a potential uptrend resumption.
Execution Plan
• Short Setup Zones:
• 3654.8–3659.3 (fractal pullback zone).
• 3667–3673 (M15 LH + supply zone).
– A breakout and strong close above this zone would signal potential upside trend resumption → no more shorts.
• Long Setup Zone:
• 3621–3613 (H4 HL zone) — wait for price to reach and respect this level with M1/LTF confirmation before planning longs.
Trading Bias
• Neutral-to-Bearish for now — shorts are valid only if POI zones are respected.
• Longs will be considered only from deeper H4 HL zone with confirmation.
Today’s approach: Observe with stillness — let price reveal its direction before committing.
📘 Shared by @ChartIsMirror

NZD_CHF REBOUND AHEAD|LONG|
✅NZD_CHF is falling in a
Strong downtrend and the pair
Seems to be locally oversold
So as the pair is approaching
A strong horizontal support
Of 0.4640 price growth
Is to be expected
LONG🚀
✅Like and subscribe to never miss a new idea!✅

GBP-CAD Bearish Breakout! Sell!
Hello,Traders!
GBP-CAD made a bearish
Breakout of the key horizontal
Level of 1.8740 and the
Breakout is confirmed so
We are bearish biased and
We will be expecting a
Further bearish move down
Sell!
Comment and subscribe to help us grow!
Check out other forecasts below too!
Disclosure: I am part of Trade Nation's Influencer program and receive a monthly fee for using their TradingView charts in my analysis.

BITCOIN Bullish Bias! Buy!
Hello,Traders!
BITCOIN is trading in an
Uptrend and the coin broke
The key horizontal level
Of 117k$ so we are
Bullish biased and we
Will be expecting a
Further local move up
Buy!
Comment and subscribe to help us grow!
Check out other forecasts below too!
Disclosure: I am part of Trade Nation's Influencer program and receive a monthly fee for using their TradingView charts in my analysis.

GOLD RISKY LONG|
✅GOLD is trading in a
Strong uptrend and the
Price is now making a
Local correction but a
Horizontal support level
Is ahead at 3616$ so
After the retest we will
Be expecting a local
Bullish rebound
LONG🚀
✅Like and subscribe to never miss a new idea!✅

EUR_JPY BULLISH BREAKOUT|LONG|
✅EUR_JPY will keep growing
Because the pair is in the uptrend
And recently broke the key level
Around 174.000 area
So we will be expecting
Bullish continuation
LONG🚀
✅Like and subscribe to never miss a new idea!✅

EUR-AUD Will Go Down! Sell!
Hello,Traders!
EUR-AUD made a retest
Of the horizontal resistance
Level of 1.7827 from where
We are already seeing a
Bearish reaction so we are
Locally bearish biased and
We will be expecting a
Further local move down
Sell!
Comment and subscribe to help us grow!
Check out other forecasts below too!
Disclosure: I am part of Trade Nation's Influencer program and receive a monthly fee for using their TradingView charts in my analysis.

SILVER GROWTH AHEAD|LONG|
✅SILVER has retested a
Strong support level 41.50$
After a local correction move
And I think that we will see
A bullish move up as Silver
Is trading in a uptrend
LONG🚀
✅Like and subscribe to never miss a new idea!✅

GOLD Will Go UP! Buy!
Hello,Traders!
GOLD is trading in a
Strong uptrend and we are
Bullish biased so as the price
Is already making a rebound
From the horizontal support
Of 3680$ a further bullish
Move up is to be expected
Buy!
Comment and subscribe to help us grow!
Check out other forecasts below too!
Disclosure: I am part of Trade Nation's Influencer program and receive a monthly fee for using their TradingView charts in my analysis.

AUD_JPY SWING LONG|
✅AUD_JPY is trading in an
Uptrend and the pair was
Making a bearish correction
But is now about to retest
A horizontal support
Level of 97.400 from where
I am expecting the pair to go up
LONG🚀
✅Like and subscribe to never miss a new idea!✅

NZD-JPY Local Long! Buy!
Hello,Traders!
NZD-JPY is trading in a
Local uptrend and the pair
Will soon retest a horizontal
Support level around 87.200
From where we will be expecting
A local rebound and a move up
Buy!
Comment and subscribe to help us grow!
Check out other forecasts below too!
Disclosure: I am part of Trade Nation's Influencer program and receive a monthly fee for using their TradingView charts in my analysis.

GBP_JPY WILL GO UP|LONG|
✅GBP_JPY is trading along
The rising support line
And as the pair is going up now
After the retest of the line
I am expecting the price
To keep growing to retest
The supply levels
Above around 200.200
LONG🚀
✅Like and subscribe to never miss a new idea!✅

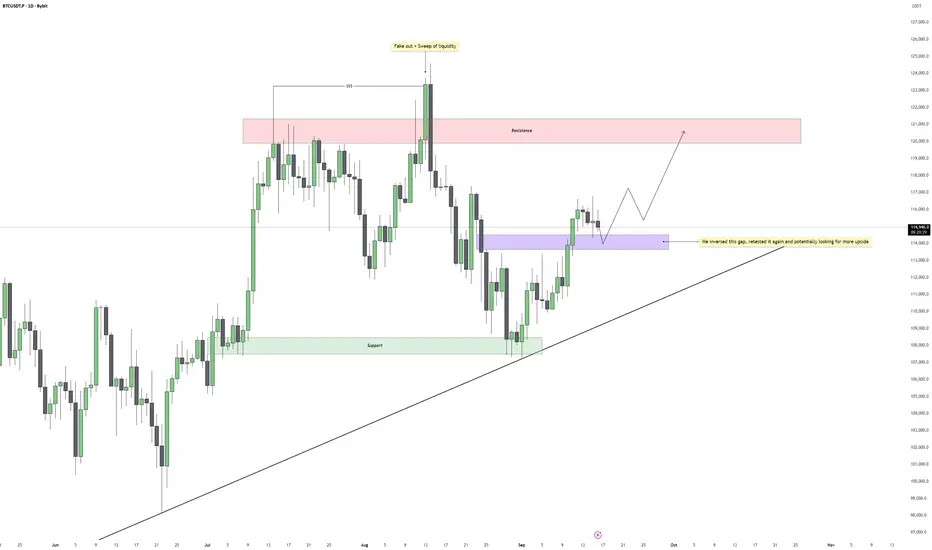
Bitcoin - Daily Gap Inversion Aligns with UptrendBitcoin recently made a push higher that cleared local highs and swept liquidity above the previous range. This move created a temporary fake out before price sharply retraced, filling inefficiencies left behind in the market. After completing this corrective move, price has begun reclaiming structure and is now respecting higher timeframe demand zones.
Daily Structure
The daily chart continues to show a clean uptrend, with higher lows forming along the rising trendline. After the liquidity sweep, price retraced to test key imbalances and has since confirmed a bullish shift by inverting a daily gap. This gap has been retested multiple times, suggesting it is holding firm as support and reinforcing the bullish continuation bias.
Liquidity Dynamics
The sweep of liquidity at the highs cleared buy-side pressure, resetting the market. This type of liquidity event often precedes sustained directional moves as the market seeks out new inefficiencies and liquidity pools. For now, downside liquidity has been satisfied and the path of least resistance appears to be higher.
Upside Scenarios
If the inverted daily gap continues to hold, price could target the major resistance block above 120,000 USDT. This zone aligns with the previous rejection area, where liquidity remains untested. Any approach into this resistance will be key to monitor for continuation or rejection.
Downside Risk
Should Bitcoin lose the daily inverted gap and trendline support, further retracement toward 111,000 to 112,000 USDT becomes possible, where a deeper liquidity pocket and structural support remain. Until then, the higher low structure remains intact.
Conclusion
Bitcoin has absorbed liquidity, filled inefficiencies, and inverted a daily gap that is now holding as support. Combined with the ongoing daily uptrend, this strengthens the bullish outlook with a clear target toward the 120,000 USDT resistance zone.
___________________________________
Thanks for your support!
If you found this idea helpful or learned something new, drop a like 👍 and leave a comment, I’d love to hear your thoughts! 🚀
EUR-USD Will Keep Growing! Buy!
Hello,Traders!
EUR-USD is trading in
An uptrend and the
Pair is now making a
Local bearish correction
But we are bullish biased
And we will be expecting
A further bullish move up
Buy!
Comment and subscribe to help us grow!
Check out other forecasts below too!
Disclosure: I am part of Trade Nation's Influencer program and receive a monthly fee for using their TradingView charts in my analysis.

Is NASDAQ going for a correction or Stop Hunt?Are we on the right track? If I missed anything please let me know in the comments 🙏🏾

USD-JPY Local Long! Buy!
Hello,Traders!
USD-JPY made a retest
Of the horizontal support
Level around 146.279
And we are already seeing
A local bullish reaction so
A further bullish correction
Is to be expected
Buy!
Comment and subscribe to help us grow!
Check out other forecasts below too!
Disclosure: I am part of Trade Nation's Influencer program and receive a monthly fee for using their TradingView charts in my analysis.

CHF_JPY BULLISH BREAKOUT|LONG|
✅CHF_JPY is going up
Now and the pair made a bullish
Breakout of the key horizontal
Level of 186.000 and the breakout
Is confirmed so we are bullish
Biased and we will be expecting
A further bullish move up
LONG🚀
✅Like and subscribe to never miss a new idea!✅

GBP_USD SHORT FROM RESISTANCE|
✅GBP_USD made a retest
Of the strong horizontal
Resistance level of 1.3684
And as you can see the pair is already
Making a local pullback from
The level which sends a clear
Bearish signal to us therefore
We will be expecting a
Further bearish correction
SHORT🔥
✅Like and subscribe to never miss a new idea!✅

President Trump Speaks, Israel Strikes—What’s Gold Gonna Do?Hey Guys,
It’s been a while since I dropped a gold chart. Got a ton of requests—so here’s a fresh swing setup for you.
Fundamentally, President Trump recently said “Trump says his patience with Putin is running out.” That kind of statement adds fuel to gold’s upside. Plus, Israel’s attacks in the Middle East are also pushing gold higher.
Right now, gold’s in a resting phase. But I’m expecting a move toward $3700 either this week or next.
Technically, I’m seeing a clean bull flag pattern.
I always work with both fundamentals and technicals. That’s why my swing target is $3700.
Every like you send is my biggest motivation to keep sharing these setups. Big thanks to everyone backing me.
