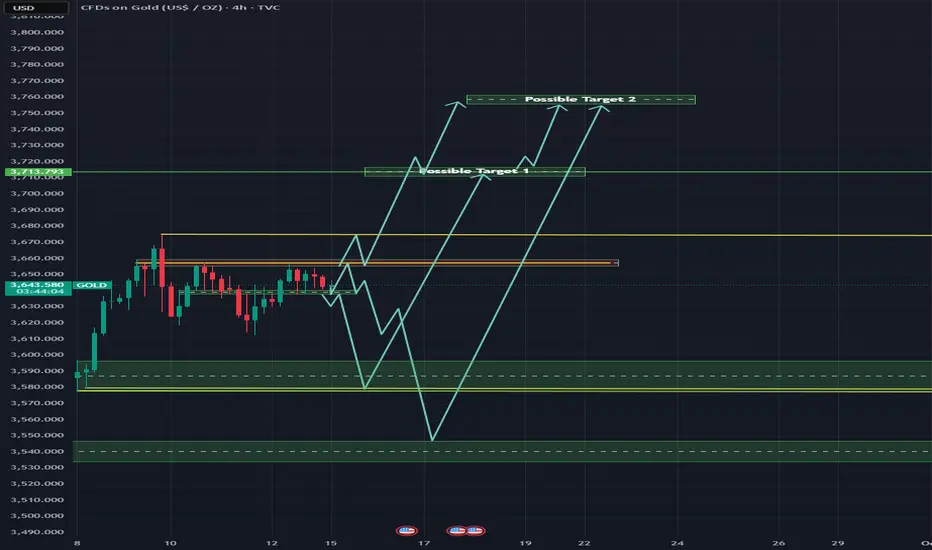
GOLD IS UNSTOPPABLE|LONG|
✅GOLD broke the key
Wide structure level around 3670$
While trading in a strong uptrend
Which reinforces our bullish bias
And I think that after the retest
Of the broken level is complete
A rebound and bullish
Continuation will follow
LONG🚀
✅Like and subscribe to never miss a new idea!✅
SMC

EUR_JPY RESISTANCE AHEAD|SHORT|
✅EUR_JPY is set to retest a
Strong resistance level above at 173.915
After trading in a local uptrend for some time
Which makes a bearish pullback a likely scenario
With the target being a local support below at 173.366
SHORT🔥
✅Like and subscribe to never miss a new idea!✅

EUR-NZD Local Short! Sell!
Hello,Traders!
EUR-NZD went up from
The support just as I
Predicted but the the
Pair will soon hit a
Horizontal resistance
Of 1.9800 from where
We will be expecting
A local bearish move down
Sell!
Comment and subscribe to help us grow!
Check out other forecasts below too!
Disclosure: I am part of Trade Nation's Influencer program and receive a monthly fee for using their TradingView charts in my analysis.

Possible retracement in EURUSDThere is a possibility of the EURUSD falling in the event of a break of the 1.17901 level, because the EURUSD has risen since the beginning of the week by more than 80 points, and it is likely to fall today or tomorrow.

USD-CAD Support Ahead! Buy!
Hello,Traders!
USD-CAD keeps falling
Down but a wide horizontal
Support area is ahead
Around 1.3728 so after
The retest a local bullish
Correction is to be
Expected
Buy!
Comment and subscribe to help us grow!
Check out other forecasts below too!
Disclosure: I am part of Trade Nation's Influencer program and receive a monthly fee for using their TradingView charts in my analysis.

NAS100 Buy Entry’s Clean, R:R 2.00 — Setup Locked & Loaded!Hey traders,
Here’s my NAS100 setup based on the 1-hour chart:
🟢 Buy Entry: 23998.77
🔴 Stop Loss: 23884.81
🎯 TP1: 24045.42
🎯 TP2: 24097.67
🎯 TP3: 24225.56
Risk/Reward Ratio: 2.00
Every like you drop is pure fuel for me to keep sharing these setups.
Big thanks to everyone standing by and showing support.

GBP/USD Short to Long Idea (1.36300 down to 1.35600 back up)This week, I’m focusing on the setups closest to price action while keeping the bigger trend in mind. GU has been bullish overall, but price is now approaching a strong supply zone that can’t be ignored.
I’ll be waiting to see how price reacts within this supply. If it distributes as expected, I’ll look for short-term sells targeting the nearby 2hr demand zone.
Confluences for Short-Term Sells:
- Strong bullish run could retrace back to demand
- Clean 5hr supply zone that previously caused a BOS to the downside
- 2hr demand zone below still unmitigated
- DXY is near a demand, aligning with this pullback idea
- Price slowing down, showing signs of reacting to supply
P.S. If supply doesn’t hold and price instead drops to mitigate the 2hr demand, I’ll then look for potential buys to rejoin the trend.

GBP-JPY Bullish Breakout! Buy!
Hello,Traders!
GBP-JPY made a strong
Bullish breakout of the
Key horizontal resistance
Level around 200.400
So we are bullish biased
And we will be expecting
A further bullish move up
Buy!
Comment and subscribe to help us grow!
Check out other forecasts below too!
Disclosure: I am part of Trade Nation's Influencer program and receive a monthly fee for using their TradingView charts in my analysis.

GBP_NZD WILL GROW|LONG|
✅GBP_NZD fell down sharply
But a strong support level was hit at 2.2700
Thus as a rebound is already happening
A move up towards the target of 2.2900 shall follow
LONG🚀
✅Like and subscribe to never miss a new idea!✅

EUR-NZD Will Go UP! Buy!
Hello,Traders!
EUR-NZD is making a rebound
From the wide horizontal
Support area around 1.9690
And as we are locally bullish
Biased we think that a further
Bullish move up is likely to happen
Buy!
Comment and subscribe to help us grow!
Check out other forecasts below too!
Disclosure: I am part of Trade Nation's Influencer program and receive a monthly fee for using their TradingView charts in my analysis.

GBP_USD BULLISH BREAKOUT|LONG|
✅GBP_USD is going up
Now and the pair made a bullish
Breakout of the key horizontal
Level of 1.3594 and the breakout
Is confirmed so we are bullish
Biased and we will be expecting
A further bullish move up
LONG🚀
✅Like and subscribe to never miss a new idea!✅

EUR-USD Resistance Ahead! Sell!
Hello,Traders!
EUR-USD went up from the
Rising support just as
I predicted in my previous
Analysis but now the pair
Is about to retest a
Horizontal resistance
Of 1.1788 and as it is a
Strong key level I will be
Expecting a local
Bearish correction
Sell!
Comment and subscribe to help us grow!
Check out other forecasts below too!
Disclosure: I am part of Trade Nation's Influencer program and receive a monthly fee for using their TradingView charts in my analysis.

Gold Weekly Outlook ( FOMC Week )Hello traders,
Another week and most importantly its FOMC week
🔸 Weekly Outlook (HTF Bias)
Trend: Bullish, but stretched into ATH zone.
Supply Zones:
3670–3720 (ATH pocket – decision zone)
3770–3800 (extension confluence)
3850–3920 (untouched liquidity cluster)
Demand Zones / Imbalance:
3590–3450 → main corrective magnet (contains EMA50)
3340–3290 → first strong HTF demand
3180–3120 & 3050–2980 → deeper extreme discount demand
Confluence:
EMA stack bullishly locked, but extended
RSI weekly overbought → exhaustion risk
Liquidity pools: above 3674 ATH and below imbalance 3450
Fibonacci: 1.272/1.618 extensions (3750/3880) align with supply above
Scenarios:
Bullish Expansion: Clean breakout above 3670–3720 → targets 3770 → 3850+
Bearish Correction: Rejection from ATH → pullback into 3590–3450 imbalance. A deeper rebalance could test 3340 or lower demand if macro turns hawkish.
🔸 H4 Structure & Trend
Trend: Still bullish (HH–HL), but slowing momentum inside supply.
Active Supply Zones:
3640–3666 → current battlefield (price inside)
3692–3720 → inducement + 1.272 Fib trap zone
3745–3785 → 1.618–2.0 Fib, expansion exhaustion supply
Demand Zones:
3600–3580 → first pullback demand
3544–3520 → EMA50 confluence, BOS origin
3500–3470 → last valid H4 demand before sentiment shift
Confluence:
EMAs locked bullish, but flattening
RSI cooling off → momentum compression
Equal highs below 3666 → inducement
Imbalances on both sides = liquidity-driven moves ahead
Scenarios:
Bullish: Hold above 3600–3580 → breakout above 3666 confirms push toward 3720/3785.
Bearish: Rejection at 3640–3666 or EQH sweep → pullback into 3580/3544, possibly 3500.
🔸 H1 Refined Levels
Premium Sell Zones:
3640–3654 → short-term liquidity wall (first seller defense)
3670–3678 → ATH trap zone (inducement risk)
3704–3720 → exhaustion zone (final upside trap)
Discount Buy Zones:
3595–3580 → first reaction base
3550–3535 → mid-range accumulation shelf
3505–3490 → deep liquidity reload zone (best RR swing entry)
Decision Zone: 3630–3608 → momentum pivot
Above 3630 → bulls in control
Below 3608 → opens reentry demand zones
🎯 Battle Plan
Bullish Play:
Look for rejections from 3595 / 3550 / 3505 with confirmation (M15 BOS or engulfing).
Above 3630 → push toward 3654 → 3674 → 3720.
Break and hold above 3674 → continuation toward 3770+.
Bearish Play:
Tactical shorts at 3654, 3678, 3720 with M15/M30 confirmation.
Targets: 3608 → 3580 → 3550.
Loss of 3490 = HTF correction mode unlocked.
✅ Overall Bias: Still bullish on HTF, but extended. Market is at a make-or-break zone (3640–3674).
⚠️ Risk: RSI overbought + inducement structure = high probability of a liquidity sweep before the real move.
📌 Key Catalyst: FOMC will likely decide whether ATH breaks cleanly or if a corrective flush into imbalance (3450–3590) happens first
EUR-JPY Move Down Ahead! Sell!
Hello,Traders!
EUR-JPY is approaching
A key horizontal
Resistance around 174.000
So after the retest a local
Pullback is to be expected
On Monday as it is a strong level
Sell!
Comment and subscribe to help us grow!
Check out other forecasts below too!
Disclosure: I am part of Trade Nation's Influencer program and receive a monthly fee for using their TradingView charts in my analysis.

USD_CAD POTENTIAL SHORT|
✅USD_CAD failed to break
The resistance of 1.3860
As it is a strong key level
So we are seeing a bearish reaction
And we will likely see a
Further bearish move down
On Monday
SHORT🔥
✅Like and subscribe to never miss a new idea!✅

NZD_JPY Will Grow! Buy!
Hello,Traders!
NZD-JPY is trading in a
Strong uptrend and the
Pair made a confirmed
Bullish breakout of the
Key horizontal level
Of 87.700 so we are
Bullish biased and a
Further bullish continuation
Is to be expected on Monday
Buy!
Comment and subscribe to help us grow!
Check out other forecasts below too!
Disclosure: I am part of Trade Nation's Influencer program and receive a monthly fee for using their TradingView charts in my analysis.

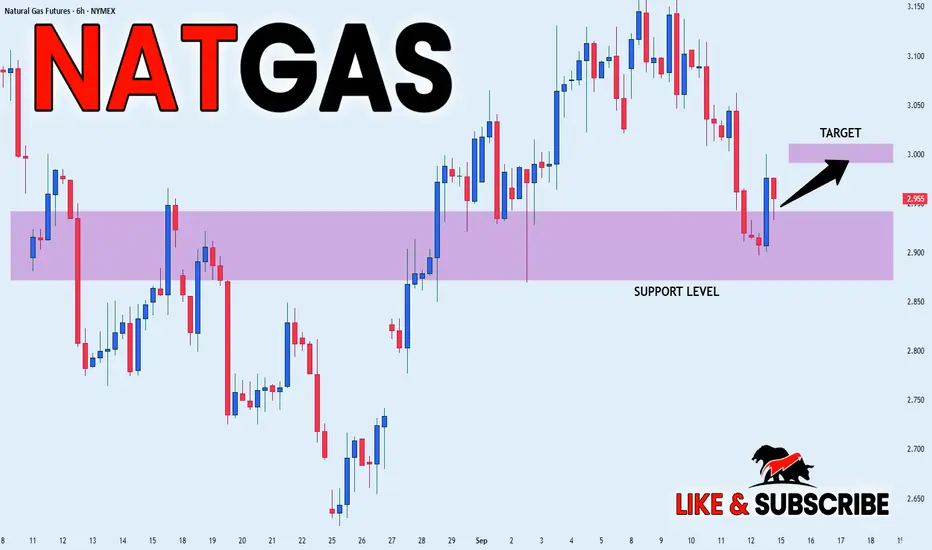
NATGAS LOCAL LONG|
✅NATGAS went down to retest
A horizontal support of 2.90$
Which makes me locally bullish biased
And I think that we will see a rebound
And a move up from the level
Towards the target above at 3.00$
LONG🚀
✅Like and subscribe to never miss a new idea!✅
SILVER Will Keep Growing! Buy!
Hello,Traders!
SILVER is trading in an
Uptrend and the price
Has crossed yet another
Strong barrier of 41.60$
So we are bullish biased
And we will be expecting
A further bullish move up
On Monday!
Buy!
Comment and subscribe to help us grow!
Check out other forecasts below too!
Disclosure: I am part of Trade Nation's Influencer program and receive a monthly fee for using their TradingView charts in my analysis.

GBP_CAD WILL GO UP|LONG|
✅GBP_CAD is trading in an
Uptrend and the pair made
A bullish rebound from the
Horizontal support of 1.8740
So we are bullish biased and
We will be expecting a
Further bullish move up
On Monday
LONG🚀
✅Like and subscribe to never miss a new idea!✅

EURUSD overview 14-09-2025I am a bit confused as to whether the price will go up after breaking the 1.17008 level or will it reach 1.16520 and then it will be a good area to go up with the orderflow and this is more likely to happen and in case the price reaches this level with the Fed news it will be a very good rise

GBP-USD Resistance Above! Sell!
Hello,Traders!
GBP-USD is hovering below
The strong horizontal resistance
Level of 1.3595 so after the
Pair makes a retest of the
Resistance on Monday
We will be expecting a
Local bearish pullback
Sell!
Comment and subscribe to help us grow!
Check out other forecasts below too!
Disclosure: I am part of Trade Nation's Influencer program and receive a monthly fee for using their TradingView charts in my analysis.

Bitcoin - Heading lower after hitting resistance?Introduction
Looking at the current 4-hour Bitcoin chart, we can see that price action is moving into a crucial zone. After a strong upward move, Bitcoin has reached an area of resistance where multiple factors align, making it an important level to watch. The chart highlights fair value gaps (FVGs) both above and below, which are key points that could influence the next move. By analyzing these areas, we can form a clearer idea of the potential short-term trend and what traders might expect in the coming days.
Bearish 4h FVG resistance and liquidity grab
At the moment, price is testing a strong resistance level, which coincides with a 4-hour fair value gap. This area has already absorbed much of the short-side liquidity, meaning that stop losses from traders positioned against the uptrend have been triggered. This liquidity grab often signals exhaustion in the upward move and can serve as the starting point for a retracement. The resistance zone is proving to be difficult to break, and if the market fails to hold above it, we could see a shift in momentum toward the downside.
4h bullish FVG to hold
Just below the current price, there is a 4-hour bullish fair value gap that could act as support in the short term. If buyers step in and defend this area, it may temporarily stabilize the market and create a bounce. However, if this support fails to hold, it would open the path for further downside movement. The chart suggests that a break below this level would likely drive Bitcoin toward the next major target around the $112,000 region. This makes the bullish FVG a key decision point for the market.
Target for the short
If Bitcoin cannot sustain its position above the highlighted resistance zone, the downside target becomes more clear. The lower 4-hour fair value gap, sitting closer to $112,000, is marked as the target for the short. This is where price is likely to be drawn in order to rebalance inefficiencies left behind in the chart. Traders looking for bearish opportunities would see this as the logical area to aim for, as the market often gravitates toward unfilled gaps after liquidity grabs at the top.
Final thoughts
In conclusion, Bitcoin is currently at a critical point. The resistance area combined with the 4-hour FVG has absorbed liquidity, creating the possibility for a downward move. The short-term bullish FVG below is the level to watch, as a break here could confirm bearish continuation toward $112,000. On the other hand, if buyers manage to hold the current support, the structure may remain intact and prevent deeper downside. Overall, the chart suggests that the path of least resistance may now be lower, unless the market proves otherwise by breaking convincingly above resistance.
-------------------------
Thanks for your support. If you enjoyed this analysis, make sure to follow me so you don't miss the next one. And if you found it helpful, feel free to drop a like 👍 and leave a comment 💬, I’d love to hear your thoughts!

BITCOIN SHORT FROM RESISTANCE|
✅BITCOIN has retested a key
Resistance level of 117k$
And as the coin is already
Making a bearish pullback
A move down to retest the
Demand level below
At 115k$ is likely
SHORT🔥
✅Like and subscribe to never miss a new idea!✅
