GOLD Will Keep Growing! Buy!
Hello,Traders!
GOLD is trading in an
Uptrend and the price
Made a retest and rebound
So we are bullish biased
And we will be expecting
A further bullish move up
Buy!
Comment and subscribe to help us grow!
Check out other forecasts below too!
Disclosure: I am part of Trade Nation's Influencer program and receive a monthly fee for using their TradingView charts in my analysis.
SMC

NZD-CHF Short From Resistance! Sell!
Hello,Traders!
NZD-CHF is trading in a
Strong uptrend and the pair
Made a retest of the horizontal
Resistance level of 0.4820
From where we are already
Seeing a pullback so a further
Correction is to be expected
Sell!
Comment and subscribe to help us grow!
Check out other forecasts below too!
Disclosure: I am part of Trade Nation's Influencer program and receive a monthly fee for using their TradingView charts in my analysis.

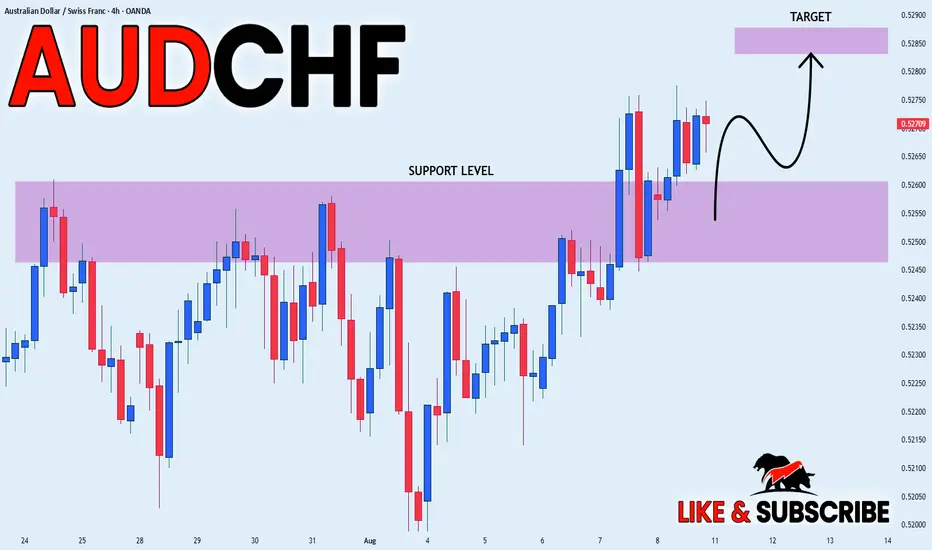
AUD_CHF WILL KEEP GROWING|LONG|
✅AUD_CHF is trading in an uptrend
And the pair was making a bearish correction
But has now retested the support of 0.5255
And we are already seeing a rebound
So we will be expecting a further move up
LONG🚀
✅Like and subscribe to never miss a new idea!✅
GBP-CAD Bearish Bias! Sell!
Hello,Traders!
GBP-CAD keeps growing
And the pair is locally overbought
So after the pair hits the
Horizontal resistance
Of 1.8530 we will be expecting
A local bearish correction
Sell!
Comment and subscribe to help us grow!
Check out other forecasts below too!
Disclosure: I am part of Trade Nation's Influencer program and receive a monthly fee for using their TradingView charts in my analysis.

EUR_JPY PULLBACK AHEAD|SHORT|
✅EUR_JPY price went up sharply
But a strong resistance level was hit at 172.400
Thus, as a pullback is already happening
And a move down towards the target of 171.853 shall follow
SHORT🔥
✅Like and subscribe to never miss a new idea!✅

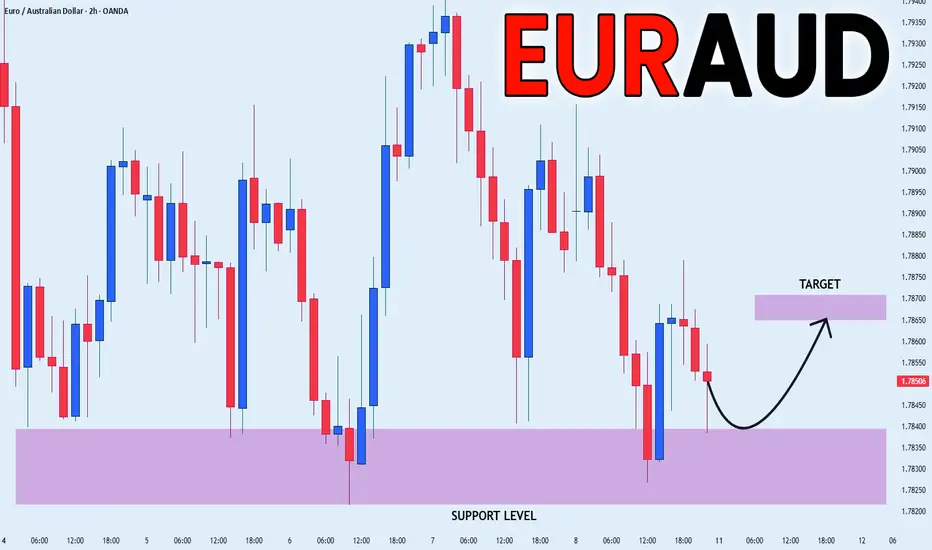
EUR-AUD Rebound Ahead! Buy!
Hello,Traders!
EUR-AUD is already making
A rebound from the horizontal
Support level of 1.7822
So we are locally bullish
Biased and we will be
Expecting a further
Local move up
Buy!
Comment and subscribe to help us grow!
Check out other forecasts below too!
Disclosure: I am part of Trade Nation's Influencer program and receive a monthly fee for using their TradingView charts in my analysis.

Market Manipulations. Bullish Trap (Smart Money Concepts SMC)
In the today's article, we will discuss how smart money manipulate the market with a bullish trap .
In simple words, a bullish trap is a FALSE bullish signal created by big players.
With a bullish trap, the smart money aims to:
1️⃣ Increase demand for an asset, encouraging the market participant to buy it.
2️⃣ Make sellers close their positions in a loss .
When a short position is closed, it is automatically BOUGHT by the market.
Take a look at a key horizontal resistance on AUDCHF.
Many times in the past, the market dropped from that.
For sellers, it is a perfect area to short from.
Bullish violation of the underlined zone make sellers close their position in a loss and attracts buyers.
Then the market suddenly starts falling heavily, revealing the presence of smart money.
Both the sellers and the buyers lose their money because of the manipulation.
There are 2 main reasons why the smart money manipulates the markets in a such a way:
1️⃣ - A big player is seeking to close a huge long position
When a long position is closed, it is automatically SOLD to the market.
In order to sell a huge position, smart money needs a counterpart who will buy their position.
Triggering stop losses of sellers and creating a false demand, smart money sell their position partially to the crowd.
2️⃣ - A big player wants to open a huge short position
But why the smart money can't just close their long position or open short without a manipulation?
A big sell order placed by the institutional trader, closing their long position, can have an impact on the price of the asset. If the sell order is large enough, it can push the price downward as sellers outnumber buyers. Smart money are trying to balance the supply and demand on the market, hiding their presence.
It is quite complicated for the newbies and even for experienced traders to recognize a bullish trap.
One of the efficient ways is to apply multiple time frame analysis and price action.
Remember, that most of the time bullish traps occur on key horizontal or vertical resistances.
After you see a breakout, analyze lower time frames.
Quite often, after a breakout, the market starts ranging .
After a breakout of a key daily resistance, gold started to consolidate within a narrow range on an hourly time frame.
Bearish breakout of the support of the range will indicate a strength of the sellers and a highly probable bullish trap.
Remember, that you can not spot all the traps, and occasionally you will be fooled by smart money. However, with experience, you will learn to recognize common bullish traps.
❤️Please, support my work with like, thank you!❤️
I am part of Trade Nation's Influencer program and receive a monthly fee for using their TradingView charts in my analysis.

EUR_AUD LOCAL LONG|
✅EUR_AUD is going down now
But a strong support level is ahead at 1.7820
Thus I am expecting a rebound
And a move up towards the target of 1.7865
LONG🚀
✅Like and subscribe to never miss a new idea!✅
EUR-GBP Potential Long! Buy!
Hello,Traders!
EUR-GBP keeps falling down
Towards the horizontal support
Level of 0.8650 and after the
Retest we will be expecting
A local bullish rebound
Buy!
Comment and subscribe to help us grow!
Check out other forecasts below too!
Disclosure: I am part of Trade Nation's Influencer program and receive a monthly fee for using their TradingView charts in my analysis.

USD-CHF GROWTH AHEAD|LONG|
✅USD_CHF has retested a key support level of 0.8060
And as the pair is already making a bullish rebound
A move up to retest the supply level above at 0.8100 is likely
LONG🚀
✅Like and subscribe to never miss a new idea!✅

USD-CAD Resistance Ahead! Sell!
Hello,Traders!
USD-CAD went up and will
Soon hit a horizontal resistance
Of 1.3774 from where
We will be expecting a
Local bearish pullback
Sell!
Comment and subscribe to help us grow!
Check out other forecasts below too!
Disclosure: I am part of Trade Nation's Influencer program and receive a monthly fee for using their TradingView charts in my analysis.

DAX WILL GO UP|LONG|
✅DAX is going up now
And the index made a
Breakout of the key horizontal
Level of 24,100 which is
Now a support then
Made a retest and a is now
Making a rebound already so
We are bullish biased and we
Will be expecting a further
Bullish move up
LONG🚀
✅Like and subscribe to never miss a new idea!✅

USD-JPY Local Short! Sell!
Hello,Traders!
USD-JPY made a retest
Of the horizontal resistance
Of 148.101 from where we
Are already seeing a bearish
Reaction so we will be
Expecting a further
Bearish move down
Sell!
Comment and subscribe to help us grow!
Check out other forecasts below too!
Disclosure: I am part of Trade Nation's Influencer program and receive a monthly fee for using their TradingView charts in my analysis.

EURUSD SELL SETUP SHOOOOOOOOORTWHAT'S YOUR OPINION ?
EURUSD formed ascending pattern on time frame Daily
and it break uptrend line and do retest on it
so we should research selling opportunities

GBP_CAD SHORT FROM RESISTANCE|
✅GBP_CAD is set to retest a
Strong resistance level above at 1.8511
After trading in a local uptrend for some time
Which makes a bearish pullback a likely scenario
With the target being a local support below at 1.8430
SHORT🔥
✅Like and subscribe to never miss a new idea!✅

EUR-USD Support Ahead! Buy!
Hello,Traders!
EUR-USD is making a local
Bearish correction but
We are bullish biased mid-term
So after the pair hits the horizontal
Support of 1.1577 we will be
Expecting a local bullish rebound
Buy!
Comment and subscribe to help us grow!
Check out other forecasts below too!
Disclosure: I am part of Trade Nation's Influencer program and receive a monthly fee for using their TradingView charts in my analysis.

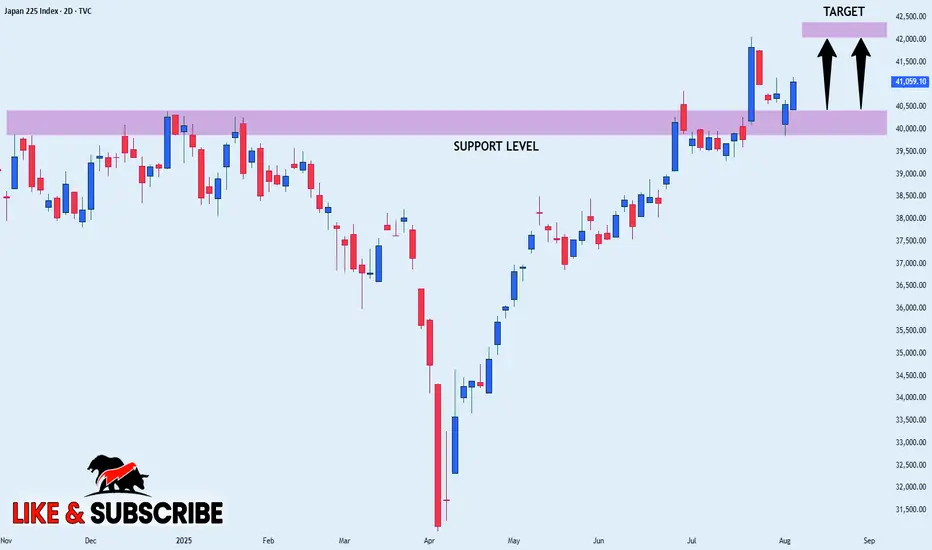
NIKKEI WILL KEEP GROWING|LONG|
✅NIKKEI is trading in an uptrend
And the index was making a bearish correction
But it has now retested a horizontal support level of 40,500
From where we are already seeing a bullish
Reaction and I am expecting the index to go further up
LONG🚀
✅Like and subscribe to never miss a new idea!✅
BITCOIN Bullish Breakout! Buy!
Hello,Traders!
BITCOIN made a bullish
Breakout of the key horizontal
Level of 115,5k$ and the
Breakout is confirmed so
We are bullish biased and
We will be expecting a
Further bullish move up
Buy!
Comment and subscribe to help us grow!
Check out other forecasts below too!
Disclosure: I am part of Trade Nation's Influencer program and receive a monthly fee for using their TradingView charts in my analysis.

NATGAS WILL FALL|SHORT|
✅NATGAS made a retest of the
Strong horizontal resistance level of 3.150$
And as you can see the price is already
Making a local pullback from
The level which sends a clear
Bearish signal to us therefore
We will be expecting a
Further bearish correction
SHORT🔥
✅Like and subscribe to never miss a new idea!✅

EUR-NZD Local Long! Buy!
Hello,Traders!
EUR-NZD made a retest
Of the horizontal support
Level of 1.9540 from where
We are already seeing a
Local bullish rebound so
We will be expecting a
Further bullish move up
Buy!
Comment and subscribe to help us grow!
Check out other forecasts below too!
Disclosure: I am part of Trade Nation's Influencer program and receive a monthly fee for using their TradingView charts in my analysis.

XAUUSD Chart Analysis – Smart Money Concepts (SMC) Based🔍 XAUUSD Chart Analysis – Smart Money Concepts (SMC) Based
1. Market Structure Overview:
The chart clearly shows a bullish market structure forming after a sequence of Breaks of Structure (BOS) and Change of Character (CHoCH) events.
The market has consistently made Higher Lows, indicating strength from the bulls and institutional order flow to the upside.
2. Key Zones Identified:
✅ Strong Support Zone (Demand Area):
Around $3,260–$3,280, this level has been respected multiple times.
It is marked with BOS, CHoCH, and a Bullish Fair Value Gap (FVG) indicating institutional accumulation and unfilled orders.
The area also contains a Weak Low, which gives price a reason to stay above if bullish sentiment continues.
❌ Strong Resistance Zone (Supply Area):
Around $3,420–$3,460, this area shows signs of Level Rejection and is labeled with Buy-Side Liquidity.
This is where price previously reversed after grabbing liquidity—indicating distribution and possible shorting interest from smart money.
3. Liquidity Zones:
Buy-Side Liquidity: Above recent swing highs near $3,420–$3,440. Price tapped this level and sharply rejected.
Sell-Side Liquidity (Target Area): Currently aiming for the zone around $3,350, which aligns with a recent imbalance (FVG) and a clean liquidity pool below short-term higher lows.
4. Fair Value Gaps (FVGs):
A Bullish FVG is seen mid-chart, where price was rapidly driven up, leaving a gap—price later returned to this zone, respected it, and pushed higher again.
This is a strong sign of institutional entry and provides excellent long entries.
5. Trend Confirmation:
BOS + CHoCH + Higher Lows = Bullish Bias.
Each low is forming higher than the previous, with strong rejections from demand zones.
6. Entry & Target Insight:
Entry Point: After price reacted from support and printed another Higher Low.
Target: Currently price is targeting $3,350 (short-term retracement or pullback target).
This target is likely an internal liquidity sweep before potential continuation to retest the resistance zone again.
7. Educational Takeaways:
Market Structure is King: Observe BOS/CHoCH for directional bias.
Liquidity Matters: Understand where liquidity is resting—price seeks it.
FVG as Entry Tool: Fair Value Gaps provide high-probability trade setups when aligned with structure.
Patience at Key Zones: Wait for confirmations at resistance/support rather than impulsive trades.
✅ Summary:
Bias: Bullish, until structure breaks.
Short-Term Target: $3,350 (as per the chart).
Long-Term View: If price maintains higher lows, potential revisit to the resistance zone ($3,420–$3,460) is likely.
Invalidation Level: Break and close below strong support ($3,260) would shift bias.

NZDUSD BUY SETUP LOOOONGLook in this photo
The price
The price on the four-hour frame has a strong upward momentum and is in a cheap area relative to the consolidation area it is in, but it should have broken the downtrend on the quarter-hour frame.

SILVER WILL GO UP|LONG|
✅SILVER is going up
Now and the pair made a bullish
Breakout of the key horizontal
Level of 37.73$ and the breakout
Is confirmed so we are bullish
Biased and we will be expecting
A further bullish move up
LONG🚀
✅Like and subscribe to never miss a new idea!✅
