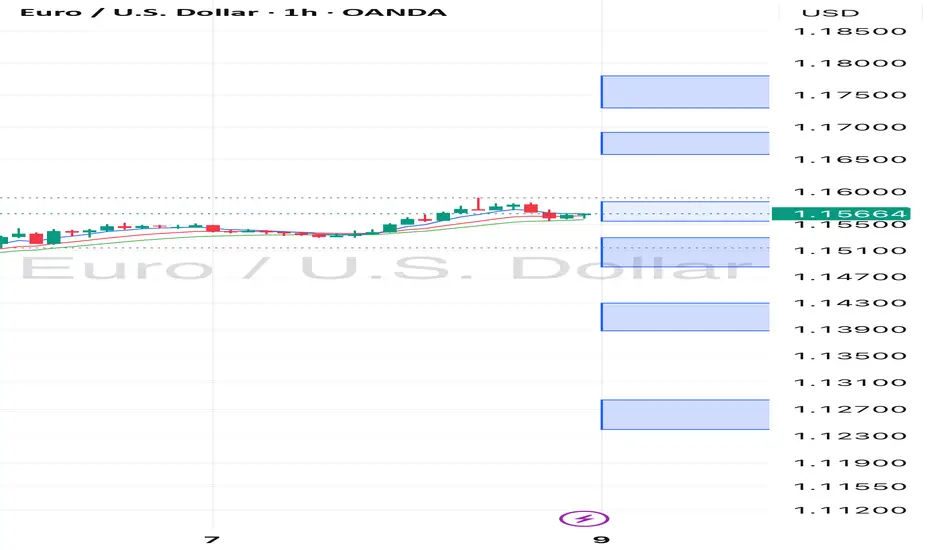
Week of 1/4/26: EURUSDEURUSD has been correcting after breaking daily structure. Price at the moment is at the extreme of the 4h and 1h swing. We will be patient and wait for internal 1h structure to either break the swing bearish to follow the bearish trend or for internal structure to turn bullish again in order to have a bullish bias.
Major News:
Mon - PMI
Wed - ADP NFP, PMI, JOLTS
Thu - Unemployment
Fri - Hourly Earnings, NFP, Unemployment Rate, UoM
Smcanalysis

Minor plus major IDMIn this diagram I have briefly explained the difference between minor inducement and major inducement how to use them with proper structure mapping and alignment of all other necessary elements which comes into ICT that how we gonna use the inducement model on the basis of minor swing hunt and major swing hunt

Gold Analysisafter bullish choch . market is bullish so buying looks more valid setup, we can trade from recent ob or liquidity sweep.
in December end we usually have low volume , so i am aware this may be the buyers trap. in that case we will sell after bearish scoob conformation to target trendline liquidity. for now everything is bullish , so we will go buy side.

#NZDUSD: Three Targets, Swing Buy, Ready For Next Big MoveDear Traders
NZDUSD Chart Analysis SMC+ICT💭📊
🔺The price was rejected at 0.5580, a ‘discounted zone’ price, which was reversed without consolidation or accumulation. The price then moved in an impulse pattern and encountered strong resistance at 0.58320.
🔺A rejection at 0.58320 presents a favourable opportunity for traders to optimise the next significant price impulse. This analysis suggests a potential reversal from 0.5710.
Entry, Take Profit And Stop Loss👨💻📈
🔺 The entry between the blue and red horizontal lines indicates a significant volume zone and can be considered a discounted buying opportunity.
🔺A stop loss can be placed at the red horizontal line or increased based on your own analysis.
🔺We recommend targeting take profit first at the outset. As the price crosses our take profit level, you can consider adjusting the take profit area.
Like And Comment❤️
Team Setupsfx_🏆

LONG ON UJ PART 2Possible push to the upside on UJ
Sell Side Liquidity taken and the high broken right after giving me the impression that big institutions may have forced the SSL in order to enter the market
1;55 rr, may seem far fetched but looks like a good trade to me
Second part of UJ trade i posted with a lightly different point of entry

LONG ON UJPossible push to the upside on UJ
Sell Side Liquidity taken and the high broken right after giving me the impression that big institutions may have forced the SSL in order to enter the market
1;50 rr, may seem far fetched but looks like a good trade to me
possibility to get stopped out because of the tight SL
safer sl would be 153.550

LONG ON NZDCADBOS followed by a grab on SSL(Sell Side Liquidity)
Indicates neeed to go to the upside so liquidity was taken below in the form of SL's from Buy orders and Sell limits/ orders places

SHORT ON GAChanged opinion on GA, upon further analysis the trend shows bearish motion
stop hunts taken after the X symbol heading to break the lows created, possible buys to the area of interest then we sell
Placed a very tight sl of about 10 pips to give me a trade with an over 1;20 rr

LONG ON GAsimilar to the schematic i always use, always looking for a valid Stop hunt this side being on the SSL side which fueled the initial move to break the last high.
This left us with a high probability blueprint of where exactly higher or bigger institutions entered the market.
decent 1;12 rr trade, black line below liquidity was a regular entry but i prefer a more defined OB thus i am entering much lower
Lets wait and see how the trade runs out

Possible long on GUSell side liquidity taken in order to force a break of structure.
this Stop Hunt gives a blueprint of where instituitions entered the market after collecting sell order and stop losses on buys(sell side liquidity).
Using this knowledge i have set pedning buy orders targeting the last major high, analysis done using H4 and H2 timeframes

Gold AnalysisWe have BSL in recent swing high & 4hr internal is bullish + market is respecting bullish poi.
So most probably we have expect next bullish move after trendline or ssl sweep. We can trade with scoob or ichoch confirmation.

LONG ON USDJPYSimilar to my last Cadjpy setup
clear motion to go top side
liquidty below to be grabbed first before push to the upside
1;15 rr trade

EURUSD SMC ICT ANALYSISMarket mostly move from external range liquidity to internal range liquidity.
now in eurusd , market has already taken buy side trendline liquidity & form strong bearish reaction which mean we can expect selling move.
4hr bullish ob is unmitigate , which increase the chance of selling.
Currently smc market structure is bearish , which signal selling looks valid.

LiamTrading – XAUUSD H1 | Two scenarios for the new weekLiamTrading – XAUUSD H1 | Two scenarios for the new week: waiting for reactions at 4100 & Fibonacci zone – prioritizing bullish trades when the market recovers
Gold is completing a technical rebound after a sharp drop, and H1 is showing two clear scenarios for the new week. The medium-term trend remains a downward correction, but on H1, the price is in a recovery phase, so bullish trades will be prioritized – as long as the lower liquidity zones are maintained.
The key this week lies at 4100, the confluence of FVG, Fibonacci, and liquidity – this is the decisive point to see if gold will bounce up or continue to fall deeply.
🔍 Technical Analysis (Fibonacci • Trendline • Liquidity • Volume Zone)
Fibonacci H1: The price may recover to Fib 0.5 (~4140–4150) – a zone with high liquidity & likely to trigger a bearish reaction.
Fib 0.382 (~4120–4130) is currently the first short-term resistance.
Price Structure: The medium-term downtrend still exists, but H1 is creating a recovery wave → prioritize buying when the price pulls back at the support zone.
The descending trendline is still controlling the market. If it breaks the trendline + holds above 4130–4150 → the uptrend is more strongly confirmed.
Important liquidity zones:
4100: liquidity confluence + previous bullish resistance → strong reaction zone.
4085 and 4060: liquidity bottoms – if breached, will trigger a deep decline scenario.
4032: FVG + Fibonacci bottom – the "break or hold" zone for buyers.
Key resistance this week: 4161 – 4187 – 4138 – 4111
📈 TRADING SCENARIOS FOR THE NEW WEEK
Scenario 1 – Bullish trade (priority)
Logic: Gold is recovering; if it holds 4100 and pulls back strongly → target is the upper Fibonacci zone.
Entry: 4100–4111
SL: 4090
TP: 4138 → 4161 → 4187
Suggestion: Wait for strong signals like a pin bar or H1 engulfing to confirm the recovery bottom.
Scenario 2 – Bearish trade (when the market fails to hold the bottom)
Logic: If gold breaks the H1 bottom and retests 4100 without holding → the medium-term downtrend continues to activate.
Entry: 4100–4108 (retest after break)
SL: 4120
TP: 4085 → 4060 → 4032
Suggestion: Only enter when H1 closes below 4100.
🌍 Macro Analysis – Fed disrupts the market
According to the latest data from CME Watch:
54.1% chance Fed holds rates steady at 375–400 bps
45.9% chance Fed cuts rates
The ratio is almost balanced → the market is very uncertain, creating unpredictable volatility ahead of the 10/12 meeting.
In this environment, gold often reacts strongly to unexpected news, so prioritize trading at liquidity zones – wait for clear confirmations.
⚠️ Invalidation Conditions
Price closes below 4060 → fully prioritize bearish trades.
Price closes above 4161 → strong bullish trade activated, discard all sell setups.
What scenario are you preparing for the new week?
Comment & hit Follow on the LiamTrading channel to receive the earliest analysis every day!

XAUUSD – H4 SCENARIO FOR THE WEEK 17–21/11💛 XAUUSD – H4 SCENARIO FOR THE WEEK 17–21/11 🎯
🌤 1. Overview
Hello everyone, it's Lana here again 💬
The new week begins with a narrowing trading range on the H4 chart, signaling that gold is gearing up for a stronger move. The current medium-term trend needs to break the descending trendline above to confirm the buyers' return.
💹 Technical Analysis
📉 The end-of-week downtrend is entering a technical rebound phase, and there's a high possibility it still has room to continue declining around the 4000 trendline – where it converges with a strong liquidity zone.
🟣 Key price levels to watch include: 4138 – 4200 – 4212 – 4037. These are liquidity concentration points, expected to have clear reactions based on market sentiment.
🔹 Traders can use Fibonacci retracement to time their sell entries, combined with confirmation signals on smaller time frames (M15–M30).
🌐 Macro Context
The financial market is facing difficulties as U.S. tax policies change continuously, putting pressure on both Gold and Bitcoin.
The end of the year is also a characteristic phase of the economic slowdown cycle, where the market tends to adjust more strongly.
🎯 Reference Trading Scenario (Reference Trading View)
Prioritize selling according to the technical rebound, especially when the price enters confluence zones of Fibo + liquidity.
Consider buying only when the price reacts strongly at the 4000 trendline or the 4037 area.
🌷 6. Conclusion with LanaM2
Gold is in a zone preparing for a big move 💛
Be patient and wait for reactions at key liquidity zones to have a better and safer entry point.
If you find this useful, please 💛 Like – 💬 Comment – 🔔 Follow LanaM2 to receive daily gold analysis! ✨

XAU/USD 11 November 2025 Intraday AnalysisH4 Analysis:
-> Swing: Bullish.
-> Internal: Bullish.
Analysis and bias remains the same as analysis dated 20 October 2025.
Price has printed as per previous intraday expectation by printing a bearish CHoCH which indicates, but not confirms, bullish pullback phase initiation.
Price is currently trading within an established internal range, however, I will continue to monitor price with regards to depth of pullback.
Intraday expectation:
Price to continue bearish, react at either discount of 50% internal EQ, or H4 supply zone before targeting weak internal high priced at 4,380.990.
Note:
The Federal Reserve’s sustained dovish stance, coupled with ongoing geopolitical uncertainties, is likely to prolong heightened volatility in the gold market. Given this elevated risk environment, traders should exercise caution and recalibrate risk management strategies to navigate potential price fluctuations effectively.
Additionally, gold pricing remains sensitive to broader macroeconomic developments, including policy decisions under President Trump. Shifts in geopolitical strategy and economic directives could further amplify uncertainty, contributing to market repricing dynamics.
H4 Chart:
M15 Analysis:
-> Swing: Bullish.
-> Internal: Bearish.
You will note how price remains contained in consolidation between a supply and demand zone. The rest of my analysis and bias remains the same as bias date 29 October 2025.
As expected, price has printed a bullish CHoCH to indicate bullish pullback phase initiation.
Price is now trading within an established internal range.
Intraday expectation:
Price to continue bullish, react at either premium of internal 50% EQ or M15 demand zone before targeting weak internal low, priced at 3,886.465.
Note:
Gold remains highly volatile amid the Federal Reserve's continued dovish stance, persistent and escalating geopolitical uncertainties. Traders should implement robust risk management strategies and remain vigilant, as price swings may become more pronounced in this elevated volatility environment.
Additionally, President Trump’s tariff announcements, particularly against China, are expected to further amplify market turbulence, potentially triggering sharp price fluctuations and whipsaws.
M15 Chart:

XAU/USD 10 September 2025 Intraday AnalysisH4 Analysis:
-> Swing: Bullish.
-> Internal: Bullish.
Analysis and bias remains the same as analysis dated 20 October 2025.
Price has printed as per previous intraday expectation by printing a bearish CHoCH which indicates, but not confirms, bullish pullback phase initiation.
Price is currently trading within an established internal range, however, I will continue to monitor price with regards to depth of pullback.
Intraday expectation:
Price to continue bearish, react at either discount of 50% internal EQ, or H4 supply zone before targeting weak internal high priced at 4,380.990.
Note:
The Federal Reserve’s sustained dovish stance, coupled with ongoing geopolitical uncertainties, is likely to prolong heightened volatility in the gold market. Given this elevated risk environment, traders should exercise caution and recalibrate risk management strategies to navigate potential price fluctuations effectively.
Additionally, gold pricing remains sensitive to broader macroeconomic developments, including policy decisions under President Trump. Shifts in geopolitical strategy and economic directives could further amplify uncertainty, contributing to market repricing dynamics.
H4 Chart:
M15 Analysis:
-> Swing: Bullish.
-> Internal: Bearish.
You will note how price remains contained in consolidation between a supply and demand zone. The rest of my analysis and bias remains the same as bias date 29 October 2025.
As expected, price has printed a bullish CHoCH to indicate bullish pullback phase initiation.
Price is now trading within an established internal range.
Intraday expectation:
Price to continue bullish, react at either premium of internal 50% EQ or M15 demand zone before targeting weak internal low, priced at 3,886.465.
Note:
Gold remains highly volatile amid the Federal Reserve's continued dovish stance, persistent and escalating geopolitical uncertainties. Traders should implement robust risk management strategies and remain vigilant, as price swings may become more pronounced in this elevated volatility environment.
Additionally, President Trump’s tariff announcements, particularly against China, are expected to further amplify market turbulence, potentially triggering sharp price fluctuations and whipsaws.
M15 Chart:

XAUUSD wave structure analysis on H1, M15 timeframesH1 swing is bullish => current is pullback down
M15 swing is bearish => currently is pullback up
We can look for selling opportunities when the price goes up to the supply zone of M15

#CADJPY +2300 Pips Swing Buy With Three Major Targets| Possible?The CADJPY has nicely formed a swing bullish pattern that is confirmed. One strong entry zone lies between these prices, 109 and 106, which remain a critical level. As described in the chart, there are three targets to focus on. We strongly recommend thoroughly examining the charts and reading them carefully, as this description is brief due to the detailed chart.
Here’s what to look for:
- Look for a continued or repeated pattern to better understand the next possible move.
- Look for volume when it emerges; enter with the trend momentum.
- Don’t forget to like and comment on the chart!
Team Setupsfx_

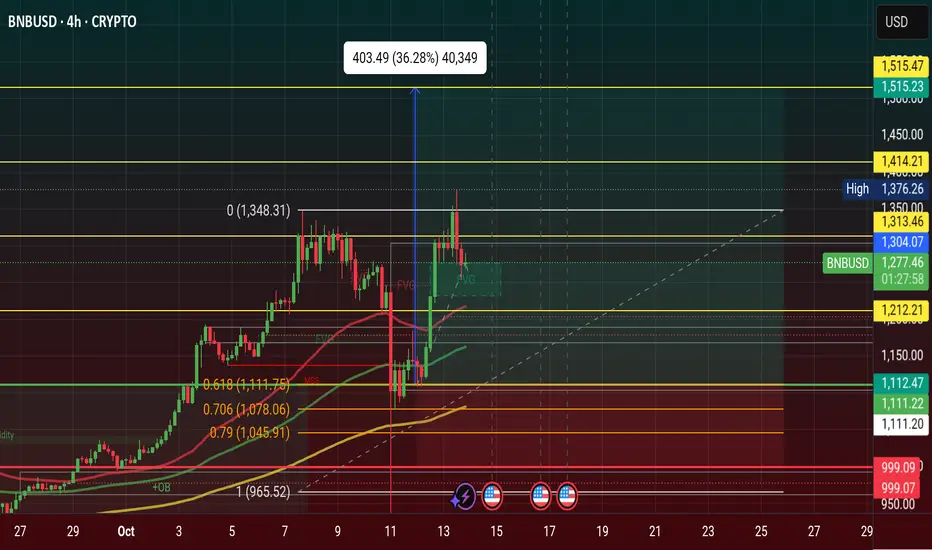
$BNB Price Will Hit $1,515 in this Q4 of 2025, See more chart...CRYPTOCAP:BNB Price Will Hit $1,515 in this Q4 of 2025, See more chart...The previous Resistance area is $888 and now it's Strong Support Zone. Chart is Showing the Price order block area is $999 area. The Main Enty is $1,111 this area. The Major Resistance is $1,212 area and last think this and The Dynamic Resistance is $1,313 area.
The 4 Point of Profit area. 1st Target will $1,212 area, 2nd Target will $1,313 and 3rd Target will $1,414 area, 4th Target will $1,515 area.
Stoploss will $999 area oand always use it. Never losing your all assets. just every trade using your strategy but it's will have using Stoploss and setup your Mind. The Losing Trade you will get if you don't use Stoploss on everyone.
Now Price Bounce Back $1,212 but if it's break the Resistance Area than it's will happened Fake Breakout. But price will Downfall again, if its breakout the ATH area than confirmed price goes to the $1,515 will touch Price level area.
#Write2Earn #BinanceSquareFamily #Binance #BNB #SUBROOFFICIAL
Disclaimer: This article is for informational purposes only and does not constitute financial advice. Always conduct your own research before making any investment decisions. Digital asset prices are subject to high market risk and price volatility. The value of your investment may go down or up, and you may not get back the amount invested. You are solely responsible for your investment decisions and Binance is not available for any losses you may incur. Past performance is not a reliable predictor of future performance. You should only invest in products you are familiar with and where you understand the risks. You should carefully consider your investment experience, financial situation, investment objectives and risk tolerance and consult an independent financial adviser prior to making any investment.
EURUSD wave structure analysis on 15 minute time frame1H, 4H swing is bullish
M15 swing is bearish
possibility of price falling to the demand zone of H1 frame

Building a Trading Plan: The 2nd StepMy trading journey has been defined by a search for consistency. For years, I operated under the belief that a trading plan was a strict list of entry and exit rules. I would follow these rules, yet my results remained unpredictable. The turning point came when I began to understand what is a successful Forex trading plan is. Surely, it is not a rigid document, but a dynamic decision-making system.
The first component of this system is identifying the trading range. This foundational step seems simple, but I learned that its execution is critical. The range establishes the market's current context. It defines the battle between buyers and sellers, creating a clear framework for all subsequent analysis. Without accurately identifying this zone, every decision that follows is built on an unstable foundation. I spend a significant portion of my analysis time confirming these boundaries, knowing that everything else depends on it.
The second component, and the one that brought the entire process into focus for me, is the concept of inducement. In the methodology I am testing, inducement represents a key liquidity area. It is a level where the market is likely to see significant activity from larger participants. Learning to identify these zones clarifies both ends of the trading range. It was no longer just a box on a chart; it became a map with highlighted areas of strategic importance.
This understanding created a powerful filter. It helped me distinguish between a simple break of a level and a meaningful move targeting a specific liquidity pool. My plan specifically focuses on what is classified as a major inducement, which allows me to ignore the minor. This step directly addressed the inconsistency in my earlier trading, as it provided a logical reason for price action beyond basic support and resistance.
Perhaps the most important lesson has been the dynamic nature of a true trading plan. The market is not static, and neither can a Forex trading plan be. I recall a specific backtesting session analyzing the GBPUSD pair on the 15 Minute time frame where a clear change of character occurred. The price action broke a previously defined range. A clear rule shows the difference between a break of strucutre and change of character. Now, I just need to redefine the new trading range with the help of the inducement level. As simple as that.
This proves that a plan’s value is not in preventing change, but in providing a structured method to adapt to it. The plan I am building is a living system. It guides me not only on when to enter a trade but, just as crucially, on when to stand aside and reassess the market structure. This ongoing process of learning and adaptation is, for me, the true essence of what a Forex trading plan must be.
