Falling Wedge - is bullish reversal possible?SMCI daily chart seems to form a falling wedge pattern after a long steep drop. This might be a signal for bullish reversal theoretically. The condition is breaking of the wedge boundaries upward ⬆️, which is right now over 30$ range. If the price can break above this range, the target might be around 44$ at least. Let's see what happens most importantly after the earnings date on 3rd February.
SMCI

SMCI Loss of this Support can result into crash to $10.Supermicro Computer Inc. (SMCI) has been under heavy pressure since its March 2024 ATH and last month hit and held its 1M MA50 (blue trend-line). This is a key Support level, which even though it broke on the November 2024 crash, the price managed to recover and close the month back up above it. In fact, the last time SMCI closed a month below it was in March 2020 during the COVID flash-crash.
As a result, loss of this level can result into an accelerated sell-off, technically the second Bearish Leg of the long-term Channel Up, towards the 1M MA200 (orange trend-line). If it is as strong as the first Bearish Leg, then we should be expecting a -86% decline to $10.00, which would technically make contact with the 1M MA200.
Notice also how similar the current 1M RSI structure is with SMCI's last Channel Down correction in 2015 - 2018.
---
** Please LIKE 👍, FOLLOW ✅, SHARE 🙌 and COMMENT ✍ if you enjoy this idea! Also share your ideas and charts in the comments section below! This is best way to keep it relevant, support us, keep the content here free and allow the idea to reach as many people as possible. **
---
💸💸💸💸💸💸
👇 👇 👇 👇 👇 👇

SUPER MICRO SEMI #SMCI Can bounce hard to $60This stock has been hit hard on prior forecast cuts and underwhelming results.
So after a big derating, a "less bad than feared" can be a classic bullish catalyst.
So after sentiment washed out but secular #AI demand still intact, can encourage dip buying and short covering in this name.
We also have the #ASML rumour of IP leaking and SMCI speeding up their own fabrication technology.

SMCI - Small UpsideFrom October to December 2025, SMCI completed a five-wave impulsive move.
SMCI has now entered a corrective phase.
The nearest target is around 36 .
Price may consolidate within the 29 - 36 range for some time.
Potentially, a move toward 44 remains possible.
---
Please subscribe and leave a comment.
You’ll get new information faster than anyone else.
---

SMCI cools the servers while the market warms up expectationsSMCI continues to move inside an ascending channel and is currently trading in the buy zone between the 0.618 and 0.786 Fibonacci levels. Strong demand appears within this range and the ma200 adds structural support as a dynamic base. Weekly divergence indicates weakening selling pressure and increases the probability of a renewed upward cycle. As long as price holds above the ma200 and stays within the channel, the structure remains bullish with the next targets at 41.88 and later at 62.35.
Super Micro Computer remains one of the global leaders in artificial intelligence server infrastructure. As of December 4, trailing twelve month revenue stands near 14.9 billion dollars. Net income exceeds 850 million dollars and cash reserves remain above three billion dollars. The company expands production of liquid cooled systems and next generation platforms for advanced model training. Global demand for artificial intelligence compute capacity continues to strengthen revenue and support margins. Minimal debt levels provide stability during market volatility.
As long as price remains within the buy zone between the 0.618 and 0.786 levels and above the ma200, the bullish continuation scenario remains valid. A confirmed breakout opens the way toward 41.88 and later toward 62.35. Technical and fundamental signals currently align which increases the probability of a new upward wave.
Servers cool down slowly, but trends usually heat up faster, especially with charts like this.

SMCI long-term TASMCI is a biggie, it was slammed pretty heavily after the recent earnings report and as of this moment mid-term is in heavy distribution, which seems like it's close to bottom out, yet weekly time frame uptrend is not ready yet but there's a positive divergence in accumulation.
In general, SMCI has a perspective for growth but it's broken yet, it needs more time to bottom out.

SMCI - Bull Flag Breakout SetupSMCI formed a strong bullish impulse followed by a bull flag pattern.
A breakout above the flag structure may signal continuation if confirmed with strong price action.
Trade Plan:
• Entry: On breakout or retest
• Stop Loss: Below flag support
• TP1: Recent high
• TP2: Measured flagpole extension
This setup is worth monitoring for potential bullish continuation.
Disclaimer: This is not financial advice. For educational purposes only.

Is AMD expensive? Earnings News!AMD just posted a double beat and reporting a record amount of revenue. crossing the $9billion mark.
The company expects revenue of about $9.6 billion for the next quarter, plus or minus $300 million, compared with analysts' average estimate of $9.15 billion.
AMD last month said it would supply AI chips to OpenAI in a multi-year deal that would bring in tens of billions of dollars in annual revenue and give the startup the option to buy up to roughly 10% of the chipmaker.
The deal covers the deployment of hundreds of thousands of AMD's graphics processing units (GPUs), roughly equivalent to the energy needs of 5 million U.S. households, or about thrice the amount of power produced by the Hoover Dam.
The stock still seems a bit expensive for my liking but a good solid report.

SMCI – Sell the Spike, Buy the Dip Again?With SMCI approaching a key resistance zone around $64, I'm preparing for a potential pullback. If the price fails to break through that level convincingly, we could see a healthy dip — which I’ll use to re-enter. This is a classic “sell high to buy lower” setup — let the market breathe, then strike.
🟢 Entry Points (Buy the Dip):
$49
$45
$40
🔴 Profit Targets:
✅ $55 – quick bounce zone
✅ $60 – key resistance
✅ $65+ – if momentum continues
📌 Let the chart come to you — don’t chase.
Disclaimer:
This analysis is for educational and informational purposes only and does not constitute financial advice. Always do your own research and evaluate your risk tolerance before making any investment decisions.

SMCI 100 !WOW.. SMCI is moving finally !!
These laggards in Semi space are getting some bid lately.
Around 35 was good buy zone but not late, if 64 breaks this can be a double soon.
This is above all major VWAPs now.
Long anywhere between 48-60
Target 1 - 80
Target 2 - 100
Stop Loss - 40

ANDREW «LEFT» GOES ANDREW «UP» AS PALANTIR CELEBRATES 5YRS ANNIVAndrew Left from "Citron Research" made his name writing shrewd short-seller reports on companies he deemed troublesome. In mid-August, Left called high-flying Palantir "overvalued".
Since that the stock turned down nearly 17% but resistently printed "Double Top" technical figure after. Now Left is excited about the bullish perspectives.
Palantir shares have jumped more than 1,700% since the data analytics company opened on the New York Stock Exchange 5 (five) years ago on Spetember 30, 2020.
During that time, revenue has roughly quadrupled as the company inked more deals with the U.S. government and benefitted from advancements in artificial intelligence.
Palantir’s steep valuation and reliance on government contracts have raised concerns.
The stock price has surged more than 1,700%, closing on Monday nearly at $180 for a market cap of over $430 billion. That puts it among the 20 most-valuable U.S. companies, and above tech stalwarts like Cisco and IBM.
Last year, Palantir joined the S&P 500, replacing American Airlines NASDAQ:AAL .
Quarterly revenue surpassed $1 billion for the first time last quarter, and is expected to reach $4.2 billion this year, according to analysts surveyed by LSEG, up almost sixfold from 2019. The company’s roster of customers grew from 125 in the first half of 2020 to 849 at the end of June. During that time, Palantir has added 1,500 full-time employees.
CEO Alex Karp, who founded the company in 2003 alongside notable investors like Peter Thiel and Joe Lonsdale, was exerting optimism on day one of Palantir’s life on the public market.
“We’ve reached a base where our company is very significant,” Karp, who holds a law degree from Stanford and PhD in neoclassical social theory from Goethe University in Frankfurt, Germany, told in an interview on listing day.
“Being in the public space will help us with our clients and help us grow.”
In a report in August 2025, Citron Research’s Andrew Left, a noted above ex-short-seller, called Palantir “detached from fundamentals and analysis.” When compared to OpenAI’s recent $500 billion valuation, he said Palantir should be priced at $40, or less than one-quarter of its current price, if it was assessed the same revenue multiple as the artificial intelligence startup.
“Karp and his team should be proud. But for investors, that’s where discipline kicks in,” Left wrote. “Comparison is the enemy of happiness, and when measured against true AI leaders, Palantir’s price already reflects success beyond its fundamentals.”
Karp, who doesn’t shy away from a dispute, recently told detractors to “exit” if they “don’t like the price.”
“We are going to be the most important software company in the world, and people will figure out what that’s valued over a long period of time,” Karp said on the day of the company’s NYSE debut.
For now, i.e. over the past 5 years since IPO debut, Palantir is among Top 3 S&P500 index performers, alltogether with Supermicro NASDAQ:SMCI (#1 rank) and Nvidia shares NVDA (#3 rank).
Over the past twelve months, Palantir stock has added nearly +350 %, and this is the 2nd return over all components, just after new kid on the block, Robinhood Markets NASDAQ:HOOD stock that entered S&P500 index earlier this year.
--
Best wishes,
@PandorraResearch Team

SMCI bullish reversal confirmationSMCI has closed above 51 which means it has entered the golden pocket of the short swing rally .
This confirms its movement towards 60/62 easy
Entries here with stop loss 47 would be a good swing trade

SMCI ready to test the top of the Triangle at $63.50.Supermicro Computer Inc. (SMCI) has been trading within a 1-year Ascending Triangle but since August 06 it has been 'trapped' within its 1D MA50 (blue trend-line) and 1D MA200 (orange trend-line).
A closing above the 1D MA50, technically confirms the new Bullish Leg, targeting the top of the Ascending Triangle a $63.50.
If it then closes a full 1W candle above it, we will have a technical bullish break-out, targeting the All Time High (ATH) at $123.00.
-------------------------------------------------------------------------------
** Please LIKE 👍, FOLLOW ✅, SHARE 🙌 and COMMENT ✍ if you enjoy this idea! Also share your ideas and charts in the comments section below! This is best way to keep it relevant, support us, keep the content here free and allow the idea to reach as many people as possible. **
-------------------------------------------------------------------------------
💸💸💸💸💸💸
👇 👇 👇 👇 👇 👇

The rocket has lifted offWith Nvidia’s investment in OpenAI, Supermicro (SMCI) is expected to benefit from increased equipment purchases, which will boost its sales and help it recover the value lost due to unfounded rumors from certain fund managers. An initial recovery of 32% is projected, with a price target of up to $100 area.
Now we have a huge Symmetrical triangle pointing to 116

SMCI analysisEvery time price makes a fake breakdown below the 50 EMA, it quickly recovers and pushes higher.
Historically, these moves have led price to test the purple resistance zone highlighted on the chart.
Given the repeated pattern, I think the same dynamic could play out again, with price eventually making its way back to that resistance area.
🎯 Conclusion: Based on prior reactions to the 50 EMA, I expect SMCI to work its way toward the purple resistance zone. This is my professional view from the chart structure, though markets remain uncertain and no outcome is guaranteed.
👉 Stay tuned for more structured market insights — follow along for consistent expert-level analysis.

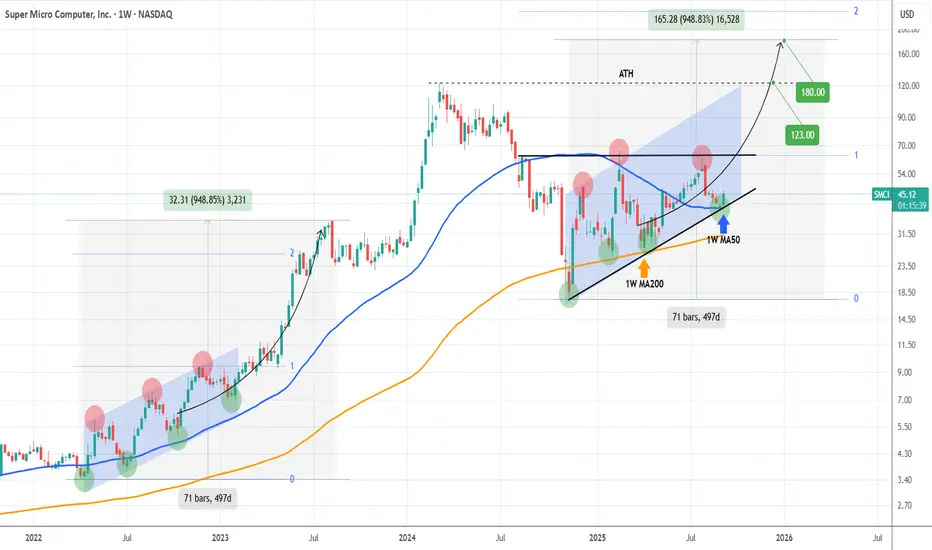
SMCI Rebounding on its 1W MA50 and targeting the ATH.Super Micro Computer Inc (SMCI) hit last week its 1W MA50 (blue trend-line) and this week posts a strong 1W candle. This rebound comes on the Higher Lows trend-line (bottom) of the 1-year Ascending Triangle.
It may not be exactly like the Channel Up of 2022 but it looks like a similar Accumulation pattern that preceded the massive 2023 rally. The Triangle typically breaks to the upside and technically targets the 2.0 Fibonacci extension. This time that would be even higher than the 2023 rise of +948.85%.
In any case that would be our over-extended Target ($180.00), with a more 'reasonable' one being the All Time High (ATH) of $123.00.
-------------------------------------------------------------------------------
** Please LIKE 👍, FOLLOW ✅, SHARE 🙌 and COMMENT ✍ if you enjoy this idea! Also share your ideas and charts in the comments section below! This is best way to keep it relevant, support us, keep the content here free and allow the idea to reach as many people as possible. **
-------------------------------------------------------------------------------
💸💸💸💸💸💸
👇 👇 👇 👇 👇 👇
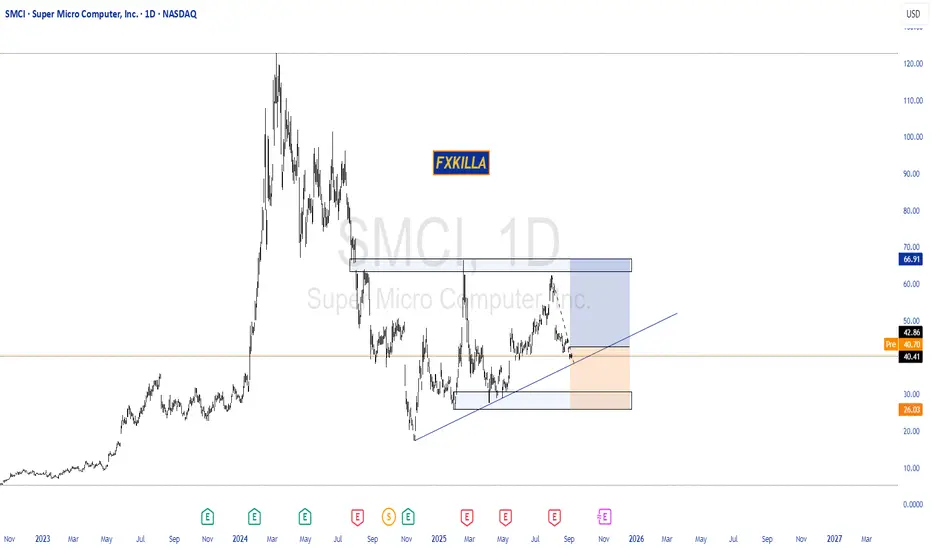
SMCI HIGH PROBABILITY SETUP SOON!!!🚨 SMCI HIGH PROBABILITY BUY SETUP 🚨
* Here We Can See Clearly The Next Potential Move For SMCI Coming Hours/Days.
* Keep Your Eyes Close On Your Trading Positions.
* Happy PIP Hunting Traders.
FXKILLA.
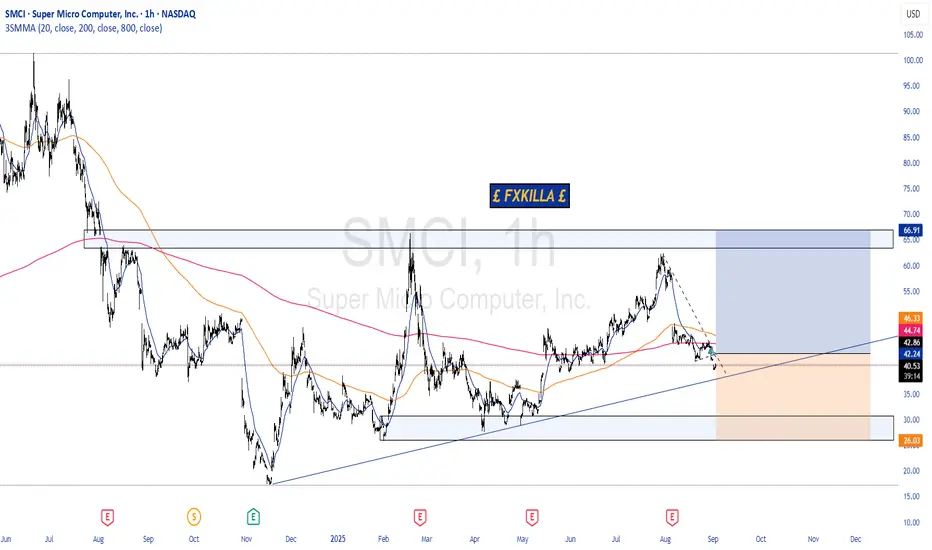
SMCI HIGH PROBABILITY BUY SETUP SOON!!🚨 SMCI HIGH PROBABILITY BUY SETUP 🚨
* Here We Can See Clearly The Next Potential Move For SMCI Coming Hours/Days.
* Keep Your Eyes Close On Your Trading Positions.
* Happy PIP Hunting Traders.
£ FXKILLA £
Smci iron condor 37/36 52/53 iron condor.
.22 limit+
9/26 expiration
100/200 sma on daily chart is a support. 100 sma on weekly is a resistance.

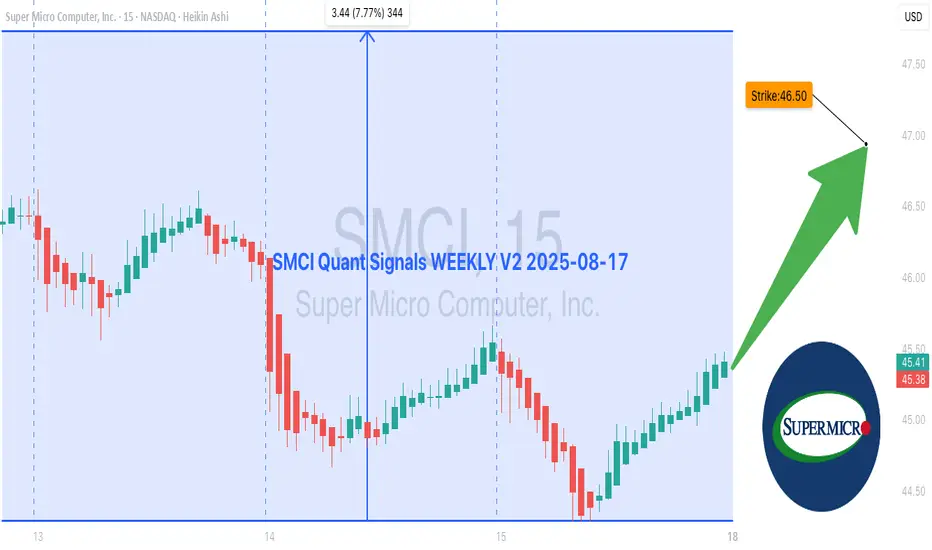
SMCI $46.50 Calls Poised for Explosive Move – Don’t Miss Out! 🚀 SMCI Weekly Options Analysis (2025-08-17) – Don’t Miss Out!
### 🔎 Model Insights Recap
**Grok/xAI Report**
* 📊 Daily RSI: 35.2 → short-term bearish pressure
* 📊 Weekly RSI: 55 → moderate bullish trend
* 📈 Call/Put Ratio: Strong bullish flow
* 🔊 Volume: Weak institutional support
* ✅ Decision: Moderate bullish → **\$47.00 Call**
**DeepSeek Report**
* 📈 Call/Put Ratio: 2.47 → bullish
* ⚠️ Conflicting daily/weekly signals
* 🛑 Decision: **No trade**
**Gemini/Google Report**
* 📊 Daily RSI bearish, Weekly RSI bullish
* ✅ Decision: Moderate bullish → **\$46.50 Call**
**Llama/Meta Report**
* 📊 Mixed sentiment, weak volume
* ✅ Decision: Moderate bullish → **\$46.50 Call**
**Claude/Anthropic Report**
* ⚠️ Daily momentum weak, weekly bullish potential
* 🛑 Decision: **No trade**
---
### 📌 Key Agreements & Disagreements
* **Agreements:** Call/put ratio bullish, daily RSI weak, volume declining → caution
* **Disagreements:**
* Bullish call recommendation: Grok/xAI, Gemini/Google, Llama/Meta
* No trade: DeepSeek, Claude/Anthropic due to conflicting signals
---
### 📊 Recommended Trade
* **Direction:** CALL (Long)
* **Strike:** \$46.50
* **Expiry:** 2025-08-22
* **Entry Price:** \$0.88 (bid/ask midpoint)
* **Stop Loss:** \$0.44 (50% of premium)
* **Profit Target:** \$1.32 (50–100% gain)
* **Entry Timing:** Market Open
* **Confidence:** 65%
---
### ⚠️ Key Risks
* Weak volume → insufficient institutional backing
* Daily RSI weak → short-term reversals possible
* Maintain exit strategy if price breaks support or fails to reach targets
---
📊 **TRADE DETAILS JSON**
```json
{
"instrument": "SMCI",
"direction": "call",
"strike": 46.50,
"expiry": "2025-08-22",
"confidence": 0.65,
"profit_target": 1.32,
"stop_loss": 0.44,
"size": 1,
"entry_price": 0.88,
"entry_timing": "open",
"signal_publish_time": "2025-08-17 12:07:47 EDT"
}
```
SMCI: When a chart says it’s time to reconnect with the AI hypeOn the daily chart, Super Micro Computer Inc. (SMCI) is showing a clean bullish setup. Price broke out of a descending trendline (green dashed), confirmed it with a retest, and is now consolidating above the breakout zone. The golden cross — where the MA50 crossed above the MA200 — confirms a long-term trend reversal.
Volume profile indicates strong accumulation near $41–43. The 0.5 Fibonacci level at $41.84 acted as support. Above the current range, there’s low volume resistance up to $63.57 (0.786), followed by $66.44 and a final extension target at $79.82 (1.272).
Fundamentals: SMCI is a leading server hardware manufacturer. Demand for their systems has soared with the explosion of AI infrastructure. The company maintains solid financials, with rising quarterly revenue and growing presence in the cloud sector. Institutional investors have been actively increasing their positions since late 2023 — a sign of strong long-term conviction.
Tactical plan:
— Entry: market $42–43
— Target 1: $55.91
— Target 2: $63.57
When technicals scream textbook breakout and fundamentals bring AI momentum to the table — it might just be one of the best late entries in the AI wave this summer.

SMCI WEEKLY CALL SETUP (07/28/25)
### 🔹 SMCI WEEKLY CALL SETUP (07/28/25)
**Bullish Flow + Strong RSI = 🚀 Call Opportunity at \$62**
---
### 📊 TECHNICAL SNAPSHOT
* **RSI (Daily + Weekly):** ✅ Above 55 — clear bullish strength
* **Weekly Close:** 🔼 Broke prior highs — momentum continuation likely
* **Volume Ratio:** Slightly weak (0.9x) 📉 — watch early-week participation
* **VIX:** 14.93 💤 — low vol = smoother price action (great for weekly calls)
---
### 💥 OPTIONS FLOW HIGHLIGHTS
* **Call/Put Ratio:** 4.30 🔥 (heavy bullish skew)
* **Hot Strikes:** \$62.00 & \$63.00 = aggressive positioning
* **OI Surge:** Confirmed institutional interest → upside bets stacking up
---
### ✅ TRADE SETUP
* 🎯 **Strategy:** Long Weekly Call
* 📈 **Strike:** \$62.00
* 📅 **Expiration:** Aug 1, 2025
* 💸 **Entry Price:** \$0.86 (ask)
* 🛑 **Stop Loss:** \$0.43 (50% risk)
* 🎯 **Target:** \$1.20 (40% upside)
* 📈 **Confidence:** 80%
* ⏰ **Entry Timing:** Market open
---
### 🚨 KEY RISKS
* ⚠️ Weak volume = lower conviction from institutions
* 📉 Watch early-week flow → exit if buyers fade
* 🎯 Above \$63 = breakout fuel
* 🧨 Below \$61 = trend in question
---
### 🧠 MODEL CONSENSUS
> All quant models bullish except **one cautioning on volume**
> Options flow + RSI = overwhelming bullish case
---
### 📦 TRADE\_DETAILS (Algo-Friendly JSON)
```json
{
"instrument": "SMCI",
"direction": "call",
"strike": 62.0,
"expiry": "2025-08-01",
"confidence": 0.80,
"profit_target": 1.20,
"stop_loss": 0.43,
"size": 1,
"entry_price": 0.86,
"entry_timing": "open",
"signal_publish_time": "2025-08-01 09:30:00 UTC-04:00"
}
```
---
📈 **Watch zones:**
* 🚀 Above \$63 = breakout
* 🛑 Below \$61 = cut risk
---
**#SMCI #OptionsFlow #CallOptions #WeeklyTrade #RSI #BullishMomentum #MarketOpenSetup #QuantSignals #OptionsAlert**

SMCI going to breakout soon, targeting $200NASDAQ:SMCI hasfound support at $28, it is currently trading around the $46 level. It is attempting to test the $50-$61 range for the third time and will likely turn this level into support with a breakout.
$200 could be a good psychological target. The relative strength against the SP:SPX is about to turn positive in favor of the stock, and I expect volume to increase in the coming days.
