XAUUSD OVERVIEW FOR 12/16XAUUSD OVERVIEW FOR 12/16
Strategy Summary
Gold is holding steady but the main trend is unclear due to a series of strong news today. I will trade in a "wait for confirmation" style, clearly dividing into two scenarios:
Price increase confirmed when breaking above 4320
Price decrease confirmed when breaking below 4271
1) Important price levels on the chart
4320: confirmation point for buyers + resistance/FVG area above
4370 – 4373: strong liquidity area → prioritize waiting for a reaction to SELL
4271: confirmation point for sellers (break support)
Lower area (according to structure/trend line): deep support area where price may react before bouncing back (as per the arrow drawn)
2) Today's trading scenarios (in "trade the level" style)
Scenario A – Price Increase (only confirmed when breaking above 4320)
If the H1 candle closes clearly above 4320, gold is likely to move up to test the liquidity area above.
Priority at this time: watch for short-term BUY according to the rhythm (as per the arrow), avoid FOMO in the middle.
Reasonable target: heading towards the 4370 – 4373 area (Strong Liquidity).
But note: 4370 – 4373 is an area prone to "sell reaction" due to large liquidity there.
Scenario B – Price Decrease (confirmed when breaking below 4271)
If the price breaks below 4271 and the retest fails, the bearish scenario will prevail (consistent with the "sell retest" idea on the chart).
✅ Sell 4271
SL: 4280
Expectation: the price may extend the downward rhythm to deeper support areas according to the structure.
3) Main SELL order at the large liquidity area
✅ Sell entry: 4370
SL: 4380
Logic: This is a "Strong Liquidity" area – where profit-taking/distribution forces are likely to appear. Only SELL when there is a reaction, do not chase the sell.
4) Today's News
Today there is a series of data that could cause gold to swing sharply and sweep both ends:
Average Hourly Earnings m/m
Core Retail Sales m/m
Non-Farm Employment Change
Retail Sales m/m
Unemployment Rate
Flash Manufacturing PMI
Flash Services PMI
My principle: light volume before the news, wait for the market to "reveal its hand" after the news, then follow 4320 / 4271.
5) Risk Management
Do not enter orders in the middle of the noise. Only trade when the price hits the level and there is confirmation.
Question for everyone: Which scenario do you lean towards today — breaking above 4320 or breaking below 4271?
Smctrading

XAUUSD – Lana prefers Sell, Buy is only for scalping XAUUSD – Lana prefers Sell, Buy is only for scalping 💛
Quick Summary
Short-term trend: Downward pressure dominates
Timeframe to watch: H1
Strategy: Sell is primary; Buy is only for short-term, quick trades at liquidity zones
Note: Today there are many US data releases and events, so volatility could be higher than usual
Market Context
The market enters the session with a dense news flow: US President’s speech, unemployment rate, seasonally adjusted non-farm payrolls, and retail sales.
In such a context, gold often experiences strong swings and liquidity hunts before moving in the main direction. Therefore, Lana prioritises selling at higher zones and only buying short-term when the price reaches clear support areas.
Technical View
After the previous upward move, the H1 structure shows that the price is weakening and a continuation of the downtrend is likely.
The upper zone, where short-term resistance converges, is suitable for Sell trades following the intraday trend. Below, liquidity zones may trigger bounce reactions, but Lana considers these only for scalping and does not hold long Buy positions.
Intraday Trading Scenarios
Main scenario – Sell with the trend
Sell: 4308 – 4312
SL: 4320
This is Lana’s preferred zone today. If the price retraces to this zone and shows rejection, the downtrend is likely to continue.
Buy Scenario 1 – Scalping near support
Buy: 4253
SL: 4240
This Buy is only for a short wave, with priority on quick profit-taking when there is a reaction.
Buy Scenario 2 – Scalping at deep liquidity zone
Buy: 4213
SL: 4200
This is a stronger liquidity zone. If the price drops quickly here during news releases, a technical bounce may occur, but Lana still prefers not to hold Buy positions for long.
Session Notes
Asian – European sessions: may see oscillations and technical retracements
US session: can experience strong news-driven moves, sweeping both ends before choosing a clear direction
Each scenario is only a probability, not a certainty.
On high-news days, Lana always reduces position size, sets clear SLs, and accepts skipping trades if the price does not reach the target zones.

XAUUSD H1 – POC 4295 & Fibonacci Sell 4373XAUUSD H1 – POC 4295 & Fibonacci Sell 4373
Strategy Summary
Today, I am not chasing price. The XAUUSD trading plan revolves around two of the cleanest zones on the chart:
POC (Volume Profile) around 4295 to look for BUYs in line with the main money flow.
Fibonacci level at 4373 to look for SELLs when price reaches the premium zone.
Key Levels
BUY zone (POC – Volume Profile): 4295 (major liquidity area)
SELL zone (Fibonacci reaction): 4373
Deeper buffer if POC breaks: 4238 – 4241
Invalidation level: 4191
Scenario 1 – Primary Plan: BUY at the Liquidity Zone (POC)
✅ Buy limit around 4295 (preferably wait for H1 candle confirmation)
SL: 4287 (below the POC zone to avoid noise)
TP1: 4330 – 4338
TP2: 4370 – 4373 (approaching the Fibonacci sell zone)
Logic:
The POC represents the “fair value” or balance point of the Volume Profile. Price is often drawn back to this level to collect liquidity before committing to the next directional move.
Scenario 2 – SELL on Reaction at Fibonacci (Premium Zone)
✅ Sell around 4373 (wait for a reaction or loss of momentum; do not chase the trade)
SL: 4382
TP1: 4338 – 4330
TP2: 4295 (return to the POC)
Logic:
The Fibonacci premium zone is commonly where profit-taking pressure emerges. If price spikes into 4373 but fails to hold, it often provides a textbook reaction sell setup.
Alternative Scenario – If the POC Is Broken
If price breaks below 4295 and clearly closes an H1 candle beneath this level, I will not force buy positions. Priority then shifts to waiting for price to react at:
4238 – 4241, or
deeper towards the lower balance / POC zone.
Always keep in mind that 4191 is the invalidation level.
News Context (to Avoid Being Stopped Out)
Trump has expressed concerns that economic impacts have “not fully filtered through yet”, increasing political risk and market sensitivity.
Comments from Williams (FOMC, New York Fed) on the economic outlook may trigger short-term volatility in USD and yields, leading to sharp moves in gold.
Tip: Avoid late entries during news-driven spikes. Only execute trades when price reaches the predefined zones.
Risk Management
Maximum risk per trade: 1–2%
Do not trade in the middle of the range. Trade only at key levels.
If you are also monitoring 4295 and 4373, share your view:
👉 Are you leaning towards a BUY on pullback or a SELL on reaction today?

XAUUSD – Lana waits for reaction at resistance, focusing on ...XAUUSD – Lana waits for reaction at resistance, focusing on zone-based trading
Quick Summary
Context: The week starts with many high-impact news events. Gold opened with a strong rally and is now approaching a major resistance zone.
Timeframe: H1
Strategy: No chasing price. Priority is to wait for buys at the liquidity void (VL) zone and look for corrective sells at higher resistance.
Expectation: The Asian–European sessions may move sideways, with stronger volatility likely during the US session.
Market Context
The year-end period is typically packed with economic data. Non-Farm Payrolls, CPI, and Retail Sales are all released within the same week, alongside interest-rate decisions from the UK, Europe, and Japan.
For gold, this environment often leads to sharp moves during the US session, while earlier sessions tend to consolidate or make shallow pullbacks as the market waits for news.
Technical View
After a strong rally at the start of the week, price is currently trading around a key resistance area. On the H1 timeframe, the Asian session open left a liquidity void (VL), which is Lana’s preferred area to wait for price to return and look for trend-aligned buy setups.
On the upside, a trendline combined with Fibonacci extension levels is forming a sufficiently strong resistance zone to consider a short-term corrective sell.
Trading Scenarios for the Start of the Week
Primary Scenario – Buy at the liquidity void (VL)
Buy: 4298 – 4302
SL: 4294
This is Lana’s highest-priority zone. If price returns to fill the liquidity void and structure remains intact, there is a strong probability of a bullish reaction in continuation of the broader trend.
Secondary Scenario – Corrective sell at higher resistance
Sell: 4367 – 4370
SL: 4376
This scenario is viewed as a short-term correction when price reaches a strong resistance zone. The sell is counter-trend, so strict risk management is essential and positions should not be held for too long.
Session Notes
Asian – European sessions: price may range and show mild volatility around current levels.
US session: higher volatility is likely, with liquidity sweeps and clearer execution of the outlined scenarios.
Wishing everyone calm and disciplined trading in this news-heavy week.

XAUUSD Wave 5 Completed, Entering an ABC Correction CycleXAUUSD – Wave 5 Completed, Entering an ABC Correction Phase
Weekly Plan Summary
Gold has completed Wave 5 with a very strong impulsive rally and is now entering an ABC corrective phase to complete the Elliott Wave structure.
For the coming week, the primary strategy is to SELL at the Fibonacci resistance zone 4316–4320, then look for BUY reactions at the major liquidity area around 4215.
1) Elliott Wave – Why the Market Is Likely Entering an ABC Phase
The recent rally shows clear end-of-Wave-5 characteristics: strong momentum, long bullish candles, followed by a sharp downside reaction (profit-taking and liquidity withdrawal).
Once Wave 5 is completed, the market typically moves into an ABC correction to rebalance supply and demand and complete a full Elliott cycle.
ABC Structure Based on the Chart Provided
A-leg: Price drops into the 4259–4262 area (first reaction zone of the correction).
B-leg: Price retraces back towards 4316–4320 (the Fibonacci SELL zone on the chart).
C-leg: Price continues lower towards 4215 (POC + major liquidity cluster formed late last week) — this is the primary target of the correction.
2) Key Price Levels
Sell Zone (B-leg): 4316 – 4320 (Fibonacci resistance)
Near Support (A-leg reaction): 4259 – 4262
Mid Support: 4238 – 4241
Main Target / Liquidity Area: 4215 (POC + major liquidity cluster)
Scenario Invalidation Level: 4191
If price breaks below this level, the structure will need to be reassessed.
3) Trading Scenarios for the Coming Week
Scenario 1 (Preferred): SELL at the End of the B-leg
Sell: 4316 – 4320
SL: 4326 (clear break above the sell zone)
TP1: 4262
TP2: 4240
TP3: 4215
Logic:
The B-leg is typically just a corrective pullback within the broader ABC structure. Selling at the Fibonacci resistance offers a far better risk-to-reward profile than chasing shorts mid-range.
Scenario 2: BUY Reaction at the End of the C-leg
Buy: Around 4215 (preferably with a clear reaction)
SL: 4191
TP1: 4240
TP2: 4262
TP3: 4290 – 4310 (if structure reverses and the uptrend resumes)
Logic:
4215 is both the POC and a major liquidity zone, often acting as a “magnet” to complete the C-leg before a new market cycle begins.
Alternative Scenario: If Price Breaks and Holds Above 4320
If price breaks above 4320 and closes clearly on H1 above this level, the ABC correction may be delayed, and gold could extend higher into the next resistance zone.
In this case:
Do not stubbornly hold SELL positions.
Shift bias to waiting for pullbacks to BUY in line with the trend.
4) Fundamental Context – Volatility Likely to Increase, Supporting a Correction Phase
Philadelphia Fed President Anna Paulson noted that rate cuts have “removed some of the insurance” against risks in the labour market.
She also highlighted that while the labour market is under pressure, it has not yet broken. This reinforces a cautious Fed stance, a backdrop in which gold often experiences sharp liquidity sweeps before aligning with its technical structure.

XAUUSD Trend holds wait to re buy on pullbackXAUUSD (H1) — Bullish structure remains intact, waiting for pullbacks to re-buy at key zones
Strategy Summary
Price continues to move in line with the bullish plan. Two buy entries have already been captured, with price advancing by around ~5 points. At this stage, the priority is not to chase price, but to wait for pullbacks into reaction zones to re-enter in the direction of the trend.
1) Trading Plan (H1)
✅ Buy Zone 1: 4262 – 4258
SL: 4250
Rationale: A shallow pullback zone. If price maintains the bullish structure and reacts higher from this area, trend-following buys are preferred.
✅ Buy Zone 2: 4240 – 4235
SL: 4238
Rationale: A deeper pullback (better discount). If price sweeps this zone and then prints strong confirmation candles or a sharp rebound, this becomes a higher-quality buy area.
Projected targets (based on the chart):
Near resistance: 4285
Extended target: 4304 – 4307
2) Fundamental / News Context to Watch
The Fed releases US household financial conditions data (Capital Flow Report, Q3/2025).
Voting FOMC members and Philadelphia Fed President Paulson deliver remarks on the 2026 economic outlook.
The US has threatened to expand the seizure of Venezuelan oil tankers → geopolitical and energy-supply risks may increase volatility, with gold prone to sharp “spike” moves.
3) Technical & Behavioural Perspective
The current structure remains bullish. After a strong impulsive move, the market may require a pullback to rebalance before continuing higher.
The plan remains clear: only buy at predefined zones, no FOMO in the middle of the move.
If price breaks below the zones and H1 candles close beneath the stop-loss levels, the preferred approach is to stay flat and wait for a new structure to form.

XAUUSD H4 Lana Weekly AnalysisXAUUSD (H4) – Lana’s Weekly Analysis: Waiting for pullbacks to Fib 0.618 & 0.50 within major liquidity zones 💛
Higher-Timeframe Trend (D1)
Gold is revisiting its previous all-time high (ATH), but volume strength has not yet been convincing enough to confirm a strong breakout.
Primary Monitoring Timeframe
Timeframe: H4
Method: Fibonacci + trendline + liquidity zones + support/resistance
Plan: Lana avoids chasing price and prefers to look for BUY opportunities at discounted areas around Fib 0.618 and 0.50.
Market Context for the Coming Week
US Treasury yields, especially at the long end, remain elevated, making gold more prone to sharp short-term fluctuations.
Recent Fed commentary continues to reflect a cautious stance, while US political uncertainty may cause gold flows to become less predictable.
For this reason, Lana prioritises trading clearly defined price zones rather than attempting to forecast every short-term move.
H4 Technical Outlook (Medium-Term)
Gold’s current trading range is relatively wide. After a strong impulsive move, the market often needs a “cool-down” phase to rebalance liquidity.
On the H4 chart, the two most important areas align between Fibonacci retracement levels and major liquidity zones, making them suitable areas to wait for pullbacks before continuing in line with the broader trend.
Key Price Zones Lana Is Watching
1) Buy Zone 1 – Fib 0.618 (Preferred)
Entry: 4216 – 4220
Stop Loss: 4210
This is an attractive Fibonacci discount zone and an area where price is likely to react if larger flows step in to support the trend.
2) Buy Zone 2 – Fib 0.50 + Strong Support (Deeper Buy)
Entry: 4171 – 4175
Stop Loss: 4165
This scenario may unfold if price sweeps deeper liquidity before rebounding. Lana considers this a safer entry from a positional perspective, though it requires patience.
Trading Scenarios for the New Week
Primary Scenario – Trend-Following BUY on Pullbacks
Lana prefers to wait for price to retrace into 4216–4220, or deeper into 4171–4175, before entering trades.
If price reacts positively, upside targets will focus on rebounds towards higher resistance zones and the nearest recent highs.
Secondary Scenario – If Price Remains Elevated
If price remains in premium territory with heightened volatility, Lana does not recommend late entries.
Instead, the focus is on observing price behaviour and waiting for pullbacks into the predefined zones for cleaner, lower-risk execution.
Lana’s Notes 🌿
Each setup represents a probability, not a certainty.
Stop losses are always set in advance, with position sizing kept moderate to accommodate gold’s wide volatility.
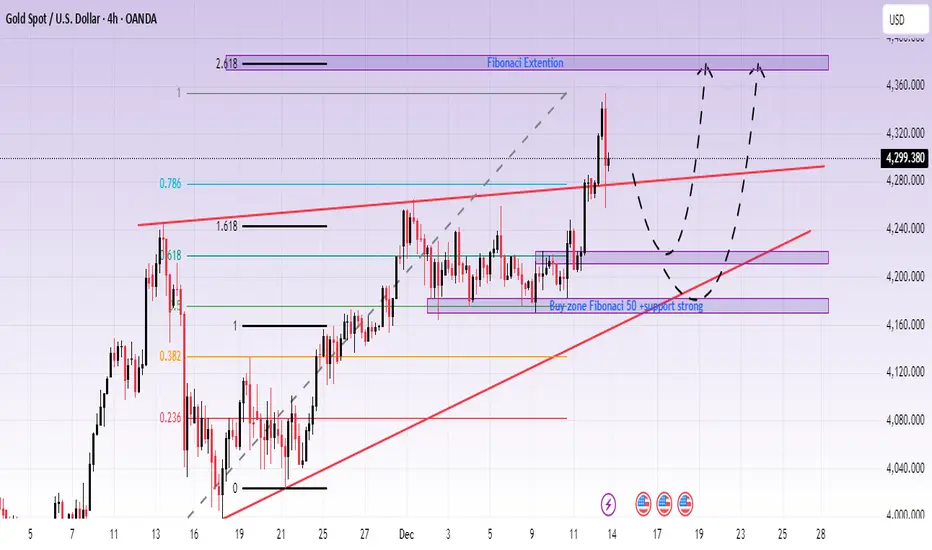
Gold 4H – Will 4380 Liquidity Cap Price Before a Deep Pullback?🟡 XAUUSD – Weekly Smart Money Concept Plan
📈 Market Context
Gold enters the new week trading inside a well-defined 4H bullish structure, but price is now pressing into a premium liquidity zone where previous highs and resting buy-side liquidity converge.
With USD volatility expected around upcoming U.S. macro data and policy-related headlines, this environment favors liquidity engineering rather than clean continuation. Smart Money typically uses such premium zones to induce late buyers before delivering corrective moves toward discounted demand.
From an SMC perspective, the market is primed for external liquidity raids on both sides before a clearer weekly expansion unfolds.
🔎 Technical Analysis (4H / SMC View)
🔴 Sell Zone: 4380 – 4382
SL: 4390
TP Targets: 4350 → 4320 → 4285 → 4255
Rationale:
• Premium pricing above 4H structure highs
• Buy-side liquidity resting above equal highs
• Likely distribution after bullish leg exhaustion
• Mean-reversion pullback toward internal range liquidity
🟢 Buy Zone: 4233 – 4231
SL: 4223
TP Targets: 4265 → 4300 → 4340 → 4380+
Rationale:
• Discount zone aligned with rising 4H trendline
• Demand mitigation area after prior impulsive move
• Sell-side liquidity sweep expected before re-accumulation
• Favorable risk-to-reward for trend-continuation longs
⚠️ Risk Management Notes
• Wait for M15–M30 ChoCH or BOS confirmation before execution — no blind entries.
• Expect aggressive wicks and stop-hunts near session opens (London / New York).
• Reduce exposure ahead of high-impact USD news and Fed-related headlines.
• Secure partial profits at each TP; only trail runners after structure confirms continuation.
Summary
Gold remains in a 4H bullish framework, but price is currently trading at a level where Smart Money is incentivized to sweep premium liquidity near 4380 before delivering a corrective move into the 4230 demand zone.
The higher-probability play is patience: let liquidity be taken, let structure confirm, then align with institutional flow.
Liquidity first. Structure second. Entries last.
🚀 Follow @Ryan_TitanTrader for more weekly SMC breakdowns

XAUUSD Lana is waiting for a pullback into the Fibonacci ...XAUUSD – Lana is waiting for a pullback into the Fibonacci discount zone, with 4285 as the key decision level 💛
Idea Summary
Main trend: Bullish continuation, although price may retrace into Fibonacci levels before pushing higher
Timeframe: M30
Strategy: No chasing price; Lana waits for price to reach clearly defined buy zones
Key level: 4285 is a strong resistance and a decisive level for the next directional move
Market Context
The Fed is placing significant expectations on rising labour productivity to ease pressure between economic growth, inflation, and the labour market. This keeps expectations for rate cuts next year relatively cautious. For gold, such conditions often result in large price swings, making a zone-based trading plan essential.
Key Price Zones Lana Is Monitoring
4285: Strong resistance, major reaction zone
4265: Short-term target
4245–4248: Fibonacci-based buy zone combined with price imbalance
4210–4213: Liquidity buy zone if a deeper correction occurs
Trading Scenarios
Primary Scenario – Buying on pullback into the discount zone
Buy: 4245–4248
SL: 4240
TP: 4265 → 4285 → 4300
This zone aligns with Fibonacci retracement levels and previous strong price reactions, making it suitable for trend-following buys.
Secondary Scenario – Buying at the liquidity zone
Buy zone: 4210–4213
SL: 4205
TP: 4230 → 4255 → 4285
This represents a deeper corrective move, where price may sweep liquidity before stronger buying interest returns.
Each scenario is only one of many possible market outcomes. Lana always prioritises capital protection, uses clear stop-loss levels, and is comfortable skipping trades if price does not reach the planned zones.
Conclusion
4285 is a level that requires close attention. Strong reactions are highly likely if price approaches this area. A clean break and sustained hold above 4285 could allow the bullish trend to extend towards 4300.
This is Lana’s personal market view.

This week we leave it hereThe week has been overall bullish, but as we know we incurred a lot of losses, that is what we will be educating ourselves and finding solutions for. Instead of being bitter and sad about it, we try to win once more, but this time different, Happy trading.

Gold 1H - Will 4287 Liquidity Cap Price or 4248 Reload Demand?Gold 1H – Will 4287 Liquidity Cap Price or 4248 Reload Demand?
🟡 XAUUSD – Intraday Smart Money Plan | by Ryan_TitanTrader (12/12)
📈 Market Context
Gold remains highly sensitive to political and inflation narratives after former U.S. President Donald Trump stated he “inherited the worst inflation in history” but now sees prices cooling rapidly.
This rhetoric adds uncertainty to inflation expectations and future rate paths, keeping USD flows unstable intraday.
For gold, this environment favors engineered liquidity sweeps rather than clean directional continuation, as institutions exploit both inflation hedging demand and short-term USD strength.
On H1, price is trading inside a rising structure with clear liquidity resting above recent highs and demand stacked below the mid-range — a textbook Smart Money setup.
🔎 Technical Framework – Smart Money Structure (1H)
Current Phase: Expansion after BOS, now pausing into premium
Key Idea: Expect a liquidity sweep into premium (4285–4287) or discount (4250–4248) before true displacement
Structural Notes:
• Prior BOS + CHoCH confirms bullish context
• Price currently reacting inside a rising channel
• Liquidity is clearly defined on both edges
Liquidity Zones & Triggers:
• 🔴 SELL GOLD 4285 – 4287 | SL 4295
• 🟢 BUY GOLD 4250 – 4248 | SL 4240
Institutional Flow Expectation:
sweep → MSS/CHoCH → BOS → displacement → FVG/OB retest → expansion
🎯 Execution Rules (matching your exact zones)
🔴 SELL GOLD 4285 – 4287 | SL 4295
Rules:
✔ Liquidity sweep above recent highs into premium
✔ Bearish MSS / CHoCH on M5–M15
✔ Downside BOS with strong bearish displacement
✔ Entry via bearish FVG refill or refined supply OB
Targets:
1. 4270
2. 4258
3. 4250 – 4248
🟢 BUY GOLD 4250 – 4248 | SL 4240
Rules:
✔ Liquidity grab below channel support / equal lows
✔ Bullish MSS / CHoCH confirms demand takeover
✔ Upside BOS + impulsive displacement from discount
✔ Entry via bullish FVG fill or demand OB retest
Targets:
1. 4265
2. 4280
3. 4287 – extension if momentum holds
⚠️ Risk Notes
• Trump’s inflation comments can trigger sharp sentiment flips → wait for structure, not headlines
• Avoid entries without clear BOS + displacement
• Don’t trade mid-range noise inside compression
• Reduce size if volatility spikes during U.S. news hours
📍 Summary
Today’s gold setup is pure liquidity engineering:
• A 4287 sweep may trigger bearish structure back into 4250
or
• A 4248 liquidity grab could reload bullish flow toward 4280–4287
Let structure confirm — Smart Money reacts, retail predicts. ⚡️
📌 Follow @Ryan_TitanTrader for daily Smart Money gold breakdowns.

Professional Breakdown of the Analysis GOLD-SMCAnalysis…🫡🖤
Even though the trade stopped out by just a few pips, the institutional analysis was flawlessly respected and the market followed the projected bullish narrative exactly.
1. Sell-Side Liquidity Sweep
Price clears all previous sell-side liquidity, providing the fuel institutions need to build long positions at discount.
This sweep set the stage for the bullish reversal.
2. Structure Shift (BOS / ChoCH)
After the liquidity grab, price prints a clean BOS/ChoCH, signaling clear bullish institutional intent.
3. POI + Fakeout + Mitigation
Price returns precisely to the identified POI, performs a clean fakeout, and taps the origin of the bullish move.
Although the wick hit the SL by a few pips, the reaction confirmed the validity of the zone.
4. Institutional Rejection + Bullish Expansion
Once the POI was mitigated, price exploded upward, respecting every projected target:
4,230 – 4,254 – 4,277, exactly as mapped out in the analysis.
5. Conclusion
The trade didn’t survive the initial volatility, but the analysis was 100% correct.
The market validated every element of your institutional narrative.

LONG ON UJPossible push to the upside on UJ
Sell Side Liquidity taken and the high broken right after giving me the impression that big institutions may have forced the SSL in order to enter the market
1;50 rr, may seem far fetched but looks like a good trade to me
possibility to get stopped out because of the tight SL
safer sl would be 153.550

LONG ON NZDCADBOS followed by a grab on SSL(Sell Side Liquidity)
Indicates neeed to go to the upside so liquidity was taken below in the form of SL's from Buy orders and Sell limits/ orders places

SHORT ON GAChanged opinion on GA, upon further analysis the trend shows bearish motion
stop hunts taken after the X symbol heading to break the lows created, possible buys to the area of interest then we sell
Placed a very tight sl of about 10 pips to give me a trade with an over 1;20 rr

LONG ON GAsimilar to the schematic i always use, always looking for a valid Stop hunt this side being on the SSL side which fueled the initial move to break the last high.
This left us with a high probability blueprint of where exactly higher or bigger institutions entered the market.
decent 1;12 rr trade, black line below liquidity was a regular entry but i prefer a more defined OB thus i am entering much lower
Lets wait and see how the trade runs out

XAUUSD – 11/12: After major news, only trade at liquidity zones XAUUSD – 11/12: After major news, only trade at liquidity zones
Yesterday brought significant market news, so today’s price action lacks a clear trend.
In this environment, I avoid guessing direction and focus solely on two potential liquidity areas:
Sell timing zone near 4.219
Buy OB zone at 4.197–4.194
Asian session pressure favoured sellers, but the higher-timeframe trend remains intact.
Thus, the plan is simple: short-term sells, buy at good support, no one-sided positions.
🎯 Scenario 1 – Timing SELL at 4.219 (experienced traders only)
Sell zone: around 4.219
Note: This is a timing execution, NOT a pre-set limit order.
Acceptable deviation: ~2 points.
If ideal timing is 4.219 but you only see price after it reaches 4.221 → skip it.
TP guide: at least 15 points, e.g. 4.204–4.203.
Idea:
4.219 is an upper liquidity pocket where many FOMO buys accumulate.
If price sweeps this area and weakens, I take a short sell in line with the Asian session bias — purely intraday.
⭐️ Scenario 2 – BUY at OB 4.197–4.194
Buy zone: 4.197 – 4.194
Setup invalid below: 4.191
TP: +15 points or more, e.g. 4.209–4.212.
Reasoning:
This OB zone previously generated strong upside movement, indicating institutional interest.
If price revisits and shows bullish reaction, it becomes a high-R:R buy opportunity.
1️⃣ Fundamentals & market psychology
After an extended rally, gold bulls are becoming cautious due to uncertainty over how quickly the Fed will ease in 2025.
Cuts are expected — the question is how fast and how often.
This puts gold into a choppy, range-bound phase instead of a clean breakout environment.
So today, instead of trend-trading, I prefer reading liquidity levels and reacting to price behaviour.
2️⃣ Plan & discipline
No trades in the messy 4.20x zone.
Execute only at:
Timing Sell 4.219 (±2 points)
Buy OB 4.197–4.194 (void below 4.191)
Risk per trade: 1–2% max, no holding when invalid.
If price breaks both zones and trends strongly, I step aside and wait for new structure.
👉 Above 4.219 → only SELL timing
👉 Into 4.197–4.194 → only BUY
👉 Below 4.191 → buy setup invalid

XAUUSD – LANA PREFERS BUYING AFTER THE ABC CORRECTION...XAUUSD – LANA PREFERS BUYING AFTER THE ABC CORRECTION COMPLETES (H1)
1. Fundamental Analysis
While Trump draws attention with his “Gold Card” idea worth up to $1 million, the more meaningful story is the continuous flow of capital into gold as a safe-haven and long-term accumulation asset.
Bank of America believes gold remains in a long-term uptrend and is even “under-owned”, projecting that prices could reach $5,000/oz by 2026 if investment demand increases.
Given this backdrop, Lana maintains her view: current pullbacks on H1 are opportunities to look for trend-following buy setups rather than rushing to sell against the major uptrend.
2. Technical Analysis (H1)
On H1, the ABC corrective structure has completed, and price has bounced precisely from the rising trendline — showing buyers are still defending the trend.
The recent bullish leg is retracing to retest:
Fibonacci 0.382 — aligned with a short-term support area.
Fibonacci 0.236 — closer to the rising trendline, forming a strong confluence zone for buying.
Upper resistance remains around the previous high and the major trendline above, but for now, Lana focuses on waiting for price to pull back into the Fibo + trendline zones before expecting the next bullish wave.
3. Key Levels to Watch
Buy scalping zone (Fibo 0.382 + support): 4205 – 4207
Deeper buy zone (Fibo 0.236 + trendline): 4196 – 4198
Technical SL:
Below 4200 for the upper setup
Below 4190 for the lower setup
4. Trade Scenarios
⭐ Scenario 1 – Buy at Fibo 0.382 + support
Buy: 4205 – 4207
SL: 4200
TP: Depending on preference, target the recent highs around 423x–425x.
⭐ Scenario 2 – Buy at Fibo 0.236 + trendline
Buy: 4196 – 4198
SL: 4190
TP: Same idea; prioritise partial profit-taking as price moves back into upper resistance.
Lana will wait for price to retrace into one of these two areas before considering an entry, avoiding FOMO buys while candles are moving aggressively.
👉 Follow Lana on TradingView to receive gold updates early. 💛

Gold intra-day selling opportunity showed after Fibo & OB bounceXAUUSD (Gold/US Dollar).
Timeframe: 15-minute chart (15m).
Trend Context: The price experienced several increase and decrease but made an imbalance on 1H timeframe yesterday, and it's probably going to decline till closing the FVG on 1h.
There is a major ascending orange trendline acting as dynamic support. The price recently tapped this line and bounced, creating the current upward retracement, but in the last 4 hours, it is showing a probability to break this line down.
I see what I see depending on several reasons:
1. ChoCh (Change of Character) indicating a structural shift that often precedes a retracement or reversal.
2. Fibonacci & Key Levels
The price is trying to bounce back from the golden area of the recent bearish swing (high to low)
0.5 Level (Equilibrium): Located at 4203.330. The price is currently testing this area.
0.618 Level (Golden Zone): Located at 4206.995. This level acts as strong resistance and aligns with the entry zone.
3. Trade Setup (Short/Sell Idea)
The setup is a bearish continuation play, looking to short the market as it retraces into a supply zone.
The entry is just before the OB on 15 min
The target is set near the recent swing low, anticipating that the price will reject the Order Block and fall back down.
⚠️ Note
This is a technical outlook based on my POV to the chart. Always manage risk carefully and adapt if market conditions change
I would be grateful to get your feedback on this idea if you have any opinions to share.
✽ Improve your awareness to seek a great analysis ✔
@AbdullahTech ♾

Gold 1H – Will 4232 Liquidity Trigger Reversal or 4188 Hold Flow🟡 XAUUSD – Intraday Smart Money Plan | by Ryan_TitanTrader (10/12)
📈 Market Context
Gold trades inside a politically-driven liquidity landscape after former U.S. President Donald Trump signaled that rate-cut willingness will be his litmus test for selecting a new Fed Chair.
This comment injects uncertainty into interest-rate expectations, making markets sensitive to any shifts in forward guidance.
Higher-for-longer fears remain intact intraday, keeping gold capped below premium zones while liquidity builds on both edges.
On H1, price is compressing around mid-range with clean liquidity resting at 4232 above and 4188–4190 below—ideal sweep conditions before institutions commit to direction.
🔎 Technical Framework – Smart Money Structure (1H)
Current Phase: Sideways compression after BOS + CHoCH sequence
Key Idea: Expect a sweep above 4230–4232 or below 4190–4188 before true displacement
Liquidity Zones & Triggers:
• 🔴 SELL GOLD 4230 – 4232 | SL 4240
• 🟢 BUY GOLD 4190 – 4188 | SL 4180
Institutional Flow Expectation:
sweep → MSS/CHoCH → BOS → displacement → FVG/OB retest → expansion
🎯 Execution Rules (matching your exact zones)
🔴 SELL GOLD 4230 – 4232 | SL 4240
Rules:
✔ Price sweeps the liquidity cluster above 4230
✔ Bearish MSS/CHoCH on M5–M15
✔ Downside BOS + clean bearish displacement
✔ Entry via FVG refill or refined OB retest
Targets:
1. 4212
2. 4200
3. 4190
🟢 BUY GOLD 4190 – 4188 | SL 4180
Rules:
✔ Liquidity grab under 4190–4188
✔ Bullish MSS/CHoCH confirms demand takeover
✔ Upside BOS + impulsive displacement from discount
✔ Entry via bullish FVG fill or demand OB retest
Targets:
1. 4205
2. 4220
3. 4230–4232
⚠️ Risk Notes
• Trump’s remarks may spark abrupt shifts in expectations → avoid entries without BOS + displacement
• Don’t chase candles inside the compression channel
• SL placement must respect structural invalidation
• Reduce exposure if volatility spikes during Fed-related headlines
📍 Summary
Today’s play revolves around two liquidity-driven scenarios:
• A 4232 sweep triggers bearish structure, delivering into 4200 → 4190
or
• A 4188 liquidity grab forms bullish MSS, expanding toward 4220 → 4232
Let structure confirm—SMC is reaction, not prediction. ⚡️
📌 Follow @Ryan_TitanTrader for more Smart Money breakdowns.

Possible long on GUSell side liquidity taken in order to force a break of structure.
this Stop Hunt gives a blueprint of where instituitions entered the market after collecting sell order and stop losses on buys(sell side liquidity).
Using this knowledge i have set pedning buy orders targeting the last major high, analysis done using H4 and H2 timeframes

XAUUSD – The 4.221 Zone Determines Direction Ahead of Fed ...XAUUSD – The 4.221 Zone Determines Direction Ahead of Fed
From my perspective, gold on 10/12 is in a "waiting to choose direction" phase:
The price is caught between the resistance zone of 4.221–4.239 and strong support at 4.166.
On the 45m chart, the current structure is a sideways top, following the previous upward move.
In the context of the Fed about to announce interest rates, I won't guess but will closely follow these two zones to make decisions.
🎯 Important Technical Zones
Main Resistance:
4.221 – 4.225: Fibo zone 0.236–0.382 and thick volume cluster.
4.239: extended resistance peak – if broken, the target is the 4.25x zone.
Strong Support:
4.166: "Strong support" zone on the chart – current range bottom.
Below 4.166, the 4.12x zone is the extended Fibo 1.618, where liquidity might be attracted if the market sells off deeply.
📌 Scenario 1 – Continued Uptrend (preferred if holding above 4.200)
If the price:
Holds firmly above 4.200,
Clearly breaks the 4.221–4.225 zone and closes a 45m candle above,
I will consider this a confirmation signal that buyers are regaining control.
Trading reference:
Buy when the price breaks & retests 4.221–4.225.
Temporary SL set below 4.210.
TP: 4.245 – 4.258 – 4.270.
As long as gold stands above 4.200, I prioritize the scenario of maintaining a bullish bias, viewing any pullback to 4.20x as a buying opportunity.
📌 Scenario 2 – Short-term Sell within the Range
If the price fails to break 4.221–4.239, leaving a cluster of pin candles with small bodies, I consider this a signal of exhaustion at the resistance zone:
Sell around 4.221–4.225 (up to 4.239 if there's a spike).
SL above 4.239.
TP: 4.190 – 4.176 – 4.166, deeper to 4.130 if selling pressure increases strongly.
This scenario is for short-term scalping/swing, going against the medium-term bullish bias, so volume must be tightly controlled.
1️⃣ Basic Context: Everyone Awaits the Fed
USD/CHF is trading steadily around 0.8060, reflecting the FX market's wait-and-see stance ahead of the Fed's decision.
Investors don't want to bet too heavily in one direction before the news, so gold tends to fluctuate within the range rather than breaking out immediately.
When the Fed announces interest rates and guidance, gold's volatility range can expand very quickly, sweeping through both resistance and support zones.
Therefore, I don't recommend entering large volume orders right before the Fed. The priority is to read price reactions at the 4.221 and 4.166 zones, then decide whether to increase or decrease positions.
2️⃣ My Plan
Above 4.221, holding price well: prioritize buying scenario on break, targeting 4.25x.
Failing to break 4.221, weak candles: consider short selling to 4.19x – 4.166.
If the price falls straight below 4.166, I will temporarily stay out, waiting for the market to create a new balance zone before planning further.
Each trade risks a maximum of 1–2% of the account, no widening SL during strong news phases.
If you find this perspective useful, follow the TradingView channel and leave a comment on whether you lean towards breaking above 4.221 or turning back from resistance – let's update after the Fed news.

XAUUSD – LANA MONITORS SUPPORT 4190–4199 BEFORE FED RATE CUT XAUUSD – LANA MONITORS SUPPORT 4190–4199 BEFORE FED RATE CUT
Fundamental Analysis
In the past year, Silver has increased by ~82%, Gold by ~58% – indicating that capital flow still favors the precious metals group.
The market is pricing in ~97% probability that the Fed will cut rates by 25bps tomorrow, which is a supportive factor for gold in the medium term as yields decrease and the opportunity cost of holding gold is lower.
However, before the announcement, prices often fluctuate around short-term support – resistance zones, so Lana prioritizes trading based on technical price zones on M30.
Technical Analysis (M30 – support/resistance)
For gold to decline further, the nearest bottom around 4199 needs to be clearly broken.
Currently, the price is reacting around 4190, which is an important support zone: As long as this zone is not broken, gold still has the potential to rebound within the range.
Above is the resistance zone 4235–4238, coinciding with the previous FVG/resistance zone on the chart – suitable for watching to Sell if the price retraces.
Below, the 4164–4167 zone is the next support, also where Lana marks Buy scalping when the price sharply declines.
In summary: As long as the support is not completely broken, Lana still prioritizes Buying at the support zone.
The Sell scenario is only activated when the price retraces to a higher resistance zone.
Price Zones to Watch
Important Support: 4199 – 4190 (nearest bottom & short-term support)
4164 – 4167 (next Buy zone)
Resistance / Sell Watch Zone: 4235 – 4238
Trading Scenarios
⭐️ Scenario 1 – Sell at Resistance
Sell: 4235 – 4238
SL: 4243
TP: 4222 – 4205 – 4190
⭐️ Scenario 2 – Buy at Support
Buy: 4164 – 4167
SL: 4159
TP: 4182 – 4202 – 4225
👉 Follow Lana on TradingView for the earliest gold updates
