Selling Snap into swing highs.Snap - Intraday - We look to Sell at 12.71 (stop at 13.91)
Price action continues to trade around the all-time lows.
Price action continued to range between key support & resistance (10.00 - 12.80) and we expect this to continue.
The bias is to break to the downside.
Daily signals are bearish.
We look for a temporary move higher.
The primary trend remains bearish.
This stock has seen poor sales growth.
Our profit targets will be 10.04 and 9.04
Resistance: 10.80 / 11.30 / 12.00
Support: 10.00 / 9.50 / 9.00
Disclaimer – Saxo Bank Group.
Please be reminded – you alone are responsible for your trading – both gains and losses. There is a very high degree of risk involved in trading. The technical analysis , like any and all indicators, strategies, columns, articles and other features accessible on/though this site (including those from Signal Centre) are for informational purposes only and should not be construed as investment advice by you. Such technical analysis are believed to be obtained from sources believed to be reliable, but not warrant their respective completeness or accuracy, or warrant any results from the use of the information. Your use of the technical analysis , as would also your use of any and all mentioned indicators, strategies, columns, articles and all other features, is entirely at your own risk and it is your sole responsibility to evaluate the accuracy, completeness and usefulness (including suitability) of the information. You should assess the risk of any trade with your financial adviser and make your own independent decision(s) regarding any tradable products which may be the subject matter of the technical analysis or any of the said indicators, strategies, columns, articles and all other features.
Please also be reminded that if despite the above, any of the said technical analysis (or any of the said indicators, strategies, columns, articles and other features accessible on/through this site) is found to be advisory or a recommendation; and not merely informational in nature, the same is in any event provided with the intention of being for general circulation and availability only. As such it is not intended to and does not form part of any offer or recommendation directed at you specifically, or have any regard to the investment objectives, financial situation or needs of yourself or any other specific person. Before committing to a trade or investment therefore, please seek advice from a financial or other professional adviser regarding the suitability of the product for you and (where available) read the relevant product offer/description documents, including the risk disclosures. If you do not wish to seek such financial advice, please still exercise your mind and consider carefully whether the product is suitable for you because you alone remain responsible for your trading – both gains and losses.
Snap

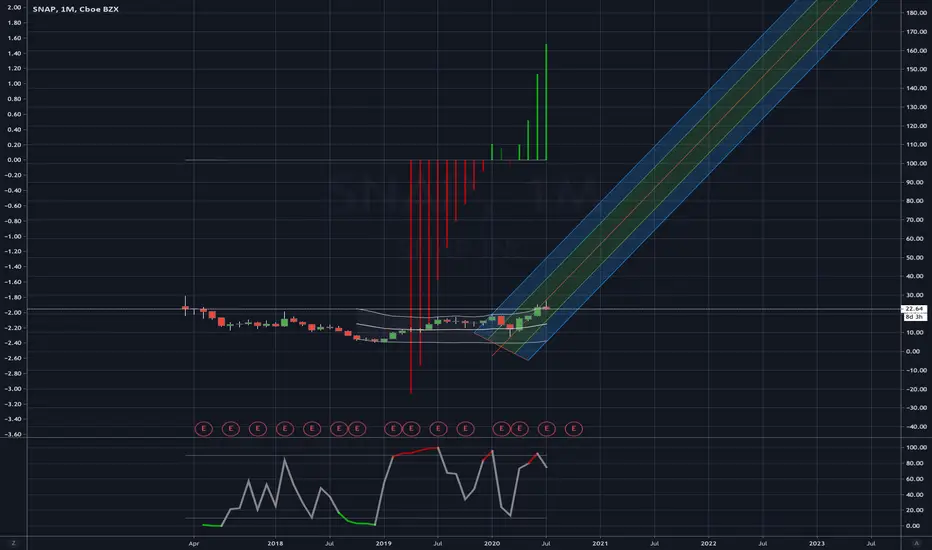
SNAP LongBuckle up, SNAP's run is just getting started and will last multiple years.
Looking towards $100+ over the next 24-32mo.
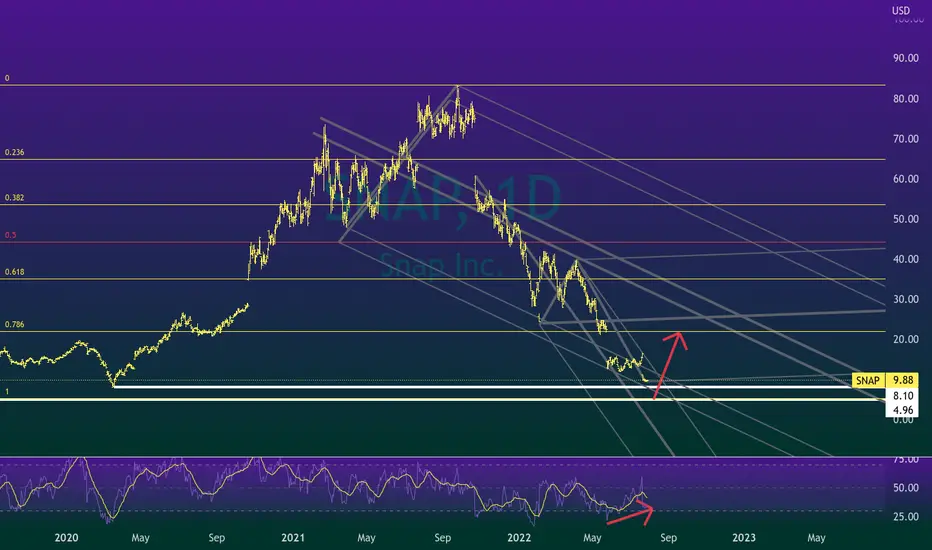
That Snapback - SNAPMeta looks ready to rally and Snap maybe even more so, Sitting here with daily bull divergence at strong support. Target would be around 20-22 from here. I'll add some to my cash accounts. Stop would be 9 dollars.
Social media stocks look ready to bounce, no idea what the reason will be. I guess we'll see if that's true soon. Good luck!

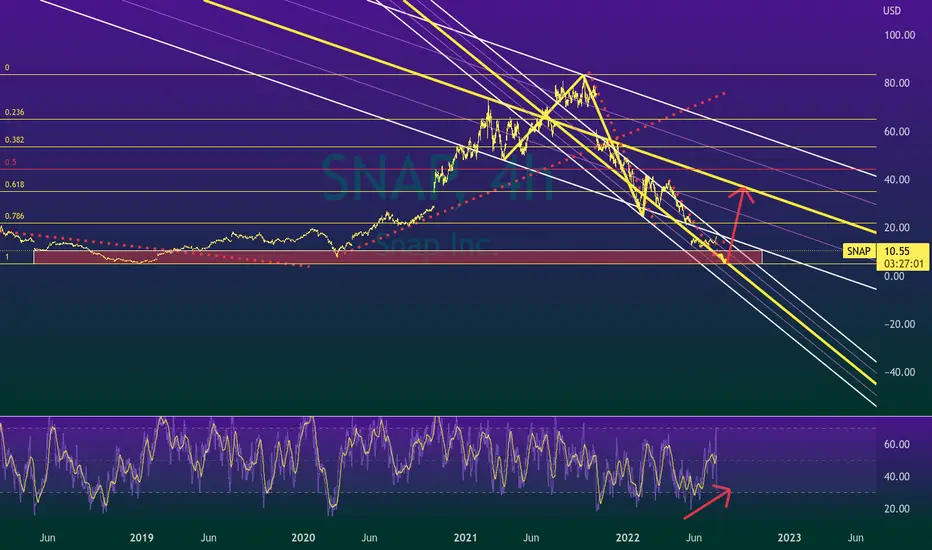
The Meta Beta - MetaStill looks good for META here and SNAP as well. Markets need to rally from here, but even if the markets are weak, META and other beaten down tech may bounce anyway. Weekly bull divergence should not be ignored, also holding trend (see below) from previous falling wedge structure.

SNAP buying volumeBuy low sell high. Seems like others might be doing the same. REALLY intrigued to see if SNAP will make it out of the 80% hole that it's in from the selling.

snap stock update after up almost 10% today #snap $snap Snap had a monster day after CEO made positive comments. Snap is still massively oversold from its all time highs, but still slightly expensive for its earnings expectations.

$snap could go lower to $5 before growing 800% in next years?Lower before going higher? Thats what Im trying to figure out. Snap has growth going forward in the next years according to analysts. Its just this inconvenient thing called the rest of the economy. Advertisers are cutting back this year. How long will that continue for? And what will the fair price for snap as a company be then? Im a fan of this company for the next decade. It just has to endure the correction slow down me thinks.

SNAP target 16 then 5 then bull runSNAP could be correcting to all time low before the bull run
Buy in October at 5

WIX -WW- Potential Dual BreakoutNASDAQ:WIX
-------
All,
Been AFK for quite a while didn't trade much since December just converted to cash after a few medium L's around Jan.
**I think an obvious disclaimer here is this is contingent on the market/war/fed data not being bad after this. Too fragile right now.
On this one I think we have a really good Supply/Demand area and possible breakout. Pretty decent fundamentals overall. I would be looking mainly for an options play w/ cover or just stock.
OPTION #1 --- BREAKOUT
**Only would take trade on retest of breakout.
Target 1: 110
Target 2: 122
Target 3: 134 unlikely without news/huge market news.
OPTION #2 --- WEDGE PLAY
Assuming breakout fails and it may. I am going to most likely buy the bottom of the wedge/triangle seeing as its a pretty great spot for demand.

TWTR UPTRENDING DESPITE EARININGSNYSE:TWTR
has been running for 4 weeks with a RSI now over 80%
By comparison, META is sideways.
Musk just liquidated $6B in TSLA to fund a contingency
in case the court forces the contract to purchase at $54.20
www.cnbc.com
This may cause buying pressure at the present price
far below the contract price. Potentially a short
squeeze could augment the price action.
This may be a good time for a long entry on TWTR.

SNAP - Bullish divergenceMkt cap $16.8B
Bullish divergence
Price $10.10 (AH 08.09.2022)
Target $13.79
Stop loss $9.34
IMO

$SNAP -85% DISCOUNT!Snap has been getting killed since Sept. '21, if you believe in this stock long term, the buy area is $5-$8 is a great area build from!

Rhythm is a dancerSNAP long downside is to 8 bucks upside is to 20
We have some bull div building
It's unlikely to go much lower than 8
First upside target is 20
I don't think 50 is impossible
GRI 2022
NOT TARDING ADVICE
$SNAP Long TradeHolding monthly VWAP's lower standard deviation band...monthly VWAP sitting at $11.71 currently. Big earnings tonight from %AAPL and $AMZN which could definitely change this in a hurry but for now, as long as we see the lower band hold at $9.48+ then over the next week or two could see a squeeze up to mid $11s before retracing lower trying to find more support.
Zooming out on the weekly chart Century VWAP's lower standard deviation band rests at $6.85 which granting a failure and rejection around $11 I would expect to eventually fall to that level to test the lower band.
For reference each level of century VWAP has served as an important support area since the beginning of this years fall ($43 and $25 +1 STDV band and Century VWAP respectively).
Good luck traders/investors.

SNAP rebound playSnapchat has fallen 38% on its earnings report. I am going long here with the idea of a rebound to previous support level at 12.0
Entry: 10.0
Stop: 9.5
Target: 12.0

SNAP/USD 900% Potential in Long term But -30% more dip possible #Snap/USD Technical GAP Chart Analysis:-
$SNAP currently trading around $10 which is -38% Down in past 24 hours.
It’s very Big Dump in stock Market.
And $SNAP already -88% down from Recent All time High within 10 Months.
It’s also Bear Market for $SNAP Chat.
As Per GAP Chart Majorities all GAP has been Full filled but 3 GAP still pending.
2 GAPs are Upper side and One GAP is Down side.
Upper side GAP = $21.71 & 73.89
Down side GAP = $7.05
So IMO $SNAP may test $7.05 level which is Another-30% from current price Level.
But this is also Best Price to start Accumulation for Long Term.
Accumulation Zone:- $7-$10
Targets:- $21/$40/$55/$73
$SNAPAll Time Low Price is = $4.82
Below this Price we can see free fall and Exit Point also if Price down from $4.82
Risk and Reward both are High…
Reward = 9x
Please Like and Share

Buying The Snap (SNAP) GAPYesterday, SNAP posted a negative earnings report that missed both the top and bottom lines. The overnight was devastating, as SNAP surrendered more than 30% of its marketshare.
Now, there is a key area in view:
GAP, $11.90-$11.11
Here's the trade:
1) Ahead of today's close, buy from $10.00
2) Profit target @ $11:50 within the GAP
3) Stop Loss beneath today's low @ close
This trade is a bit risky and requires holding over the weekend. However, given the selloff, we are likely to see a test of the GAP early next week.

SNAP this upHad to go down to low tfs but if u look left we clearly in a buy zone
More down before up tho probs
GRI 2022
Forks, pivots, fibs
SNAP Gap fillSNAP is entering a gap fill area.
Could see $20 very quickly.
Does report earnings tonight, so gotta be careful
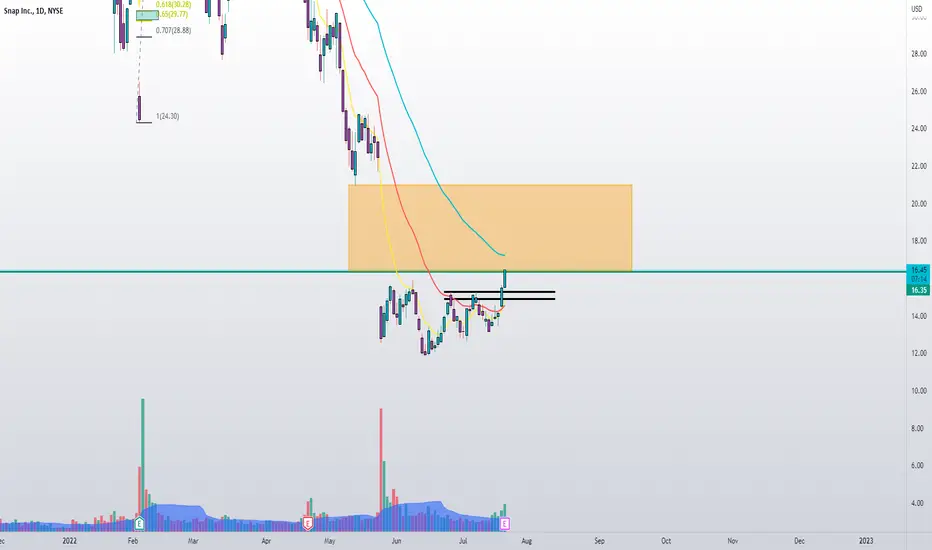
$SNAP Setting up nicely for earnings tonight$SNAP is hovering at the bottom end of its last quarter earning gap. Good numbers can easily see the gap being filled towards $21 area. On the downside the previous low of $12 will be key level

PINS close to breaking outPINS is so close to breakout. With SNAP ER on Thursday, PINS can be a sympathy play.
Can take JUL 29 22C. If we get a good push before SNAP ER, try selling half and riding other half into ER.
PT’s : 22, 23.06, 24.10

SNAP options ahead of EarningsLooking at the options chain today, i would buy the $15 calls with
2022-11-18 expiration date for about
$2.55 premium.
Looking forward to read your opinion about it.

SNAP time to buyafter a downtrend we had a breakout of the ''VWAP'' and the ''Trendline'' which indicates a return of an uptrend
