SOXL / SMH - CREATING A BULLISH REVERSALBACKGROUND:
SOXL (3x ETF) created a great reversal pattern back in JUNE - JULY 2022. It's tempting to ignore it because it ultimately failed on 8/26/22. Nonetheless, it was a great technical entry point when the price broke above $17.
CURRENT PRICE ACTION:
The reason I'm pointing out what happened in JUNE - JULY is because SOXL ETF is forming another BULLISH reversal (early stage) having just passed above last Friday's (9/30) high and entering back into the $9.50 - $10.50 range. The two previous reversals (8/26, 9/13) had failed. Yet the job of a trader is to not HOPE or PREDICT, but rather TRADE the signals and MANAGE RISK ACCORDINGLY .
GAMEPLAN:
I'm watching if the price closes above $10.35 (approx.) within the next few days. I'm anticipating some price action around this level. Any close above $10.35 can follow with some pullback. In fact this is a GREAT entry point for the bears if we were to follow trend alone. However, the reversal that happened from $9.50 and the bounce that's happening on the NASDAQ (potential double bottom) can signal a potential reversal in the market (short-term).
There are two potential bullish reversal scenarios:
1. Straight up(rare)
2. Chop sideways and build a larger reversal base (as happened in JUNE - JULY)
LOOK-OUT FOR:
What comes out of the FED emergency meeting. As mentioned in my previous post on the status of the DOW JONES - I think the analysts at the FED see the same. The FED will either blink and change its' stance or the market is taking another big leg down...
Be safe all and thank you for reading.
SOXX

SOXX 2D: WHERE ARE SEMI'S HEADED?SOXX, 2D: Taking a look at the SOXX 2D chart I have drawn out a linear regression channel beginning on November 12, 2021 which was about 7 weeks prior to the ATH print at 557.12 on January 3, 2022. The SOXX proceeded to decline approximately 41% from ATH (557.10) down to its recent low at 326.70 on July 1st, 2022 before rallying almost 30% off the floor to 424.78. So, where are we now, and where are we going next?
Linear Regression: The linear regression channel in the chart is divided up by color and is illustrative of 6 standard deviations of potential price action expressing a 6 sigma potential linear range of 435.18 – 279.37 with the high confidence interval range (+-2SD) from 408.93 to 305.61. Our linear mean is currently sitting at 356.78 with a Pearson’s R^2 indicating a high central tendency at 0.894. the linear mean and is currently expressing a potential linear range of 435.51 (+3SD, red) to 308.20 (-2SD, blue). As we can see the recent rally is filling out the upper end of the linear range, clearly pushing deeply into the upper 3rd standard deviation range off the linear mean. Using central tendency as an approximation of trend strength there is a high potential for price to mean revert down to the 356.78 price region.
Fibonacci Retracements: I have left the Fibonacci Retracements up in the background and have also added white lines to mark the significant levels of 0, 0.5, and 1 retracement respectively. Despite the overextended nature of the recent rally, price failed to breach the 0.5 Retrace at 441.91 which would have gone a long way to indicate a high potential for the lows to be in. It is important to note that if price were to breach the 0.5 retrace to the upside it would reduce the probability for lower lows this year but would not eliminate them entirely.
Elliot Wave: It is my position that we are in the 5th wave down from the ATH as illustrated by the yellow EWT count on the chart. Given the somewhat unruly nature of 5th waves and their increased potential for irrational behavior, we will leave some grace with regard to our expected landing zone. It is my prediction that we will bottom out somewhere in the 334-303 range as illustrated in the yellow, square box. This thesis is in confluence with market trends during mid term election years in the month of September, which is that they have a tendency to decline through the month of September and early October before rallying into the late fall/winter after the election.
EMA Envelope: Our EMA envelope (top box), is a trend based EMA indicator based on the last 40 days. The envelope turned bearish(red) with a body close below the 387.12 price point and would turn bullish (green) if price were to bounce back up over the 405.83 price point. Signal is currently residing in the neutral zone as indicated by the yellow in the top box.
VFI (Volume Flow Index): Our volume flow index is a fixed range cumulative indicator based on the last 130 periods, which on a 2day time frame spans the last 260 days. As we can see the green line representing the volume flow is crossing over its moving average to the downside. Please also see that our VFI signal also failed to breach the zero and has not risen above the zero line since the late March rally.
RSI: Our RSI is sourcing data using a hlcc range configuration to add data point density to the measurement and potentially at the sacrifice of a more discerning measurement that might come from using a close only price range configuration. What we see is our RSI signal currently entering the bearish end of its range (<45).
MACD-X: Our MACD indicator is showing our lag differential (12-26) crossing over our 9 period ema to the downside and beginning to print its first few bars of negative trend coming off the recent rally which began at the beginning of July for the SOXX ETF.
SUMMARY: We have moving average trends rolling over to neutral from being recently bullish, volume flows that have been trending upward recently but not at levels supportive of 2021 price levels, an RSI that never hit overbought and has since reverted back to its median and a MACD beginning to indicate the potential for a downward trend to emerge.
What the above summary of indicators appears to be from my perspective is an upward retracement within a larger downward trend, or what is more commonly known as a “bear market rally”. It is my position that price will decline to its linear mean at 356.78 before making a decision of whether to spill further or consolidate in a range bound, downward trending diagonal. Until fundamental headwinds provide a better catalyst for the technicals to improve going into the late fall/early winter it would not be unreasonable to expect further downside volatility.

large cap semiconductors carrying market lower or highernasdaq us large cap semiconductors are carrying big tech right now. if they drag the market lower im bearish on the broader market. if we bounce in this group especially NVDA and AMD i think were headed for a test of the weekly lower high around 5500 translating to a $15 SOXL. if we bearflag, and head lower id imagine were in for much more of a drop. the pivot is dashed and upper/lower horizontals are solid lines. the extended line rising is the recent low linked to the all time low. if we break below this range its bearish for SOXL and the market in general.

SOXL reversal from bottom LONGAMEX:SOXL
On a 30-minute chart SOXL, a triple leveraged bull ETF for semiconductors is now in an early uptrend.
The semiconductor sector may be challenged but stable economics from its industrial customer bases may be
steadily rising.
The chart shows recent horizontal resistances from pivot points and an overlaid volume profile.
For the long trade, I will set a stop loss for a 3% risk while setting targets of $15.85 , below the Fib 0.5
$ 16.8 below the top of the high volume area of the profile and final take profit at $21.3 just below
the double top of August 5th and 12th. With tiered take profits, this looks to be about 30% upside
overall with a very safe ratio of risk especially if the stop loss is raised above the entry on the first leg
of the uptrend.

AMD Ppotential inverse head and shoulder Potential inverse head and shoulder
MA 50D Support at bottom

Is AMD due for a correction?NASDAQ:AMD
AMD had a good run into the earnings season however
news is that with the expected or present recession
semiconductors as a subsector will fall a bit heading
into the third quarter.
The chart shows buy order blocks as a support are
far less than sell order blocks.
The MACD , a lagging indicator, shows the K/D
lines crossing over the histogram.
My idea is to take a call option contract for
a strike 5% below the present price.
Setting a stop loss at 10% of the option price
taking profit when the AMD stock approaches
above the closest buy order block at about
$ 98.45.
Do you have call options to suggest?

Strong Buy AVGO:547.27We consider a strong buy for Broadcom Inc, rating the company as the absolute leader in semiconductors

A PERFECT STORM! 🐰Hi there, Yurii Domaranskyi here.
Risk vs Reward = 1 to 32.31 ✨
It means if you risk here 100$ you may make 3231$ Not bad, huh?

3/27/22 GFSGlobalFoundries Inc. ( NASDAQ:GFS )
Sector: Electronic Technology (Semiconductors)
Market Capitalization: $42.208B
Current Price: $78.94
Breakout Price (hold above): $77.05
Buy Zone (Top/Bottom Range): $74.35-$67.40
Price Target: $90.20-$91.60
Estimated Duration to Target: 40-43d
Contract of Interest: $GFS 5/20/22 80c
Trade price as of publish date: $7.80/contract

3/27/22 MRVLMarvell Technology, Inc. ( NASDAQ:MRVL )
Sector: Electronic Technology (Semiconductors)
Market Capitalization: $63.051B
Current Price: $74.37
Breakout Price: $75.15
Buy Zone (Top/Bottom Range): $71.80-$65.10
Price Target: $79.80-$80.80 (1st), $86.20-$88.00 (2nd)
Estimated Duration to Target: 30-32d (1st), 58-62d (2nd)
Contract of Interest: $MRVL 4/14/22 75c, $MRVL 5/20/22 80c,
Trade price as of publish date: $2.80/contract, $3.05/contract

3/27/22 NVDANVDA Corporation ( NASDAQ:NVDA )
Sector: Electronic Technology (Semiconductors)
Market Capitalization: $695.069B
Current Price: $276.92
Breakout price: $283.50
Buy Zone (Top/Bottom Range): $261.80-$240.50
Price Target: $314.80-$316.90
Estimated Duration to Target: 54-62d
Contract of Interest: $NVDA 5/20/22 300c
Trade price as of publish date: $11.65/contract

$SOXX SEMI CONDUCTOR STRENGHT WILL NOT BE DENIEDI like the setup I am seeing for resolution to the upside for semi-conductors here. I do have one concern but I'll address that shortly.
On the left is a weekly candle chart of SOXX the iShares semi-conductor ETF. The upward trendline from the covid-crash trough is firmly intact. The 100 Day EMA has proven to be key support. The index started consolidating the second week of November after a 10% move up the previous week. The index has been in that consolidation period ever since - perfectly normal and healthy. During the consolidation phase a support level around $516 has been established. What I don't like are the upper wicks on the candles during this consolidation phase. It shows that prices have not been able to breakout to the upside despite trying to push higher. If your looking for an entry, either a level down closer to support or a close above the upper wicks would be a better spot then where the index currently sits.
I do believe that the current evidence points to a breakout of the consolidation. Here's my case:
1) The long term uptrend is firmly intact.
2) Consolidations are continuation patterns.
3) Relative strength to the broader index (soxx/spy) is testing a breakout level after forming a deep base that goes back nearly a year.
4) After a tough chop-filled week in the markets XLK showed relative strength to SPY on Friday's close. The majority of the names in the XLK that outperformed it's sector were semi-conductor names.
5) XLK/SPY showed a move higher before getting to previous support - relative strength improving due to semi-conductor names in the XLK.
Links to my watchlists:
SPY Sectors - www.tradingview.com
XLK Holdings - www.tradingview.com
SOXX Holdings - www.tradingview.com
Toggle by change% and everything above the index ticker outperformed for the day.

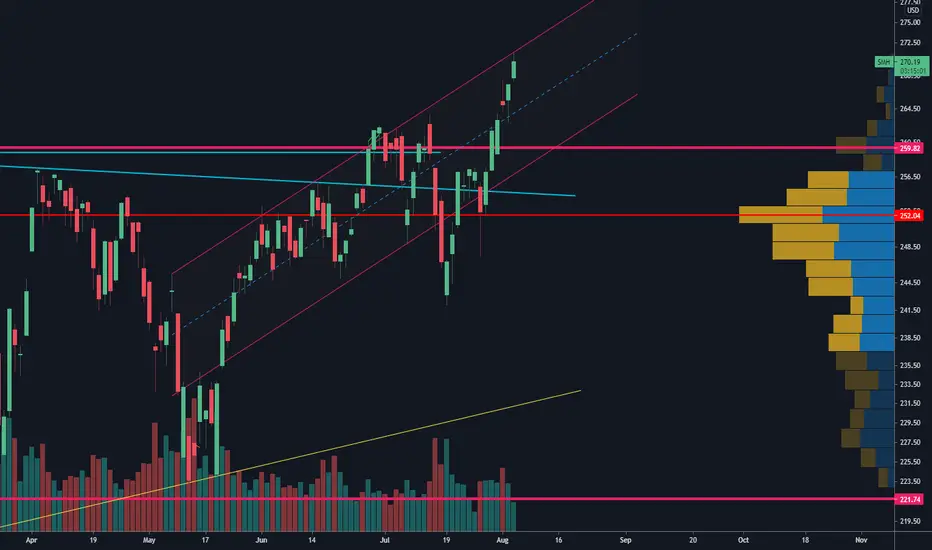
SMH AKA SOX TARGET 5 OF 5 OF 3 283/290 Look for an issue at 267.60 after that 270.6 then NO ISSUES TILL 283 TO 290 WAVE 5 OF 5 OF 3

Semiconductor shortBearish rising wedge daily chart has broken down recently and back testing the trend line. Objective short entrance. Negative divergent continue to grow on both RSI and PPO.


Semi's are showing exhaustionSemiconductors reached peak bulltard due to shortages. The uptrend started back in 2013 and was barely affected by covid. At the peak it was 40% above the weekly kijun. Interesting to see what happens. The next big short or just an expected correction?

SOXX 1 year trendSemiconductors/chips continue to be an essential part of everything around the globe.
For a year, we have maintained an upward trend, which is being tested today.
There are clear outperformers in the industry, but it is clearly been working for all of them as a whole.
When we have touched the trend line in the past, we have had a 50 point gain, which has happened through 2 weeks approximately. That gives us a target of around $505.

MU - consolidating , possible falling wedge pattern Micron looks to be consolidating on the daily chart heading into earnings Tuesday after market. The POC - (point of control) could be target $80, after earnings with 8% move expected.
The Oct 1st options data shows a put/call ratio at .55 . The Oct 15th $75 and $80 calls have over 28000 Open interest.
Looking to go long breaking above $75

$KLIC $KLIC BOOM!?: Running w/ the semisSMH hitting a nice pivot today, most names look like they have blue sky territory like NVDA, MXL, ASML and now possibly KLIC? Sitting in the mid cap range, the market could see this semiconductor as the sweet spot given the Fed rate environment

SMH - To short or to press - This is the Question..Top of the ascending channel.. Doesn't mean it won't overshoot but I like the probability here..
(Opinion Only)
Micron internals improvingTechnical Analysis
From the beginning of May, MU has been kept in a range; however:
RSI has been making higher lows where price has been retreating at the same support level.
OBV is confirming the uptrend in volume within the consolidation range.
These two bullet points support a bullish case for MU.
Trade analysis
I expect MU will try to test the roof of the consolidation range at $85.5 approximately; after, a re-test of the 50sma as support could signal a potential buy.

TSM breakout + measured move The chart shows a descending triangle, with a breakout.
The breakout yesterday and today, have been on strong intraday volume.
A measured move can be made by adding the height from the double bottom (purple circles), to the area of the breakout. Using the green arrows to represent the potential move, which takes us to $152 approximately. Which is coincident with the extended move of the fibonacci retracement lines at 61.8%.
$135 and $142 are potential resistance zones, where we could see some profit taking.

Copper Trend intactCopper has a strong uptrend with a stair-step behavior.
With pent-up demand for semi-conductors, copper mining has been increasing to help suppliers.
For in depth analysis, please check my last charts on CPER.
