XAUUSD Daily – Five-Wave Impulse Toward 4,530On the XAUUSD daily chart I’m tracking a potential five-wave advance within the existing uptrend.
Wave (1)** marks the initial impulsive leg higher from trendline support
Wave (2)** is the corrective pullback that holds above the origin of wave (1) and respects the rising trendline
Wave (3)** extends beyond the wave
(1) high, confirming continuation of the bullish structure and establishing a new swing high.
* Price is now correcting as **wave (4)** back into the area of:
* the rising trendline drawn from prior lows, and
* the former consolidation / breakout zone around the previous highs.
While price holds above the wave (4) low and the trendline, I’m anticipating a continuation leg to the upside as **wave (5)**.
The projected wave (5) objective is around 4,527, where I have a confluence of measured extension and overhead resistance.
A decisive daily close below the wave (4) low and trendline support would invalidate this wave count and delay the bullish scenario.
Sp!

S&P At The End Of The Trend?Seems like on the weekly and monthly charts, the S&P has completed a 5 wave Elliott which started in fall 2022, exactly 3 years ago. The indicators also seem getting weaker on both time frames. Probably there is a distribution going on. Everybody you see is talking about a recession in 2026, mostly towards the middle of the year and we will have a Christmas rally this year. Well, by now we have learned that if everybody is expecting something to happen, either it doesn’t happen or it happens earlier . We’ll see because nobody knows the future. Though, as I see, most people now are in the mood that every fall is a buying opportunity and “this time it’s different” with ai. So many cocky opinions flying around. Maybe this time it’s different but for now, I am thinking that we will have a 3 wave Elliott downwards. Actually, I didn’t like the sentiment that is going around. We’ll see if we will wear our shorts in winter.

S&P 500 ROAD TO 7000 $SPX1. Executive Summary:
Following a significant correction from the 5000 level, the S&P 500 showed initial signs of stabilization on April 7th, 2025. The index had previously been rejected from a major resistance zone near the psychologically significant 7000 mark, having peaked around 6900. The current technical structure suggests a period of consolidation or pullback is underway. Critical support is identified in a layered zone between 6600 and 6200. A key finding from Fibonacci retracement analysis indicates that a hold above the 0.236 level (6428.21) could provide the necessary momentum for a renewed bullish assault, with the ultimate objective of retesting and breaking the 7000 level.
2. Recent Price Action & Market Structure:
Bullish Regeneration (7th April): The price action on this date is technically significant as it represents the first meaningful attempt to "regain" footing after a sustained drop. This could indicate that the initial wave of selling has exhausted itself, allowing buyers to step in.
Key Resistance & Rejection: The prior rejection from the ~6900 zone is a pivotal event. The failure to break through 7000 created a clear ceiling, establishing this area as a major resistance level that the market must now overcome to resume a long-term bullish trend.
3. Support Zone & Fibonacci Analysis:
The market has defined a clear hierarchy of potential support levels that will be critical in determining the next major directional move.
Layered Support Levels:
Immediate Support (6600): This is the first line of defence for the bulls. A bounce from here would indicate underlying strength and suggest the pullback is shallow.
Primary Support (6400): This level converges closely with the key Fibonacci level and is therefore a high-priority zone for buyers.
Significant Support (6200): A breach below 6400 would make this the next critical floor. A hold here is essential to prevent a deeper correction.
Fibonacci Retracement Context:
The Fibonacci tool has been applied to the most relevant upward move (likely from the 5000 low to the 6900 high).
0.236 Fibonacci Level (6428.21): This level is critically important. It represents a shallow retracement of the prior uptrend. The fact that it aligns with the identified 6400 support zone adds significant technical confluence.
Bullish Implication: A successful "bounce" from this ~6400/6428 confluence zone would be a strongly bullish signal. It would indicate that the broader uptrend remains intact and that the drop from 6900 is merely a healthy correction within a larger bull market. This would be the confirmation needed to project a move back towards the 7000 resistance.
Deeper Retracement Scenario (0.382 at 6123.76): Should the 0.236 level fail, the next major support resides at the 0.382 Fib level (6123.76), which aligns with the 6200 support. A bounce from this deeper level would still be constructive but would indicate a longer and more significant period of consolidation before a new high can be attempted.
4. Synthesis and Forward Projection:
The technical picture presents two primary scenarios:
Bullish Scenario (High Probability if 6400 Holds): The index finds strong support at the 6400/6428 confluence zone. The bounce initiated on April 7th accelerates, pushing the price back through the 6600 level and setting the stage for a retest of the 6900-7000 resistance area. A breakout above 7000 would then open the door for further all-time highs.
Consolidation Scenario (If 6400 Breaks): A break below the 0.236 Fib support shifts focus to the 6200/6123 zone. The market would likely enter a longer period of range-bound trading between ~6100 and ~6800 before gathering enough momentum for its next sustained move.
Conclusion:
In summary, while the S&P 500 faces clear overhead resistance following its rejection near 7000, the pullback is currently testing a critical support confluence near 6400. The bullish thesis for a "bounce back to 7000" is technically valid, but it is entirely contingent upon the index defending the 0.236 Fibonacci retracement level (6428.21) and the 6400 support zone. A trader should watch for confirmed bullish reversal signals (e.g., strong bullish engulfing candles, positive RSI divergence) at this level as the potential trigger for the next leg up.

OEX /SPX Bullish wave 5 pattern crossroads The chart posted is the sp 100 I am posting it as we are now at the crossroad for bull or bear count .We have rallied to .786 as I will show and have a wave a x 1.27 = c at the .786 High But if we break above 5922 in the Cash SP 500 There is NOTHING to stop it from reaching a target of 3005 in the OEX where wave A up or wave 1 x 1.618 = wave C Top or wave 3 in the SP 500 WAVE A or WAVE 1 up 5481 - 4835 = 646 x 1.618 =1045 plus wave B low or wave 2 5102low= 5102plus 1045 =6147.22 The exact high . This is the reason I took the loss and moved LONG .Best of trades WAVETIMER

SPX500 Extends Rally on Fed Hopes and China Trade DealS&P 500 Set to Extend Record Highs
U.S. stock futures climbed on Friday, continuing this week’s strong momentum on hopes of eased trade tensions and growing confidence in multiple Fed rate cuts later this year.
Futures tied to the S&P 500 and Nasdaq 100 pointed to fresh record-high openings, while the Dow Jones was set to rise by 150 points.
Adding to the bullish tone, Commerce Secretary Lutnick announced a trade agreement with China, reducing tariff risks and easing concerns over rare earth shortages.
TECHNICAL OUTLOOK – SPX500
The index has broken into new all-time highs (ATH) and stabilized above the 6,143 resistance level, confirming bullish strength.
As long as the price trades above 6,143, the uptrend is likely to continue toward 6,225, with potential short-term pullbacks to 6,143.
A 1H candle close below 6,143 could trigger a deeper correction toward the pivot zone at 6,098.
Key Levels
Resistance: 6,175 → 6,225
Support: 6,098 → 6,041
previous idea:

Wave 5 up in a Diagonal could be hours away The chart posted is the sp 500 futures back in april 10 th I labeled the low at 5102 as wave B or 2 both called for sharp rally to as high as 6147 in which wave 1 or a x 1.168 = 3 or c for a wave B top . since then I saw the high at 5968 as the end of wave 3 top and then looked for a drop back to 5669 we saw 5667 and so far all rallies have taken a 3 wave formation in which Most but Not all times this is occurring in an ending diagonal and in each wave we saw so far .887 the preceding wave . I have traded in and out and I am waiting for a final push up to 6083/6147 midpoint 6100 to take a short position . The alt is a small series of 4/5 4/5 4/5 if this were the count we would then break ABOVE 6147 and then reach 6330 . I am waiting to confirm .Best of trades WAVETIMER

US500 Signaling Optimism!Hello TradingView Family / Fellow Traders. This is Richard, also known as theSignalyst.
📈Long-term, US500 has been overall bullish trading within the rising wedge pattern marked in blue.
This month, US500 has been in a correction phase, retesting the lower bound of the wedge.
Moreover, the green zone is a strong structure and previous ATH.
🏹 Thus, the highlighted blue circle is a strong area to look for buy setups as it is the intersection of structure and lower blue trendline acting as a non-horizontal support.
📚 As per my trading style:
As #US500 is hovering around the blue circle zone, I will be looking for bullish reversal setups (like a double bottom pattern, trendline break , and so on...)
📚 Always follow your trading plan regarding entry, risk management, and trade management.
Good luck!
All Strategies Are Good; If Managed Properly!
~Rich
Disclosure: I am part of Trade Nation's Influencer program and receive a monthly fee for using their TradingView charts in my analysis.

SPX 500 - simple trade idea- daily 200 MA
- lower trendline of the broadening wedge
- 5750 is 0.382 fib from 5 aug 2024 to 19 feb 2025
you can expect a bounce around 5750 that could lead to new ATH around mid april/may
if close daily below the trendline maybe hard times ?
lets follow the arrows
Confidence 5/10 as i'm not trading stocks

Wave structure and TIMING sp 500 I am in cash 100 % I am waiting on what could be the final up leg from 3/23/2020 Best of trades Major and minor turn date 3/10 to 3/13th best of trades WAVETIMER

S&P as always goes higherAs a routine for s&p we are waiting to see a rally and it’s very probable that this daily trading range would break to up in order to complete the two leg theory

SP 500 cash wave B at 6069 wave C down 5908 plus or minus 4The sp has now traced out a abc rally back to .618 at 6069 I have moved to a 20 % long puts stop 6071 If the structure is correct we should see the next wave C down to .618 for wave 2 from which we should then rally to 6183 alt 6235 for the TOP of wave 3 of 5 of 5 best of trades WAVETIMER /

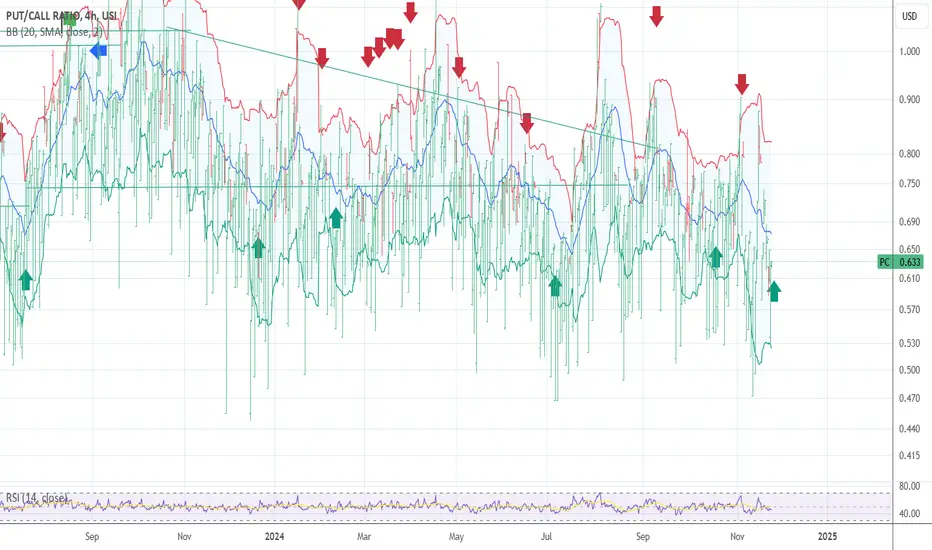
PUT CALL GIVING A SELL EXIT NOW The put call model just gave a sell as we fail to break Above 5981/5984 in fact we keep failing at the A x 1618 at 5972 The risk is now HIGH of a C wave decline down to .618 or 786 that is 5820 to 5760 I will NOT SHORT based on the alt MOVE TO CASH
WAVE 5 of 5 of 3 topping NOW I did say 5935 to 6012 as focus The alt based on MATH is 6118 to 6211 BUT TIME IS RUNNING OUT IN CYCLE BULL I am 101 % long in the money PUTS and do not fear it !!! NYSI has now formed a HOOK !!!

Wave 4 nearing the end 5703 to 5696 wave 5 5935 plusThe chart posted is the cash sp 500 .I sold longs the other day small gain then moved to a 90 to 100 long puts in the money and sold for a nice gain at 4;15 pm as the min abc down was formed . since then we broke hard the timing from july 16 called for a top and drop . so now what is that the TOP TOP I have an issue with it as it was a low bull sediment and A high short term put.call I see this decline as wave ABC down for wave 4 and should hold 5703 to 5696 and then Turn up We are how ever being held back until the new moon at 8.47 am We should see a very strong move in the direction up to see a print min target 5935 to as high as 6118 with 6012 as the most likely price I will how ever be selling LONGs at 5921 and up and buying in the money puts at these prices . Best of trades WAVETIMER 2024 was a great year again $$$ 43 winning trades flat 8 loss 9

Recession After Fed Rate Cut?Are we heading toward recession? To answer this question, I'm pulling the recession prediction indicator based on GDP provided by FED (ticker:JHGDPBRINKDX) which is the purple color on the bottom chart. It shows that we are on fairly low probability of recession (around 4%) as of end of Aug 2024. The FED indicates it will cut rate on end of Sep 2024.
However, if we look back of history of recession based on GDP indicated by FED data (ticker: JHDUSRGDPBR) which is the pink color. It shows that recession only happen right after FED cut rate as show by lime color (ticker:FEDFUNDS). It hard to believe that recession is caused by the FED cutting rate. Or the FED will only cut rate if we are heading toward recession? At least from the past history of rate cut we can see high chance of recession happening after the FED cut rate. And during the recession we can see that S&P500 are falling. So will there be another crash coming after Sep 2024? Please comments below.

What's S&P500 & Why Needs a Price CorrectionThe S&P 500 (Standard & Poor's 500) is a stock market index that tracks the performance of 500 of the largest publicly traded companies in the United States. It is widely regarded as one of the best indicators of the overall health of the U.S. stock market and the economy. The companies included in the index span a wide range of industries, including technology, healthcare, financials, and consumer goods, among others. The index is weighted by market capitalization, meaning larger companies have a greater impact on the index's performance.
Why SP500 needs a Price Correction?
A price correction occurs when the value of a stock or a market index, like the S&P 500, declines by a certain percentage, typically 10% or more, after a sustained period of upward movement. Corrections are a natural part of market cycles and can happen for several reasons. Here are a few reasons why stocks may need to go down in order to make a correction:
1. Overvaluation:
When stocks become overvalued relative to their earnings, assets, or growth potential, a correction helps realign prices with their intrinsic value. Investors may have driven prices too high due to speculation or overly optimistic expectations, and a correction brings valuations back to more reasonable levels.
2. Market Euphoria and Excessive Risk-Taking:
When the market experiences excessive optimism, driven by factors like low-interest rates, easy access to capital, or speculative trading, it can lead to inflated stock prices. A correction serves as a reality check, reducing excessive risk-taking and bringing prices back to sustainable levels.
3. Economic Slowdown or Uncertainty:
Economic indicators like GDP growth, unemployment rates, or consumer spending can signal a slowdown. If the economy is weakening, companies may struggle to meet earnings expectations, leading to lower stock prices. A correction allows the market to adjust to a new economic reality.
4. Interest Rate Changes:
Rising interest rates make borrowing more expensive and reduce corporate profits, which can lead to a market correction. Higher rates also make bonds more attractive relative to stocks, prompting investors to reallocate their portfolios, leading to downward pressure on stock prices.
5. Profit-Taking by Investors:
After a strong market rally, investors may start taking profits, especially if they believe prices have peaked. This selling pressure can lead to a correction as stock prices adjust to lower levels.
Conclusion
Corrections are a necessary and healthy part of the market cycle, helping to prevent bubbles from forming and ensuring that stock prices reflect the underlying fundamentals of companies and the economy. Although corrections can be unsettling for investors, they often create buying opportunities and contribute to the long-term stability of the market.

SP500: Bracing for Impact?The crisis is gradually approaching... Global central banks are cutting rates at the fastest pace since the Covid era, according to BofA. The scenario might play out more slowly than shown on the chart, but the essence remains the same.
The upcoming U.S. elections are unlikely to be quiet and peaceful—something big is bound to happen. I'm leaning more towards a downturn.
Is it time to start picking up some Put options? 🤔🤔🤔

S&P Futures Market Simple Trading Plans - Reacting To FEDHere's a detailed video on how to make use of market sentiment early on.
If you are looking for value investor longs, you'd need sentiment to feed in further and drop the price of the SPX.
For shorts, you'd need continued sentiment to support a downside case. More would need to follow post Fed Member Goolsbee regarding jobs/inflation.

another megaphoneLike in other actions, AMEX:SPY is no exception. I believe a megaphone has been created that will be looking to break its resistance to continue its upward trend

Hypothetical Pullback Jan 8th pullback in the S&P to 4220
This is an estimated pullback using the same timeframe we saw while hitting resistance last week

TLT Got Reality Checked Harder Than 2016. -43%!
Every 40+ investor and a pair of eye glasses is pounding the long TLT! call options TLT!.
You sure about that? you sure you can handle 4-5 years of a complete dead TLT?
Federal Reserve seems to be only interested in bailing out banks collateral directly instead of starting YCC so the TLT traders "bond market is the safest in the world" has just completely took a nose dive.
The hope here is that WW3 starts / or JP Morgan blows up like 2009 but again do you think the FRED will allow that to happen? Not a chance. Bank Term Funding Program

Panic is slowly setting in, VIX highest since late March 2023Yesterday, the Volatility S&P 500 Index hit its highest value since late March 2023 (when regional banks were imploding), reflecting a quickly deteriorating sentiment among market participants. Both SPX and ES1! constituted a new daily low, which continues to support a bearish case. This case is also supported by RSI and Stochastic reversing on the daily time frame and MACD flattening slightly below the midpoint (failing to break into the bullish area). As for the weekly time frame, all of the mentioned indicators develop bearish structures. In our view, more downside is very likely, with SPX testing its recent lows.
Illustration 1.01
Illustration 1.01 displays the daily chart of SPX and simple support/resistance levels.
Technical analysis gauge
Daily time frame = Bearish
Weekly time frame = Bearish
*The gauge does not necessarily indicate where the market will head. Instead, it reflects the constellation of RSI, MACD, Stochastic, DM+-, ADX, and moving averages.
Please feel free to express your ideas and thoughts in the comment section.
DISCLAIMER: This analysis is not intended to encourage any buying or selling of any particular securities. Furthermore, it should not be a basis for taking any trade action by an individual investor. Therefore, your own due diligence is highly advised before entering a trade.

Country Garden is unable to meet the offshore debt payments The past few days were quite choppy for SPX. However, S&P 500 E-mini Futures have not broken above the 0.5 Fibonacci retracement level. That allows us to maintain a bearish stance and keep the recently introduced setup valid. As a result, there is not much to write about today, except for one noteworthy thing that caught our attention overnight: one of the largest Chinese real estate developers, Country Garden, failed to meet offshore debt payments (already in the grace period), suggesting default proceedings might be next. We will update our thoughts on the asset with the emergence of new developments.
Illustration 1.01
Illustration 1.01 displays the daily chart of ES1! and Fibonacci retracement levels.
Technical analysis gauge
Daily time frame = Neutral
Weekly time frame = Slightly bearish
*The gauge does not necessarily indicate where the market will head. Instead, it reflects the constellation of RSI, MACD, Stochastic, DM+-, ADX, and moving averages.
Please feel free to express your ideas and thoughts in the comment section.
DISCLAIMER: This analysis is not intended to encourage any buying or selling of any particular securities. Furthermore, it should not be a basis for taking any trade action by an individual investor. Therefore, your own due diligence is highly advised before entering a trade.
