SP500 - Looking To Sell Pullbacks In The Short TermH1 - Strong bearish move.
No opposite signs.
Expecting bearish continuation until the two Fibonacci resistance zones hold.
If you enjoy this idea, don’t forget to LIKE 👍, FOLLOW ✅, SHARE 🙌, and COMMENT ✍! Drop your thoughts and charts below to keep the discussion going. Your support helps keep this content free and reach more people! 🚀
--------------------------------------------------------------------------------------------------------
Sp500short

S&P 500 Chart Analysis.S&P 500 Chart Analysis.
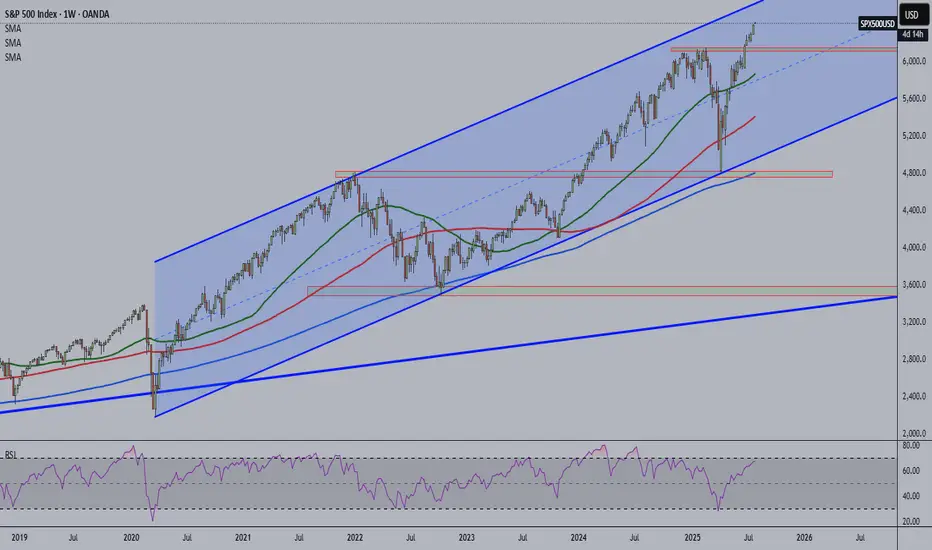
The S&P 500 index is still trading within a long-term ascending channel, indicating overall market strength.
The price is currently near the upper trendline, keeping the market in bullish territory.
The index recently found support near the 21-week moving average (21 MA), which is a strong dynamic support level.
If the price remains above the 21 MA, the index could move higher and attempt to make new highs.
If the price closes weakly below the 21 MA, it could retrace towards the middle or lower part of the channel.
The trend remains bullish, but some caution is advised at these elevated levels. As long as support holds, the bullish momentum is likely to continue.
⚠️ Exercise caution.

SPX - H4 - SELL SETUP - Supply Retest confirmedSPX has entered bear market territory last month and I expect a continuation to the downtrend from here onward. Based on many different macro indicators such as credit default swaps on big tech, macro regimes, sentiment and technical analysis. I see SPX falling off the clip from this precise supply zone

SPY - Potential Head & Shoulders And now we have this exhaustion pattern again. I went back and foruth on this yesterday. But in the final minutes a bought shorts again. The right shoulder can consolidate for a few days and the H&S can still be invalidated but I have this on my bucket list. I can´t sit on the sidelines on this one. If it happens, it will be legendary. With first strong support at 605

SP500 Bearish unless price consolidate and make a swing low!If price reject 6900 on Asia or London lower prices are more likely we are to premium. Discount area 6800 -6750 keeping bull trend intact. So be aware of bull traps.
S%P DROP AND GIVE ME 50....50K PLEASE LOLBias is BEARISH!
Hear me out tho lol!
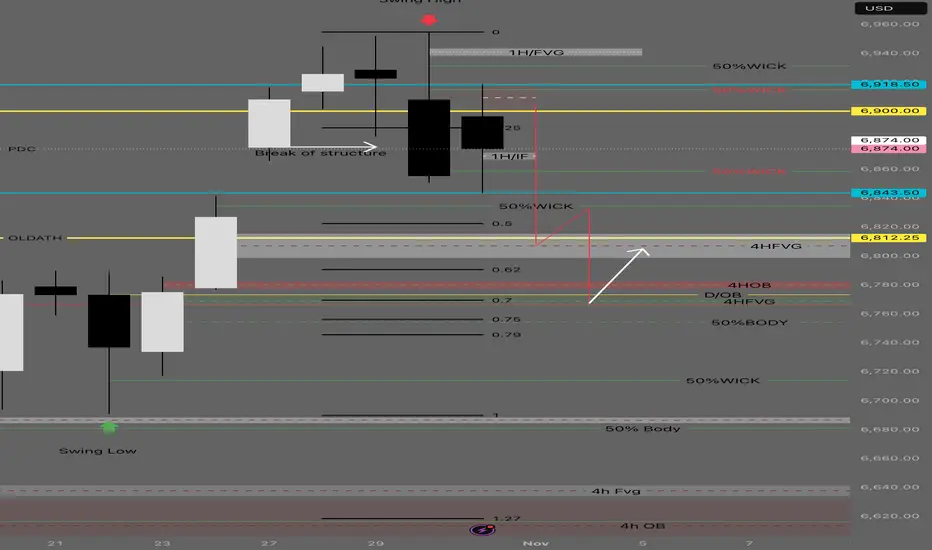
First, we never predict; we estimate and wait! Price will tell us where it wants to go. Based on my estimate, we have big news this week that does not look very positive and could negatively affect American businesses and stocks, potentially leading to central sell pressure in the market. That, paired with no significant pullback on the D/HTF's, makes me estimate we should have nice sell ops.
4H Golden zone is around 6,809-50% and 6,801-.618%! (Great buy bounce area)
after that we have some IPP'S (important price points)
6,840 If passed and closed above we can see move to even HH's!
or
If we see a rejection to 6,801 price area we can see a dump taking out session IPP's and pushing to lower FVGs! (what I want lol)
so we are going to let the market play, while we wait....and GET PAID!!
GDluckThisWeek!

SP500 Bearish Outlook With Tight SLBearish Technical Reading
• The index is currently trading near 6,728 after a strong recovery rally.
• Nearest hypothetical major resistance: 7,125 (weekly supply + marked zone).
• Nearest key support: 6,150 – 6,170 (structural pivot, last defended level).
• Breakdown from this zone could trigger a deeper correction.
________________________________________
Bearish Trade Setup (Tighter Levels)
• Entry: Short around 6,700 – 6,750 (current resistance zone).
• Stop Loss: 7,150 (above weekly resistance to avoid fakeouts).
• Take Profit 1 (TP1): 6,150 – 6,170 (structural demand, first bearish magnet).
• Take Profit 2 (TP2): 4,820 – 4,850 (major demand, previous accumulation zone).
________________________________________
Logic Behind Levels
• Stop Loss 7,150 is placed above the marked resistance — if price breaks and holds above, bearish thesis weakens.
• TP1 at 6,150 matches the exact key support drawn on your chart — logical place to secure partials.
• TP2 at 4,820 aligns with historical strong demand and would only be targeted if shutdown-driven fear prolongs and selling accelerates.
________________________________________

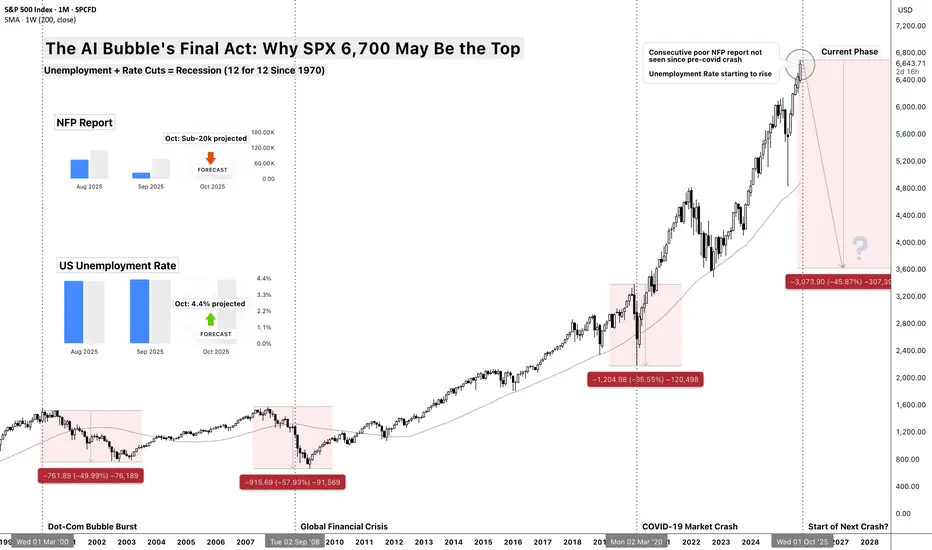
The AI Bubble's Final Act: Why $SP:SPX 6,700 May Be the TopThe AI Bubble's Final Act: Why SP:SPX 6,700 May Be the Top
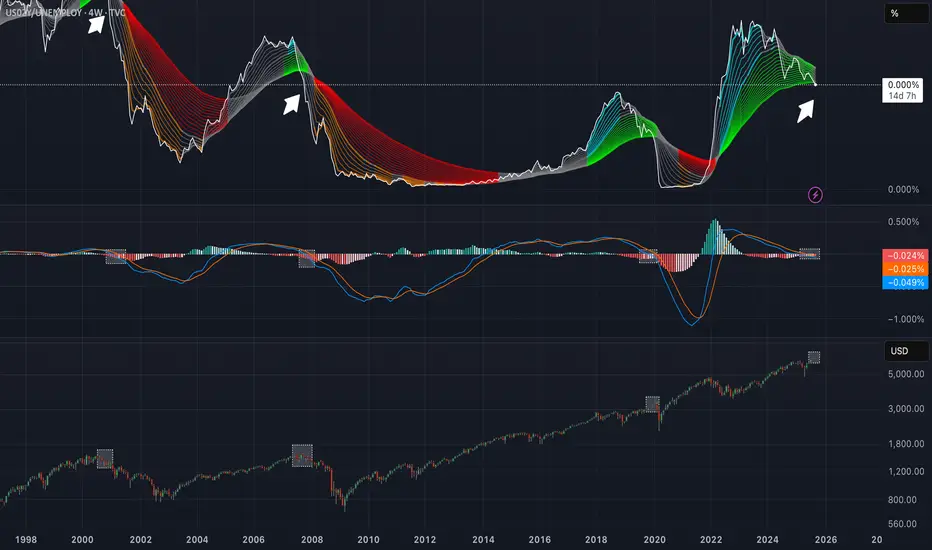
Unemployment + Rate Cuts = Recession (12 for 12 Since 1970)
The Death Cross Pattern
There's a simple rule that's worked for 55 years: When the Fed cuts rates while unemployment is rising from cycle lows, recession follows within 12 months - every single time.
Think of it like a doctor taking your temperature while giving you painkillers. The medicine might make you feel better temporarily, but if the fever is rising, something serious is wrong underneath.
Current Status:
✅ Fed just cut rates ECONOMICS:USINTR (September 2025)
✅ Unemployment ECONOMICS:USUR rising from 3.4% cycle low
✅ TVC:SPX at all-time high ($6,700)
Historical Result: 12/12 times = recession + 35% average equity crash
The Precedent: Crisis Follows a Script
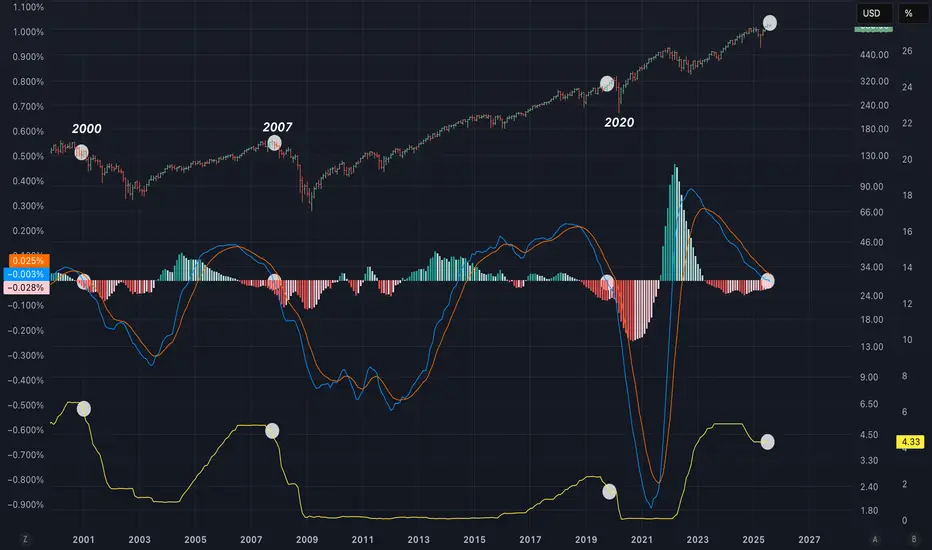
2000 Dot-Com Bubble:
Setup: TVC:SPX at ATH (1,550), ECONOMICS:USUR unemployment at 3.9%, ECONOMICS:USINTR Fed starts cutting
Crisis: Technology "revolution" story breaks down
Result: -49% crash over 2.5 years
Recovery: 7 years to new highs
2008 Financial Crisis:
Setup: CBOE:SPX at ATH (1,576), ECONOMICS:USUR unemployment at 4.4%, ECONOMICS:USINTR Fed starts cutting
Crisis: Housing/credit bubble bursts
Result: -57% crash over 1.5 years
Recovery: 5 years to new highs
2025 AI Bubble:
Setup: SPREADEX:SPX at ATH (6,700), ECONOMICS:USUR unemployment at 3.4%→4.2%, ECONOMICS:USINTR Fed starts cutting ✅
Crisis: AI productivity story meets employment reality
Projection: -35 to -45% crash over 18 months
Recovery: 3-5 years (faster due to tech infrastructure remaining)
The AI Employment Paradox
The Productivity Mirage
Wall Street celebrates AI boosting productivity, but here's the paradox:
productivity gains = job losses = reduced consumer spending = recession.
Think of it like a factory owner celebrating a new machine that replaces 100 workers. Great for margins, terrible for the local economy when those 100 families stop spending.
Jobs ECONOMICS:USNFP at Risk by Sector:
Customer Service: 2M jobs (chatbots replacing agents)
Software Development: 500K jobs (AI-assisted coding reducing teams)
Transportation: 3M jobs (autonomous vehicles accelerating)
Administrative: 4M jobs (AI handling routine tasks)
Content Creation: 1M jobs (AI writing, design, video)
Total Impact: 10+ million jobs facing displacement over next 2-3 years
Why This Time is Different?
Unlike previous automation waves that created new job categories, AI is targeting cognitive work directly. A factory worker could become a service worker, but what does a displaced knowledge worker become?
Valuation Extremes: 1929 Levels with 2025 Leverage
Current Valuation Metrics:
Shiller CAPE: 38+ (higher than 1929's 33)
Buffett Indicator: 195% (market cap/GDP, historical average 85%)
Price/Sales: 3.3x (vs 1.4x historical average)
Forward P/E: 23x (on optimistic AI earnings assumptions)
Valuations today exceed 1929 by most measures - but with far more leverage embedded in the system. If 1929 was a valuation bubble, 2025 is that bubble layered with derivatives, corporate debt, and passive flows.
The Leverage Layer:
Margin Debt: $1.023 trillion (record high)( as of July 2025, ycharts )
Corporate Debt/GDP: 85% (vs 45% in 2000)
Derivatives Exposure: $700 trillion notional ( as of June 2025, BIS semiannual data )
ETF/Passive Flows: $1.5 trillion annually (forced selling on reversals)
When liquidity stress hits, derivatives amplify shocks - notional exposure dwarfs underlying assets.
Think of today's market like a house of cards built on a trampoline. Even small bounces can bring the whole structure down.
Technical Breakdown: The Charts Don't Lie
Major Warning Signals:
Market breadth has deteriorated from 90% in Q4 2024 to ~60% today,
Defensives led earlier in the year,
TVC:VIX Volatility’s floor has shifted higher
Credit risk appetite (HYG/TLT) is stretched.
Together, these signal fragility beneath the index surface.
The Three-Stage Technical Collapse:
Stage 1 - The Warning (Now-Q4 2025):
Current Level: $6,700
Initial Support: $6,200 (previous resistance)
Character: Failed rallies, rotating leadership, "healthy correction" narrative
Target: 5,800-6,000 (-10 to -13%)
Stage 2 - The Cascade (Q4 2025-Q2 2026):
Breaking Point: Below 5,800 triggers algorithmic selling
Character: "Buy the dip" stops working, margin calls begin
Target: 4,800-5,200 (-25 to -30%)
Stage 3 - Capitulation (Q2-Q4 2026):
Final Flush: Panic selling, ETF redemptions
Character: "Markets will never recover" sentiment peaks
Target: 3,700-4,200 (-35 to -45%)
The Catalyst: When Reality Meets Hype
Q4 2025 Earnings Season - The Reckoning
Companies will face impossible questions:
"You spent $50B on AI - where's the revenue growth?"
"Productivity is up 20%, why are you laying off workers?"
"If AI is so transformative, why are margins declining?"
The Employment Data Domino Effect:
October/Nov NFP: First print above 250K unemployment claims
November Consumer Spending: Down 2%+ as job fears spread
December Holiday Sales: Weakest since 2008
January Layoff Announcements: Tech companies start "right-sizing"
Think of it like the moment in 2000 when investors finally asked: "How exactly does Pets.com make money?" or 2007 when they wondered: "What's actually in these mortgage bonds?"
Sector-by-Sector Breakdown
Technology (-50 to -70%)
AI hype stocks get destroyed first
Software companies face declining growth + competition
Semiconductor cycle turns negative
Biggest Losers: NVDA, MSFT, GOOGL
Consumer Discretionary (-40 to -55%)
Unemployment hits spending immediately
High-end retailers crushed first
Auto sales collapse with higher rates
Biggest Losers: TSLA, AMZN, NKE
Financials (-30 to -45%)
Credit losses surge as economy weakens
Interest margin compression
Commercial real estate exposure
Biggest Losers: Regional banks, non-bank lenders
Relative Outperformers (-15 to -25%)
Utilities, Healthcare, Consumer Staples
Companies with genuine AI cost savings
High-dividend yielders in low-rate environment
Key Dates and Catalysts
October 2025:
Jobs report (first warning?)
Q3 earnings disappointments
Fed meeting (dovish pivot?)
November 2025:
Election aftermath volatility
Black Friday sales data
Thanksgiving week low-volume crashes
December 2025:
Year-end tax selling
Institutional rebalancing
Holiday retail reality check
Q1 2026:
Layoff announcements surge
Earnings guidance slashed
Credit events begin
The Recovery Setup
Why This Crash Creates Opportunity:
Valuation Reset: P/E ratios back to historical norms
Weak Hands Flushed: Margin traders eliminated
Government Response: Fiscal + monetary stimulus
AI Infrastructure Remains: Real productivity gains continue post-bubble
Recovery Timeline:
Bottom: Q4 2026 around 3,700-4,200
Initial Rally: 30-50% bounce over 6 months
New Bull Market: Begins 2027 with stronger foundation
New Highs: 2029-2030 timeframe
Risk Management Rules
This Analysis Fails If:
Fed pivots to massive QE before crisis
Fiscal stimulus exceeds $2 trillion quickly
AI productivity gains offset job losses faster than projected
Geopolitical crisis overrides economic fundamentals
Probability Assessment:
60%: Correction to 4,800-5,500 range (25-30% decline)
25%: Major crash to 3,700-4,200 range (40-45% decline)
15%: Continued melt-up through 2026 (soft landing achieved)
Conclusion: The End of the Everything Era
At SPX 6,700 with unemployment rising and the Fed cutting rates, we're witnessing the final act of the 15-year "everything bubble."
The AI revolution is real, but like the Internet in 2000, revolutionary technology doesn't prevent financial gravity.
The bubble is ending exactly like the previous ones - with everyone believing "this time is different" right until it isn't.
Smart money is already rotating defensive. The question isn't whether a correction is coming - it's whether you'll be positioned for it.
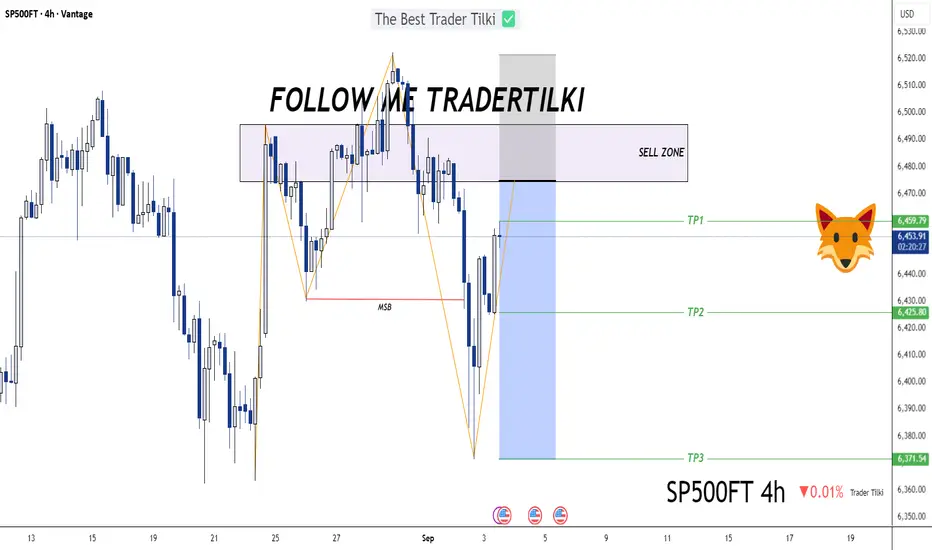
SP500 Structure Shift: Sell Zone ActivatedHey Guys 👋
I’ve prepared an SP500 analysis for you. Since the market structure has shifted, I’ll be opening a sell position from my designated sell zone.
📌 Entry: 6,474.90
📌 Stop: 6,522.12
🎯 TP1: 6,459.79
🎯 TP2: 6,425.80
🎯 TP3: 6,371.54
RISK REWARD - 2,21
Every single like you send my way is a huge source of motivation for me to keep sharing these analyses. Big thanks to everyone supporting with a like 🙏
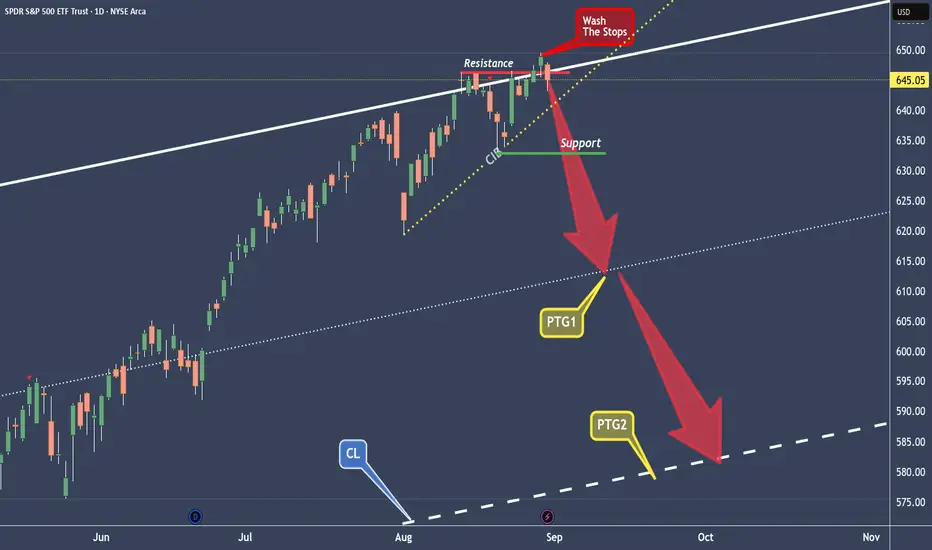
SPY washed away the Stops, and now rinse supportAt the U-MLH the air is very, very thin now.
SPY is experience this and it looks like this market shows it's hand.
It's the second time where the breakout failed.
A classical Double-Top.
Today SPY will open back into the Fork, which is a very bad sign for climbing markets. And if SPY can't close outside the Fork today, it would be a clear short to me.
So, after the Wash of the Stops at the Top, what follows is the "Rinse" of the support level and then way down to the PTG1, the 1/4 line, and further to the PTG2 at the Center-Line.
Credit crunch about to explodeI strongly believe we are about to experience a recession in the coming months. Open some spy shorts posisitions for late 2026.
LMACD of the US02Y has just dipped bellow 0!In the past while rates have been elevated for a period of time things have gone bad for risk markets once the LMACD dipped bellow 0. Could be this time different?
JP Morgan warns the S&P is due a retracement!🚨 Alert 🚨
JP Morgan and Deutsche Bank are the latest to warn that the S&P is due for a correction.
I'm short with a small position size, as the price could move higher yet... Judging by experience, it's near impossible to predict tops. It's best to close long positions or enter smaller-sized short positions with large stops.
VANTAGE:SP500 PEPPERSTONE:US500 ICMARKETS:US500 OANDA:SPX500USD

Overbought alert? The S&P500 is nearing weekly and monthly bullish channel resistance. Price has remained within this channel since 2020.
PEPPERSTONE:US500 VANTAGE:SP500
ES1! S&P500 Might Lose Momentum As Tariffs Deal Not Set...price could probably be testing all time highs. Before plunging....
if the volumes comes with it and reaches the all times high levels, that could be a nice short entry point for potential profits.
Otherwise, it could probably just fill the gap on week open and keep going down in a regular pattern until August as Trumps Tariffs Deals deadline is around that time possiblily...

SHORT SP500fundamental : negative dollar
Techniq: respecting 15M BEARISH GAP
OB = BB
SSL still not taken

A crash in the horizonAs I have been suspecting for a long time. Markets are getting closer to a crash. On the weekly the 2 years bond market confirmed the change in the trend to the downside. Once we dip bellow the blue ema we might be entering in a doomed phase. Cheers

S&P 500 – Projection to the SouthLooking at the market's behavior using the orange median line/fork, one can clearly see how the market reacts when it touches one of the lines.
Median lines/forks are not an oracle. They simply project the highest probable path of the price based on a mathematical calculation inherent to the tool.
If you follow the rule set, money management, and risk management, you have a wonderful framework that offers a significant advantage in trading the markets.
Let’s take a look at the current situation:
The orange fork:
– Price closes outside the fork (1)
– Multiple retests of the L-MLH (textbook behavior) (2)
– Break of the 1/4 line, heading toward the 1st warning line (3)
Next movement pattern according to the median line framework:
– Drop to the white centerline (4)
– Retest of the centerline (5)
– 1/4 line (6)
– Lower median line parallel (7) with a possible retest
– Orange centerline of the pendulum fork (8)
Wishing everyone a wonderful start to the week.

SP500 BEARISH TRADE IDEA Key Observations:
Imbalance Zone Identified (Supply-Demand Gap):
The pink zone is marked as an imbalance — an area where price moved too quickly upward, leaving little trading volume in between.
These imbalances often act like magnets, drawing price back to "fill" them.
Recent Price Action:
Price recently formed a peak and has since started pulling back.
The latest candlesticks show bearish momentum (a series of red Heikin Ashi candles with increasing size).
Projected Price Movement:
A blue arrow projects a further decline into the imbalance zone, suggesting price may retest this level for liquidity or to complete a retracement.
Target Area:
The imbalance zone lies approximately between 5,680 and 5,736, with a midpoint around 5,710.
This is a logical target for a pullback before potentially resuming upward.
📉 Bearish Bias Justification:
Market Structure: A new lower high is forming, possibly signaling a short-term reversal or correction.
Heikin Ashi Candles: Smooth and elongated bearish candles indicate strength in the down move.
Volume Imbalance Theory: Price may need to fill this inefficiency before finding new direction.
✅ Possible Trading Implications:
Short Setup: Traders might look for short positions with targets inside the imbalance zone.
Buy Opportunity: Once the imbalance is filled, if bullish price action confirms, it could become a strong buy zone.
⚠️ What to Watch:
Look for confirmation (e.g., candlestick reversal or support forming) in the imbalance area before assuming reversal.
News/events (such as the economic calendar icons below) might impact price direction sharply.

S&P 500 | Blue Box as Margin of SafetyWhen the index returns to the blue box, it reaches a zone forged by genuine buying interest and technical alignment. In a disciplined, data‑driven approach, this area serves as our first line of defense.
Why It Matters
• Past reactions show price pauses and reversals here, revealing real demand.
• It coincides with key footprint volume clusters where buyers have stepped in.
Entry Criteria
Higher‑Time‑Frame Stability
Confirm price holds within or above the blue box before considering a position.
Lower‑Time‑Frame Confirmation
Wait for clear breakouts or higher‑lows on short‑term charts backed by rising footprint volume.
Strict Risk Control
If price breaks through without retest or volume support, stand aside and seek a clearer setup.
By treating the blue box as our margin of safety and relying on actual volume footprint data, we trade with prudence and let the market’s real signals guide our decisions.
📌I keep my charts clean and simple because I believe clarity leads to better decisions.
📌My approach is built on years of experience and a solid track record. I don’t claim to know it all but I’m confident in my ability to spot high-probability setups.
📌If you would like to learn how to use the heatmap, cumulative volume delta and volume footprint techniques that I use below to determine very accurate demand regions, you can send me a private message. I help anyone who wants it completely free of charge.
🔑I have a long list of my proven technique below:
🎯 ZENUSDT.P: Patience & Profitability | %230 Reaction from the Sniper Entry
🐶 DOGEUSDT.P: Next Move
🎨 RENDERUSDT.P: Opportunity of the Month
💎 ETHUSDT.P: Where to Retrace
🟢 BNBUSDT.P: Potential Surge
📊 BTC Dominance: Reaction Zone
🌊 WAVESUSDT.P: Demand Zone Potential
🟣 UNIUSDT.P: Long-Term Trade
🔵 XRPUSDT.P: Entry Zones
🔗 LINKUSDT.P: Follow The River
📈 BTCUSDT.P: Two Key Demand Zones
🟩 POLUSDT: Bullish Momentum
🌟 PENDLEUSDT.P: Where Opportunity Meets Precision
🔥 BTCUSDT.P: Liquidation of Highly Leveraged Longs
🌊 SOLUSDT.P: SOL's Dip - Your Opportunity
🐸 1000PEPEUSDT.P: Prime Bounce Zone Unlocked
🚀 ETHUSDT.P: Set to Explode - Don't Miss This Game Changer
🤖 IQUSDT: Smart Plan
⚡️ PONDUSDT: A Trade Not Taken Is Better Than a Losing One
💼 STMXUSDT: 2 Buying Areas
🐢 TURBOUSDT: Buy Zones and Buyer Presence
🌍 ICPUSDT.P: Massive Upside Potential | Check the Trade Update For Seeing Results
🟠 IDEXUSDT: Spot Buy Area | %26 Profit if You Trade with MSB
📌 USUALUSDT: Buyers Are Active + %70 Profit in Total
🌟 FORTHUSDT: Sniper Entry +%26 Reaction
🐳 QKCUSDT: Sniper Entry +%57 Reaction
📊 BTC.D: Retest of Key Area Highly Likely
📊 XNOUSDT %80 Reaction with a Simple Blue Box!
📊 BELUSDT Amazing %120 Reaction!
📊 Simple Red Box, Extraordinary Results
I stopped adding to the list because it's kinda tiring to add 5-10 charts in every move but you can check my profile and see that it goes on..

S&P500 2022 into the Bear Market. Same Pattern 2025In 2022, before the bear market began, we saw the same pattern that we're seeing now:
1. Sine wave pattern
2. Fake recovery
3. Break above the sine wave top
4. Sharp decline
Last week, right after the sine wave top was broken, U.S. bonds were downgraded AFTER OFFICIAL MARKET SESSION!
It’s no surprise that rating agencies are losing confidence in the U.S. government's ability to repay its debts.
Just look at the rising interest payments — if that’s not a wake-up call, I don’t know what is. 😕
I don’t live in the U.S., but I’m genuinely concerned that a collapse — which now seems nearly inevitable — will impact the entire world.
Going long in U.S. markets under these technical and fundamental conditions? Putting all your eggs back into that basket? Really?
I hope this gives some perspective.
Trade safely, trade small, and keep your risks minimal.

US500 bearish 12 May - 16 May 2025S&P 500 Bearish Outlook: Targeting $5,100 Amid Rising Uncertainty
As of May 12, 2025, the S&P 500 (US500) stands at 5,661, reflecting a robust recovery from its April lows. However, I anticipate a bearish shift, projecting a decline towards the $5,100 level in the near term. Several converging factors underpin this outlook:
1. Anticipated Weakness in Core CPI Data
The upcoming release of the April Core Consumer Price Index (CPI) on May 13 is poised to be a pivotal event. While the year-over-year Core CPI is forecasted at 2.8%, matching the previous month's figure, the month-over-month increase is expected to rise to 0.3%, up from 0.1% in March. This acceleration suggests persistent inflationary pressures, potentially prompting the Federal Reserve to maintain or even tighten monetary policy, thereby exerting downward pressure on equities.
2. Deteriorating Market Sentiment and Forecasts
A notable shift in market sentiment is evident, with key indicators turning bearish. A prominent S&P 500 model has signaled its first bearish outlook since February 2022, reflecting growing investor apprehension. Additionally, leading financial institutions have revised their S&P 500 targets downward:
Goldman Sachs: Reduced from 6,500 to 5,700
RBC Capital Markets: Lowered from 6,600 to 5,500
Oppenheimer: Cut from 7,100 to 5,950
Yardeni Research: Adjusted from 7,000 to 6,000
These revisions underscore the mounting concerns over economic headwinds and market volatility.
3. Sectoral Divergence: Opportunities Amidst the Downturn
While the broader market faces challenges, certain sectors may exhibit resilience or even bullish tendencies:
Healthcare: Continues to serve as a defensive sector, with companies demonstrating solid quarterly results and reaffirming full-year guidance despite tariff impacts.
Energy Infrastructure: Firms like Enbridge and TC Energy benefit from long-term structural tailwinds, including rising energy demand and global energy security priorities.
Financials and Technology: Sectors represented by ETFs such as XLK and XLF are highlighted for their strong fundamentals and growth prospects.
Conversely, consumer discretionary sectors are showing signs of strain, with negative revenue surprises and companies like Harley-Davidson withdrawing their 2025 outlooks amid tariff uncertainties.
4. Implications of the US-UK Trade Deal
Recent developments in the US-UK trade agreement further contribute to market uncertainty. While the deal includes exemptions for certain British goods, such as aerospace components and a quota of 100,000 UK-made cars annually, it also maintains a baseline 10% tariff on foreign goods. This policy introduces complexity and potential cost pressures for multinational companies operating across borders.
Moreover, the agreement has faced criticism for being one-sided, with concerns that it may not adequately protect domestic industries or address broader trade imbalances. Such apprehensions can dampen investor confidence and contribute to market volatility.
The convergence of persistent inflation, cautious monetary policy, revised market forecasts, and the complexities introduced by recent trade agreements suggest a bearish trajectory for the S&P 500, with a potential decline towards $5,100. Investors should remain vigilant, monitoring sector-specific developments and macroeconomic indicators to navigate the evolving market landscape.
Disclaimer: This analysis is for informational purposes only and does not constitute investment advice. Always conduct your own research before making investment decisions.

Major shift on the S&P 500: Is the bull market really over ?
After three years of almost uninterrupted gains, the U.S. market has finally shifted gears.
In early March, following a sharp escalation in trade tensions between China and the United States, the S&P 500 officially entered a bear market.
The tariff shock acted as a catalyst: buyers failed to defend critical levels, and the bullish momentum broke down.
Today, my scenario is clear:
I believe we are entering a wide range similar to what we saw in 2022, between 4700 and 5500 points.
In this controlled volatility environment, both investing and trading strategies must adapt.
💰 For long-term investing:
I'm staying fully in cash.
I prefer to wait until my personal indicator flashes green again before re-entering the market.
Patience is my best weapon in uncertain environments.
🎯 For swing trading:
The approach here is more active.
Each touch of the lower boundary (around 4700) will be considered a tactical buy, aiming to resell around 5500 points at the top of the range.
No rushing, no chasing moves: I only act at the extremes.
