SPX Daily: Rising Wedge at the HighsPrice is compressing inside a rising wedge near record levels — a downside break would signal a pullback, while an upside breakout requires strong follow-through to sustain the trend.
SPX (S&P 500 Index)

Massive Paper Attack on Silver! The Con Game Won't Last.Trading Fam,
Gold and Silver liquidated over 10 trillion dollars in less than 24 hours! To put that into perspective, that's the entire crypto market cap multiplied by over 3 times! What we witnessed in today's metals crash was truly historic! But was it real or an illusion?
I called "bluff" and bought SILVER. If you're a believer in scaling into your entries, today could have been a great start. Could SILVER go lower? Yes. Of course. However, recent demand for its utility in technology suggests that buying demand will resume quickly.
In more recent history, paper trading contracts have massively suppressed the true value of gold and silver, but silver has often taken the brunt of the hit. Today was a prime example. If we were to ever return to true historical values on silver, we should see a price of $200-$250 per oz. silver for every $5000 per oz. gold. We're nowhere near that. But I think we will get there soon. The collapse of the U.S. dollar further strengthens my conviction in this thesis. What we witnessed today in the precious metals market was unprecedented. The level of coordination by large institutions was both amazing and terrifying. However, their con game can't last.
We'll take a closer look at what the charts are showing us for SILVER, the U.S. dollar, the SPX, and Bitcoin.
Please enjoy this week's update.
✌️Stew

ES (SPX, SPY) Analysis, Key-Zones, Setup for Fri (Jan 30)AAPL crushed it today - iPhone revenue up 23%, China sales up 38% - and the market just sold it. Couldn't hold the pop. Tim Cook mentioned chip shortages and being in "supply chase mode" which spooked some folks. Meanwhile MSFT got hammered, down 10% after hours on cloud growth slowdown and AI spending concerns. That's a big deal - roughly 15-20 points of drag on ES at the open.
ES broke down during Asia, flushed from 6,980 through 6,968 all the way to 6,943 before catching a bid. Bounced back to 6,967-6,970 where we're now seeing a Lower High form on the 15-min. Structure is bearish - lower highs, lower lows confirmed. The 4H equilibrium at 6,930-6,920 is the magnet below.
Forecast:
• Overnight: Down to flat, leaning bearish
• Morning Session: Expecting downside pressure
• Afternoon: Likely choppy and two-sided
• Daily Close: Leaning toward a red close
• Expected Range: 6,900 to 6,990
• Most Likely Path: Test and reject 6,970-6,980 early, roll over and break 6,950, test the 6,930 equilibrium, bounce attempt fails, fade into close near 6,920-6,940
Friday Events:
• 6:15 AM: CVX (EPS 1.38 exp, Rev 44.1B)
• 6:30 AM: XOM (EPS 1.69 exp, Rev 81.3B)
• 6:30 AM: VZ (EPS 1.06 exp, Rev 36.1B)
• 7:00 AM: AXP (EPS 3.56 exp, Rev 18.9B) - good read on consumer spending
• 10:00 AM: Core Trend Inflation data
• After the bell: AMZN, GOOGL, INTC
Resistance:
• 7,022 – Thursday's High
• 7,010-7,012 – Prior Equilibrium Zone
• 6,993-6,995 – Critical Level / PDH Area
• 6,980-6,982 – VWAP / Demand Turned Resistance
• 6,968-6,970 – Lower High Formation
Support:
• 6,955-6,950 – Tested Support Zone
• 6,943-6,945 – Overnight Low
• 6,930-6,920 – 4H Equilibrium (Major Target)
• 6,900 – Psychological Level
• 6,875 – Prior Week Low
How I'm seeing it:
• Leaning bearish below 7,000
• A push back to 6,970-6,980 that can't reclaim sets up a fade toward 6,950, 6,940, then 6,930
• The bounce from 6,943 looks like a selling opportunity, not a trend change
• Above 6,995 and held - bearish view weakens
• Below 6,943 opens the door to 6,930-6,920
The market couldn't rally on perfect AAPL numbers. MSFT down 10% will probably overshadow META's +9%.
Good Luck !!!

$SPY & $SPX — Market-Moving Headlines Friday Jan 30, 2026🔮 AMEX:SPY & SP:SPX — Market-Moving Headlines Friday Jan 30, 2026
🌍 Market-Moving Themes
🛒 Mega Cap Save
AMZN and AAPL lift Nasdaq after hours as cloud demand and product certainty calm markets
📉 Goldilocks Inflation
Cooling PCE resets rate fears as yields fall and risk appetite broadens
🧠 AI Hardware Wins
Capex spending funnels into suppliers with NVDA and ANET leading on data center buildouts
🏥 Obesity Buyout Chatter
VKTX spikes on takeover rumors as pharma M and A focus returns to weight loss
📅 End of Month Flows
Window dressing dynamics dominate as January closes after a catalyst-heavy week
📊 Key U.S. Economic Data Friday Jan 30 ET
8:30 AM
- Producer Price Index Dec delayed: 0.3%
- Core PPI Dec delayed: 0.3%
- PPI YoY
- Core PPI YoY
9:45 AM
- Chicago Business Barometer PMI Jan: 44.0
1:00 PM
- Fed Gov Stephen Miran TV interview
1:30 PM
- St Louis Fed President Alberto Musalem speech
5:00 PM
- Fed Vice Chair for Supervision Michelle Bowman speech
⚠️ Disclaimer: For informational purposes only. Not financial advice.
📌 #SPY #SPX #PPI #Inflation #Earnings #AMZN #AAPL #AI #Macro #Markets #Stocks #Options

SPX: The Uptrend Is Speaking Loud and ClearSPX is still trading within a well-defined and controlled uptrend , supported by both fundamental tailwinds and solid technical structure . After the market has fully digested the high-interest-rate narrative, the Fed’s stance has gradually shifted toward a more neutral tone. Meanwhile, capital continues to favor U.S. equities , especially Big Tech and the AI theme , keeping risk-on sentiment firmly in place . At this stage, there is no catalyst strong enough to reverse the primary trend.
On the H4 chart, SPX is moving cleanly within an ascending channel, printing a textbook higher high – higher low structure. Price remains above the Ichimoku Cloud, with the cloud sloping upward — a clear confirmation that this is a genuine uptrend, not a short-lived momentum spike . Previous pullbacks have consistently stalled at dynamic support zones, followed by renewed upside continuation.
In the short term, the most realistic scenario remains a shallow pullback for consolidation before the next leg higher. The 6,900 level is acting as a key structural support; as long as price holds above this zone, the bullish structure remains fully intact. Upside focus sits near 7,100, where some short-term reaction may occur, but selling against the trend at this stage remains a high-risk approach.

$SPY the beginning of a covid style selloff? 20-32% drop?It is finally time for a larger selloff to happen. As you can see, we've broken down out of a rising wedge and many people are calling for another scenario to buy the dip, but this dip doesn't look the same as all of the other dips.
To me, this looks more like the start of a larger selloff. My thesis is that this selloff will be a cross between the selloff that took place in 1989 and covid. I think we're about to see a 20-32% drop that comes very quickly not giving people time to get out.
The past two days we're already trading exactly like we did in covid, where we can see sharp rallies that are met with more selling.
The reason this selloff is different is because volatility is starting to react and I have strong buy signals on the weekly timeframe while I'm getting weekly sell signals on SPY.
While my base case was that we'd only get a 20% selloff down to the $550-560 area on the chart, I won't rule out the possibility of the market selling off to the next support level down at $468-$481.
The selling should get stronger once we're under the $666-672 level and volatility will start to rise quickly. Under the $650 level should be lights out for the market.
Again, I think this selloff is going to happen very quickly over the next few weeks, so I'd be cautious buying any dips.
Let's see how it plays out.

ES (SPX, SPY) Analysis, Key-Zones, Setup for Thur (Jan 29)FOMC is behind us. Powell kept rates at 3.50-3.75% with a dovish lean. Two dissents favoring a cut from Waller and Miran which tells you something about where the Fed might be heading. They upgraded growth to "solid pace" and said labor is "stabilizing" so the soft landing story is still alive.
Earnings after hours were solid. Microsoft beat EPS by 31%, Azure still growing at 38%. Meta crushed guidance. Tesla had 20% gross margins which surprised a lot of people, plus Optimus 3 coming in three months. IBM did well too.
But even with those beats, ES sold off about 21 points after the close. Interesting part though, CVD flipped positive during the drop. Looks like buyers were quietly absorbing on the way down. Something to keep in mind tonight.
Tomorrow morning GDP drops at 8:30 AM. Atlanta Fed GDPNow has it at 5.4% while street consensus is around 2.5-3%. If it comes in hot, could get choppy as people start pricing out cuts.
Resistance:
- 7010-7012: Need to get back above here first
- 7022: Today's high
- 7032-7044: Bigger resistance zone
- 7057-7060: Weekly extension
Support:
- 6990-6993: Where we're hanging out now
- 6975-6980: Minor demand
- 6920-6930: 4H equilibrium, bigger support
- 6875: PWL
How I'm seeing it:
- Neutral to slightly bullish overnight
- Watching 6990 for any absorption
- Above 7010 and 7022-7035 comes into play
- Below 6975 and bulls lose control
With CVD positive and earnings strong, feels like bears have some work to do here. But a hot GDP or weak Apple numbers Thursday evening could flip things around pretty quick.
Good Luck !!!

ES (SPX, SPY) Analysis, Key-Zones, Setups for Wed (Jan 28)
ES pulled back to 7,019 after Globex ripped to 7,039 overnight. We're consolidating below the overnight high ahead of FOMC at 2 PM and Mag 7 earnings after the close. The path of least resistance is higher but binary events cap conviction.
OVERNIGHT RECAP
Globex pushed to 7,039 - highest level of the rally - then reversed into London. It was liquidity sweep above Tuesday's high followed by profit-taking. Asia was bid, Europe faded. Currently holding Y-VAH area around 7,017-7,020.
Key overnight levels:
Overnight High: 7,039
London Open High: 7,039
Asia Session High: 7,027.75
GLOBAL DRIVERS
Bullish factors dominating the tape:
China approved 400K NVIDIA H200 chips for Alibaba, Bytedance, and Tencent. This is a massive AI tailwind and removes a key overhang on the semiconductor complex.
SoftBank announced plans to invest an additional $30 billion in OpenAI, reinforcing the AI investment narrative heading into Mag 7 earnings.
ASML surged 6% in Amsterdam after Q4 bookings crushed expectations. Semiconductor strength continues.
Gold hit a record high above $5,200 per ounce on dollar weakness and safe haven flows.
Asian tech index reached all-time highs. South Korea's market has now surpassed Germany in total value, gaining $1.7 trillion since the AI rally began.
Dollar weakness continues with DXY near 4-year lows around 95.60. Trump's dovish stance on the dollar ("the loss is good for US businesses") supports risk assets.
Kremlin indicated openness to Trump contact, signaling potential geopolitical de-escalation.
Caution factors:
ECB's Villeroy called the dollar drop "a sign of US unpredictability."
South Korea warned they cannot rule out US mentioning tariffs again due to investment disagreements.
Mortgage applications fell 8.5% with rates rising to 6.24%.
Daily oscillator at 110 - extreme overbought. Extended 5 sessions straight.
FOMC PREVIEW - 2:00 PM ET
The Federal Reserve is currently expected to maintain interest rates in the range of 3.50% to 3.75%, with a probability of 97.2%. However, the real focus will be on Powell's tone rather than the decision itself.
Dovish signals to watch for include the statement highlighting a cooling labor market, greater confidence in ongoing disinflation, indications that rate cuts may be likely in 2026, and less emphasis on upside inflation risks.
On the other hand, hawkish signals to look out for might emphasize inflation uncertainty, Powell stressing the need for "greater confidence" before considering any cuts, pushback against near-term easing expectations, and an overall emphasis on patience and caution.
I expect the Fed will make an in-line decision to hold rates and use data-dependent language. Powell is likely to avoid providing a timeline for cuts and will emphasize flexibility. We may see an initial spike in reaction to the decision, followed by a fade as the focus shifts to corporate earnings.
MAG 7 EARNINGS - AFTER CLOSE
Microsoft, Meta, and Tesla are all scheduled to report earnings tonight after 4 PM. This is significant because having three major companies report on the same night can cause the ES to move by more than 50 points in Globex.
For Microsoft, strong growth in Azure and acceleration in AI revenue are essential. Meta needs to show strength in ad revenue without raising concerns about AI spending. Tesla has the weakest setup, facing issues with margin compression and competition concerns.
Additionally, Apple will report after the close on Thursday.
FOMC EXECUTION
Reduce position size by 50% before 2 PM announcement.
Wait 5-10 minutes for initial reaction to settle. The first move is often a fake.
Trade the second move:
If dovish spike to 7,045+ then buy the pullback to 7,030-7,035.
If hawkish flush to 7,000 then short retest of breakdown or buy 6,988 support.
If chop then wait for earnings to resolve direction.
BOTTOM LINE
Day 6 of the rally: Overnight, the market pushed to new highs at 7,039 before reversing. This situation could indicate either a bull flag, suggesting a continuation to 7,050 and above, or a liquidity sweep that signals a mean reversion back to 7,000.
The Federal Open Market Committee (FOMC) meeting will determine the outcome. If Powell takes a dovish stance, we may see a squeeze higher; if he adopts a hawkish tone, we could experience a drop. However, tonight's earnings reports from Microsoft, Meta, and Tesla are the larger wildcards in this scenario.
Consider buying dips in the range of 7,005 to 7,008 with defined risk. Additionally, look to fade spikes between 7,035 and 7,039 if rejection is confirmed. It's advisable to be flat before the earnings announcements at 4 PM.
Trade what you see. Good luck !!!

$SPX Called For a Long from Monday, Higher stillSPX continued the bullish run, and it currently at resistance trendline. A bit here is a gift; 6940 the level to watch for a move up to 7119

Day 97 — Grinding Back Profit in Short Squeeze ModeEnded the day +$204.85 trading S&P Futures. Operating on just 3 hours of sleep, the morning started rough with some losses due to a false signal as the market entered short squeeze mode. It was a grind, but I managed to claw my way back to profitability by the close. The MES market feels incredibly difficult right now—signals are mixed, and the relentless squeezing makes me hesitant that a sudden unload is coming. My plan moving forward is to size down to reduce risk while leaving just enough room to catch the downside if the rug finally gets pulled.
Day 97— Trading Only S&P Futures
Daily P/L: +$204.85
Sleep: 3 hours
Well-Being: Good
🔔News Highlights: *S&P 500 ENDS AT A NEW RECORD HIGH AS TECH SHARES RALLY AHEAD OF MEGACAP EARNINGS, FED MEETING
📈Key Levels for Tomorrow:
Above 6955= Bullish Level
Below 6950 = Bearish Level
📊Reviewing signals for today (9:30am – 2pm EST):
9:40 AM VXAlgo NQ X1DP Sell Signal,
9:50 AM ES1! Phase Change: Neutral :check~2:
9:50 AM MES Market Structure flipped bullish on VX Algo X3! :check~2:
10:00 AM Market flipped bullish on VX Algo X3! :check~2:
10:30 AM VXAlgo ES X1 Overbought/toppy Signal
11:30 AM VXAlgo ES X1 Overbought/toppy Signal :check~2:
11:50 AM VXAlgo ES X1 Overbought/toppy Signal :check~2:
12:20 PM ES1! Phase Change: Bearish :check~2:
12:30 PM VXAlgo NQ X1DP Buy Signal :check~2:
12:54 PM MES Market Structure flipped bearish on VX Algo X3!
1:16 PM VXAlgo ES X1 Oversold signal
1:30 PM Market flipped bearish on VX Algo X3!

$SPY & $SPX — Market-Moving Headlines Wednesday Jan 28, 2026🔮 AMEX:SPY & SP:SPX — Market-Moving Headlines Wednesday Jan 28, 2026
🌍 Market-Moving Themes
🧠 AI Confirmation Day
MSFT earnings validate AI spend with positive read-through for NVDA AMD PLTR and the Nasdaq
🏥 Managed Care Shockwave
UNH collapse on Medicare pricing pressures HUM CVS and drags the Dow
🧍 Consumer Confidence Divergence
Confidence plunges despite index highs, widening the gap between markets and households
🥈 Silver Volatility Reset
Silver pulls back from recent highs as margin changes cool leverage while the trend stays in focus
🏦 Fed Decision Risk
FOMC decision and Powell presser dominate flows as markets parse tone on inflation and cuts
📊 Key U.S. Economic Data Wednesday Jan 28 ET
2:00 PM
- FOMC Interest Rate Decision
2:30 PM
- Fed Chair Powell Press Conference
⚠️ Disclaimer: For informational purposes only. Not financial advice.
📌 #SPY #SPX #FOMC #Powell #MSFT #AI #Healthcare #Silver #Macro #Markets #Stocks #Options

What’s Driving the S&P 500 Right Now?Observing the S&P 500 at this stage, I believe the key point is not any single headline, but the fragile balance between expectations and reality. The market is no longer reacting strongly to good news, yet it tends to wobble quickly when faced with less favorable signals—classic behavior after a prolonged rally.
The Fed: It’s No Longer About Rates, but Expectations
The Federal Reserve is not more hawkish than before, but it also hasn’t delivered a dovish signal strong enough to ignite a fresh wave of buying. Most expectations for easing have already been priced in, creating an asymmetric reaction to news: positive developments merely help the market hold its ground, while cautious or ambiguous messages are enough to trigger volatility.
This explains why the S&P 500 can maintain elevated levels but struggles each time it approaches the 7,000 zone. There is no panic selling, yet there is also no catalyst compelling investors to pay meaningfully higher prices.
Inflation and Economic Data: A “No Panic, No Euphoria” Zone
Recent data suggest that inflation is not reaccelerating, but it is also not cooling as quickly as initially hoped. This is an environment where the Fed can afford to wait, and where large investors are in no rush to make aggressive bets.
For the S&P 500, such conditions typically result in sideways movement, technical pullbacks, and trend-based consolidation rather than steep rallies. The market needs clearer data to break out of its current state of hesitation.
Earnings: Capital Is Becoming More Selective
One notable development this earnings season is the increasing divergence beneath the surface. Some heavyweight stocks continue to deliver solid growth and support the index, while many others are offering more cautious forward guidance.
As a result, the S&P 500 is no longer rising in a broad-based manner. The index holds up, but internal momentum weakens, making each advance slower and more fragile. This does not look like a classic distribution top; rather, it reflects a shift from “buy everything” to a more selective allocation of capital.
Global Capital Flows: No Sign of an Exit
Most importantly, there is still no clear evidence that capital is leaving U.S. markets. The U.S. dollar, bonds, and gold are not all rising sharply at the same time—a combination that typically signals a genuine risk-off phase.
As long as large capital remains in place, it is difficult for the broader S&P 500 trend to reverse abruptly.
The Bigger Picture & My View
Combining both technical and fundamental factors, the picture is fairly straightforward: the market is not weak enough to collapse, but not strong enough to break out immediately. This phase tests investors’ patience more than their conviction.
In the near term, the S&P 500 may continue to probe the 6,880–6,900 area. If upcoming data do not deliver negative surprises, holding above the EMA 89 and extending the consolidation could pave the way for another attempt at the 7,000 level in the weeks ahead.
What about you—do you see the S&P 500 as a market on the verge of a breakout, or one that simply needs more time to digest current price levels?

Shib gonna shake out some folkThe liquidity needed to go up IMO is not there yet!
We need to create an value in green box before dipping out of it.
I do think we are in a deep wave 4 correction currently.
Still a risky play fo sho.
NOT FINANCIAL ADVICE

ES (SPX, SPY) Analysis, Key Zones, Levels for Tue, (Jan 27)
BIAS: CAUTIOUSLY BULLISH — Breakout Watch
ES is testing 6,995-6,998 in premarket after rallying from the 6,970 area overnight. We're now less than 0.5% from all-time highs. Asia hit new records, Europe is bid, and risk appetite is at five-year highs according to Goldman Sachs. The path of least resistance is higher - but FOMC Wednesday and Mag 7 earnings create headline risk.
The dip buyers got their fill overnight. Now it's breakout or rejection at 7,000.
OVERNIGHT RECAP
Asia/Europe session was bullish across the board. MSCI Asia regional index hit a new all-time high. South Korean chipmakers rallied despite the tariff headlines. Stoxx 600 pushed higher led by a 21% surge in Puma. US futures followed with S&P +0.3% and Nasdaq +0.7%.
The yen gave back some gains, falling 0.2% as intervention fears cooled slightly. Gold and silver held near record highs. Dollar remained weak near 2022 lows.
Key overnight developments that shifted sentiment:
South Korea's Blue House clarified that the US letter they received was NOT directly related to Trump's tariff announcement. This de-escalates the immediate tension.
Canada's PM Carney said he had a "good conversation with President Trump." Another de-escalation signal.
Japan's Finance Minister Katayama confirmed they will "take action in line with the US-Japan FX agreement" and "closely coordinate with US authorities as needed." The intervention threat remains but is now expected rather than surprising.
BACKGROUND: IRAN TENSIONS
Trump told Axios on Monday that the US has "a big armada next to Iran" as the USS Abraham Lincoln carrier strike group entered the region. This is ongoing posturing, not a new headline — markets have already digested it. Watch for any escalation but this is not driving price action today.
WHAT'S DRIVING THE RALLY
Goldman Sachs strategists note that investor appetite for risk is at its greatest level in five years. Economic confidence is overcoming geopolitical concern.
Micron surged 5% in premarket after announcing plans to expand memory chip production. This is bullish for the semiconductor complex and supports the AI infrastructure narrative heading into Mag 7 earnings.
The three-year bull market continues to find buyers on every dip. Investors are looking to earnings this week to validate the AI-driven rally.
SCHEDULED CATALYSTS
Tuesday 10:00 AM: Consumer Confidence
Wednesday 2:00 PM: FOMC Decision (97% hold expected)
Wednesday 2:30 PM: Powell Press Conference
Wednesday After Close: Microsoft, Meta, Tesla earnings
Thursday 8:30 AM: Q4 GDP Advance (Atlanta Fed tracking 5.4%)
Thursday After Close: Apple earnings
Friday 8:30 AM: Core PCE (Fed's preferred inflation gauge)
The FOMC is fully priced for a hold at 3.50-3.75%. The market will trade Powell's tone. Hawkish = pullback. Dovish = breakout fuel.
Mag 7 earnings Wednesday night are the main event. These can swing ES 50+ points. Microsoft and Meta expectations are high. Any disappointment could trigger a sharp reversal from 7,000.
SUPPORT AND RESISTANCE ZONES
RESISTANCE
R2: 7,015 to 7,025
Extension target if 7,000 breaks cleanly. This is where profit-taking kicks in on breakout longs.
R1: 6,997 to 7,005
Current battle zone. Overnight high 6,998.75 and psychological 7,000. Must break and hold above 7,005 to confirm breakout.
SUPPORT
S1: 6,985 to 6,990
Overnight support and VWAP area. First level to buy if we pull back. Expect bids here.
S2: 6,970 to 6,978
Prior value area and overnight rally base. Strong support. If this holds on a pullback, bullish structure intact.
S3: 6,952
Monday's low. Losing this invalidates bullish structure and opens gap fill to 6,920-6,940.
PRIMARY SETUP: BREAKOUT LONG
We're at the door. The overnight session was bullish, de-escalation headlines are hitting, and risk appetite is at five-year highs. The setup favors a breakout above 7,000.
Trigger: Clean break and hold above 7,000 for 5+ minutes
Entry: 7,002 to 7,005 on the retest. Do NOT chase the initial spike. Wait for price to break above 7,000, pull back, and hold it as support.
Stop: 6,993
Target 1: 7,015 to 7,020 (take partials, move stop to breakeven)
Target 2: 7,035 to 7,040 (trail remainder)
Risk: 10-12 points
Reward: 15-35 points
R:R: 1.5:1 to 3:1
If the breakout fails and we reject back below 6,995, do NOT take this setup. Wait for price to pull back to S1 (6,985-6,990) or S2 (6,970-6,978) and reassess for a dip buy.
RISK FACTORS
Government Shutdown — 77% probability by Friday. Senate Democrats blocking DHS funding after Minneapolis shootings. Partial shutdown likely but markets typically shrug off short shutdowns.
Minneapolis Unrest — Two citizens killed by federal agents this month. Protests ongoing. Driving the shutdown standoff and adding political uncertainty.
Trump Tariffs - South Korea 25% threat de-escalated slightly with Blue House clarification. Canada conversation "good" per PM Carney. Still watch for headline risk.
Iran - USS Abraham Lincoln now in region. Tensions ongoing but not escalating today. Background noise unless new headlines hit.
Overbought Technicals - Daily oscillator at 110 (extreme). We're extended and due for mean reversion eventually, but momentum can stay overbought longer than expected in trending markets.
RISK MANAGEMENT
Reduce position size by 50% this week
No overnight holds through Wednesday earnings
Take quick profits at resistance
Use breakeven stops once in profit
Be ready to flip direction on headline surprises
The market can move 30-50 points on a single headline. Capital preservation first.
BOTTOM LINE
Bulls are in control. We rallied overnight, de-escalation headlines are hitting, and risk appetite is at multi-year highs. The setup favors a breakout above 7,000.
But this is FOMC week with Mag 7 earnings Wednesday night and a government shutdown Friday. The breakout needs to happen with conviction or we risk a "buy the rumor, sell the news" reversal.
Key question: Can ES break and hold 7,000 before FOMC? If yes, the path opens to 7,020-7,040. If no, expect consolidation between 6,978-7,000 until Wednesday's catalysts resolve.
Trade what you see, not what you think. Good luck !!!

SPX.. time to buy nowSPX 500 is in a clear upwards channel and has broken the last bit of resistance (white trendline line shown) - this is a clear confirmation that the next target will be the next resistance zone to the upside shown above (this is a great buy trade opportunity) - time to buy SPX 500 now...
S&P500 short-term Channel Up targeting 7040.The S&P500 index (SPX) has been trading within a highly symmetrical Channel Up and following last week's Higher Low on its bottom, marginally above the 1D MA100 (red trend-line), we are seeing the new Bullish Leg unfolding.
The previous one, which also bottomed on the 0.786 Fibonacci retracement level rose my a little over +4.00%, similar to the Bullish Leg before. With the 4H RSI entering a slow down phase just below its 70.00 overbought level, we expect the price rise to get more neutral as well. Regardless of the pace, we expect the index to reach 7040 at least before pulling back towards the bottom of the Channel Up.
Note that only a 1W closing below the 1D MA100 can be technically considered as a trend switch to bearish long-term.
---
** Please LIKE 👍, FOLLOW ✅, SHARE 🙌 and COMMENT ✍ if you enjoy this idea! Also share your ideas and charts in the comments section below! This is best way to keep it relevant, support us, keep the content here free and allow the idea to reach as many people as possible. **
---
💸💸💸💸💸💸
👇 👇 👇 👇 👇 👇

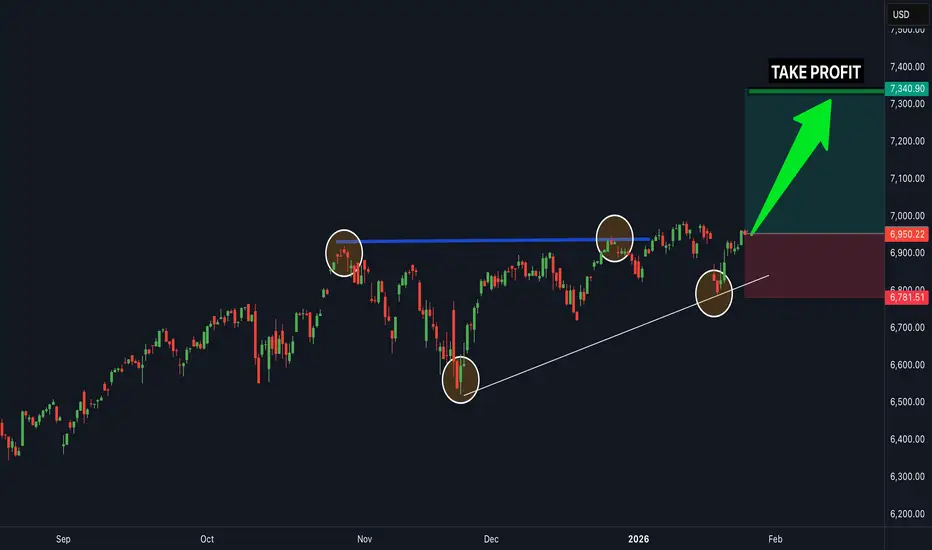
$SPX 6920 To Hold, 7045 NextSP:SPX nicely opened gap down at the 50 Fib and also the bottom of my Bias Zone at 6866 for a long, and price is now 100 points higher. 6920 is the confluence of previous trendline resistance turned support and also 50 Fib. Look for a long off the level for a move up to 7045 magnetic level.

$BTC Tops Then $SPXThe stock market normally tops ~1.5 months after BTC, but it has now continued to rip to ATHs ~3x that amount of time!
Dec 11, 2017 (BTC peak) to Jan 22, 2018 (SPX peak) = 43 days
Nov 8, 2021 (BTC peak) to Dec 27, 2021 (SPX peak) = 44 days
Oct 6, 2025 (BTC peak) to January 26, 2026 (SPX today’s date ATH) = 113 days
Is crypto broken?

$SPY & $SPX — Market-Moving Headlines Tuesday Jan 27, 2026🔮 AMEX:SPY & SP:SPX — Market-Moving Headlines Tuesday Jan 27, 2026
🌍 Market-Moving Themes
🥈 Silver Squeeze Escalation
Silver breaks out above 105 with miners ripping AG PAAS and attention on CDE SLV SILJ
🧠 Microsoft Earnings Gravity
MSFT drifts ahead of earnings with AI monetization nerves and read-through risk for PLTR NVDA QQQ
🚗 Mexico Tariff Threat
Trump floats 100 percent tariffs on Mexican-made cars putting pressure on F GM STLA and keeping TSLA firm
₿ Bitcoin 100k Print
BTC tags 100,000 with catch-up focus on miners CLSK MARA and broader anti-fiat flows
📊 Key U.S. Economic Data Tuesday Jan 27 ET
9:00 AM
- Case Shiller 20 City Home Price Index Nov: 1.3%
10:00 AM
- Consumer Confidence Jan: 90.0
⚠️ Disclaimer: For informational purposes only. Not financial advice.
📌 #SPY #SPX #Macro #Earnings #MSFT #AI #Silver #Crypto #Markets #Stocks #Options

US Government Shutdown - $BTC & $SPX PerformanceUS GOVERNMENT SHUTDOWNS
PAST PERFORMANCE FROM BITCOIN AND S&P 500
Doesn't make much sense to look any further back than 2008 since that's when the entire monetary world order reset and a new playbook was introduced.
*Note 2013 was the first shutdown in this new monetary regime.
Really only worth looking at 2018 and 2025 shutdowns however since those were post-election years, both under Trump.
Can't wait for the "but this is only two data points" bros to chime in here 😂
February is going to be a ROLLERCOASTER 🎢
Remember the exit strategy playbook…
Feb. should present a great buying opportunity ~$70K CRYPTOCAP:BTC to sell into March strength before Tax Season wipes out the market once again and BTC crawls back down to at least $58k.

5-10% Correction for S&P500 incoming SPX is at the 1.618 fib level measured from Jan 25 high and April low.
This fib level acted as a temporary resistance in all major bear Markets (except 2020) with drawdowns between 5 and 10%.
A breach of the 200 DMA and Jan 25 high and April low anchored VWAP is unlikely.

Is NVIDIA’s AI Boom Hitting a Wall?NVIDIA is the engine behind the global AI boom. From data centers to gaming and high-performance computing, its chips power the most advanced technology on the planet. Over the last two years, NVDA became the market’s biggest winner. Now, it has suddenly slowed down, and investors are asking why.
The stock is down about 12 percent from its all-time high of 212 dollars and closed at 186.23 dollars on January 27, 2026. Even after the pullback, NVIDIA is valued at an eye-watering 4.53 trillion dollars and trades at a P/E ratio of 46. That valuation assumes near-perfect execution, and the market is no longer willing to blindly chase it. After one of the strongest rallies in tech history, NVDA has spent months moving sideways. On the chart, the price is trapped inside a symmetrical triangle, a classic sign of indecision. It is not breaking higher, and it is not breaking lower. Everyone is waiting for something to give.
The biggest reason for this pause is geopolitical, not technical. NVIDIA appeared to secure a massive win with reported orders for more than two million H200 chips from Chinese tech companies, potentially worth around 54 billion dollars. At roughly 27,000 dollars per chip, this deal could have pushed the stock into a new valuation zone. But reality hit fast. Chinese customs blocked H200 shipments just days after the U.S. approved exports under a 25 percent tariff. According to industry sources, the message from Beijing was severe enough to feel like a temporary ban. NVIDIA’s suppliers have already slowed production, and that massive opportunity could disappear almost overnight.
Even if China eventually allows the chips, the math is no longer attractive. A 25 percent tariff means NVIDIA would lose a large chunk of revenue to the U.S. government. Higher prices also make Chinese buyers less enthusiastic, especially as Beijing pushes companies toward domestic alternatives from players like Huawei. This situation risks accelerating China’s long-term shift away from U.S. technology, threatening a market worth tens of billions of dollars every year.
Despite these risks, Wall Street remains optimistic. Analysts still rate NVDA a Strong Buy, with an average price target near 259 dollars, implying roughly 36 percent upside. Some firms, including Evercore ISI, see far higher levels if execution stays flawless. Confidence was also reinforced after CEO Jensen Huang called AI the largest infrastructure buildout in human history and backed that view with a 2 billion dollar investment in CoreWeave to expand AI data centers.
The outlook is clear but tense. NVIDIA is not broken. It is dominant, expensive, and stuck between massive opportunity and serious geopolitical risk. The long consolidation suggests the next move could be powerful. Whether it breaks higher or resets lower will depend less on charts and more on politics, pricing, and how much perfection the market is still willing to pay for.

SPX: FOMC and earnings week fuels volatility For the second week in a row markets continue to trade in a mixed mood. There are a lot of uncertainties related to politics, geopolitics and its impact on the economy and business of US companies. This week the gathering of prominent political and business people occurred in Davos, but it seemed that the main topic of the meeting was Greenland and the next move of the U.S. Administration. In addition, there were also announcements regarding potential new tariffs on goods from Canada and the European Union, which all put investors into a continuous risk-on-risk-off mood. The S&P 500 reached its lowest weekly level at 6.791, but tried to recover from this level for the rest of the week, closing it at 6.915.
Tech companies were among those who were adding to the value of the index. Nvidia climbed by 1,5%, while Advanced Micro Devices was traded higher by almost 2%. Microsoft and Google also posted solid weekly results. On the opposite side was Intel, which dropped by 17% for the week. Although its quarterly results beat market expectations, still, a guidance for the next quarter did not satisfy investors' appetite for the risk and Intel's shares dropped.
The week ahead brings the FOMC meeting and interest rate decision. Some volatility might be expected around and on Wednesday, when the meeting will occur and Fed Chair Powell's address to the public. As per current odds, there is a 95% chance that the Fed will not cut interest rates at this meeting. Also the week ahead will be important as some big names in tech are posting their quarterly results, including Apple, Microsoft, Meta Platforms, Tesla, IBM, Intel. Based on these data, we can expect another volatile week on the US equity markets.
