SPY Weekly Outlook – Week 3 of 2026 (Jan 19–23)SPY Weekly Outlook – Week 3 of 2026 (Jan 19–23)
Technical Look:
As expected last week, price found support at the 687.5 level and continued its upside move. We discussed that if SPY failed to push toward 700 on Monday’s open, a post CPI pullback toward 687.5 could occur. That scenario played out precisely on Wednesday, with price retracing into the 687.5 zone and finding support there.
As I mentioned in my Wednesday Mid Week Update, this reaction marked a shift back to a bullish structure, with upside targets at 691.75 – 694 – 695.25. I also stated that I would exit all call positions at 695.25, and price reached that level exactly before getting rejected.
(Please refer to the linked idea for visual reference.)
Scenarios – Prediction:
At this point, I am tracking two possible scenarios for SPY.
Scenario 1: Bearish Scenario (Higher Probability)
This is currently the more likely scenario, mainly due to the macro backdrop, including Trump–EU tensions and potential EU tariffs related to Greenland.
I believe price may open the week with a sharp downside move.
My bearish targets are:
686 – 679.75 – 669.5
If price breaks 686 aggressively and closes a 4H candle below it, I would expect a move toward 679.75.
Similarly, if 679.75 is broken decisively and holds below, price could extend toward 669.5.
Each of these bearish targets also represents a potential bounce or reversal zone, so I prefer taking partial profits (around 1/3) at each level.
If price breaks 686 decisively, I would look to engage on the short side using put options.
Scenario 2: Bullish Scenario
This scenario becomes valid only if Trump EU tensions ease before the market opens (with Monday being a holiday and trading resuming on Tuesday).
The 695 level acts as a call wall in options positioning for SPY. If price breaks above 695 aggressively, I would look to buy calls on a retracement, targeting a move toward the 700 area.
Position Management Notes:
I manage risk by scaling out of positions at key reaction levels and adjusting exposure as structure confirms. Partial profit-taking at major levels is a core part of my approach.
I share deeper US Market breakdowns and weekly scenario updates on Substack. Link is in my profile.
This analysis is for educational purposes only and reflects my personal opinion. It is not financial advice.
SPX (S&P 500 Index)

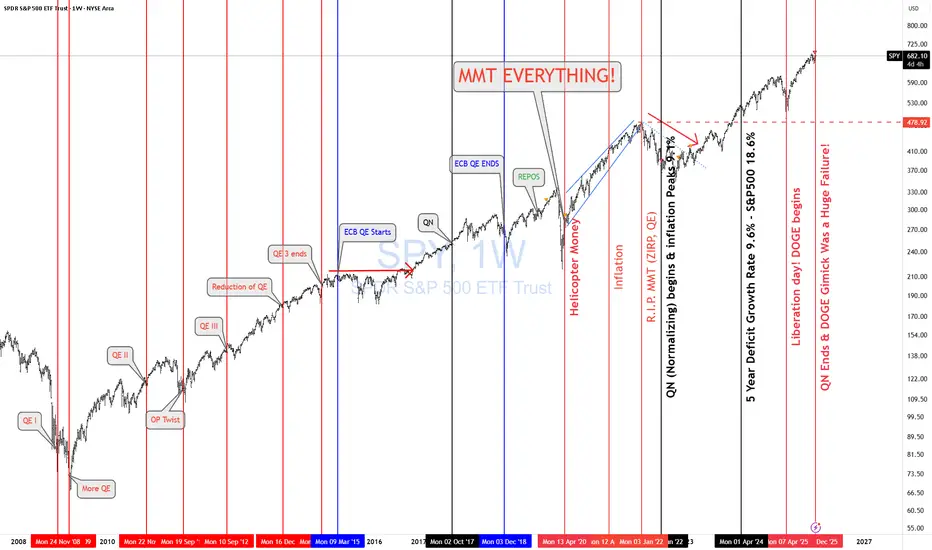
SPY & Macro HistoricalToday FED ended QN (Quantitative Normalizing NOT "T" = tightening. 1st, you normalize, then you tighten. Right??)
The Fed is continuing to let mortgage-backed securities roll off its balance sheet, while the U.S. Treasury increases T-bill issuance (cash-like instruments). That combination means more gov securities are hitting the market even as the Fed’s balance sheet stays roughly unchanged.
More Treasury supply + no Fed buying = higher yields and tighter liquidity. More MBS roll-off = higher mortgage rates and pressure on housing. Treasury bills soak up cash, while longer bonds suffer.
🔥 REALMACRO summary:
The Fed is doing this to:
Get out of the mortgage market.
Strengthen the Treasury bill market (the foundation of dollar liquidity).
Keep bank reserves “ample” without restarting QE.
This combo lets them tighten just enough to cool asset prices, without breaking the plumbing again like in 2019.
The success of this experiment will largely determine how long the Fed can avoid returning to QE. If liquidity tightens too far as the economy continues to weaken, they’ll be forced back into some form of balance sheet expansion sooner rather than later.
Lastly, let's check how right I was when I posted "MMT Everything."
As of April 2020, US debt was $ 24T. Today, it is $38T, representing a total increase of $14T in 5 years.
✅ CAGR ≈ 9.6% per year
✅ S&P 500 CAGR (Apr 2020 → Today): ~18.6% per year
Both are completely unsustainable growth rates.
I nailed that back in April 2020. Trump & MMT "print and play" will be the death of us! SIGH!
Lastly, the DOGE gimmick was a complete and total failure as expected. No reduction in deficit and no fraud found. Imagine that!
As I keep saying, " NEVER INVEST IN TOXIC PEOPLE! THEY WILL ALWAYS BURN YOU IN THE END!" It's not political it's a FACT!
THANK YOU for getting me to 5,000 followers! 🙏🔥
Let’s keep climbing.
If you enjoy the work:
👉 Drop a solid comment
Let’s push it to 6,000 and keep building a community grounded in truth, not hype.
ES (SPX, SPY) Analysis, Key Zones, Setups for Wed, Jan 21
Today was the worst session since April - S&P 500 dropped 2.1%, wiping out 2026 gains. The catalyst? Trump's Greenland tariff escalation ahead of Davos. 10% tariffs on 8 EU countries starting Feb 1, rising to 25% by June 1. Supreme Court declined to rule on tariff authority today, extending uncertainty at least another month.
Critical Event Tomorrow: Trump's Special Address at Davos runs 8:30-9:15 AM ET - directly overlapping cash open. This is the primary catalyst. Any headline could swing markets 50+ points.
ECONOMIC CALENDAR - JAN 21
- 8:30 AM ET: Housing Starts & Building Permits
- 8:30-9:15 AM ET: TRUMP DAVOS SPEECH
- 10:00 AM: Pending Home Sales
Housing data releases simultaneously with Trump's speech - expect it to be overshadowed entirely.
TECHNICAL STRUCTURE
Daily: Price at 6,848.50 holding above 1.618 fib (6,834.50). Premium-to-discount transition in progress after rejection at HH near 7,040.
4H: CHoCH+ triggered at 6,923 confirming bearish shift. Price trading in discount below Equilibrium (6,923.25). Key fibs: 1.272 (6,873.50) | 1.618 (6,834.50) | 2.0 (6,791.25). PWL at ~6,923.25.
1H: Clear LH → LL sequence. PWH at 7,020 (premium trap). BOS confirmed. PML at 6,764.75.
KEY ZONES
RESISTANCE (Shorts):
- 6,865-6,875: VWAP + 1.272 Fib - first rejection zone
- 6,896-6,905: NYAM.H (6,904.75) + Asian resistance
- 6,920-6,935: CHoCH+ origin + Equilibrium - strong supply
- 6,960-6,975: Major liquidity wall (Davos relief rally target)
SUPPORT (Longs):
- 6,834-6,843: 1.618 Fib + AS.H - first bounce zone
- 6,815-6,822: NYPM.L (6,822.25) + 1.272 extension
- 6,791-6,800: 2.0 Fib - psychological confluence
- 6,764-6,780: PML (6,764.75) - STRONG BID expected
SCENARIOS
BEARISH CONTINUATION (60%)
Trump hardlines, no diplomatic progress, EU threatens retaliation.
- Break below 6,834 → 6,791 → 6,764
RELIEF BOUNCE (30%)
"Constructive dialogue" headlines, Feb 1 deadline pushed.
- Squeeze to 6,905-6,920, potential 6,960 extension
CHOP (10%)
Markets await clarity, range 6,820-6,880.
TRADE SETUPS
SHORT @ Premium Rejection
- Entry: 6,896-6,920
- Stop: 6,940
- T1: 6,865 (31-55 pts)
- T2: 6,834 (62-86 pts)
- T3: 6,791 (105-129 pts)
- Confirmation: CVD divergence, absorption failure
LONG @ Discount
- Entry: 6,791-6,800
- Stop: 6,764
- T1: 6,834 (34-43 pts)
- T2: 6,865 (65-74 pts)
- Confirmation: CVD divergence, institutional absorption
RISK NOTES
1. Headline risk EXTREME - size 50-75% of normal
2. Cash open = speech overlap (8:30-9:15 ET)
3. Watch EUR/USD as leading indicator
4. VIX elevated - mean reversion could fuel squeeze
WATCHLIST
- NFLX: Beat earnings, pausing buybacks for Warner deal
- 10Y: 4.29% - above 4.35% = pressure, below 4.20% = relief
- Gold: $4,700+ record - risk-off barometer
- Bitcoin: Cracked $90K
Bearish bias with headline optionality. Structure says lower but Davos = binary risk. Focus 6,920 resistance for shorts, 6,791-6,800 for longs. Let order flow confirm. NOT a session to overtrade.
Good Luck !!!

$SPY & $SPX — Market-Moving Headlines Wednesday Jan 21, 2026🔮 AMEX:SPY & SP:SPX — Market-Moving Headlines Wednesday Jan 21, 2026
🌍 Market-Moving Themes
🌐 Greenland Tariff Panic
Markets sell off sharply as confirmed tariffs on European allies escalate trade-war uncertainty
🟡 Safe Haven Rotation
Gold pushes to fresh record highs as equities and tech absorb risk-off flows
⚡ AI Power Policy Shift
GE Vernova extends gains as focus turns to building new power infrastructure over legacy grid
✈️ Travel Earnings Bright Spot
Airlines outperform on strong earnings and sustained weakness in oil prices
💾 AI Memory Shortage Signal
Storage names rally as demand for AI-related memory outpaces supply despite broader tech weakness
📊 Key U.S. Economic Data Wednesday Jan 21 ET
10:00 AM
- Construction Spending Oct: 0.1%
- Pending Home Sales Dec: 0.7%
⚠️ Disclaimer: For informational purposes only. Not financial advice.
📌 #SPY #SPX #Macro #Trade #Tariffs #Housing #AI #Energy #Markets #Stocks #Options

$SPY the final leg higher, then 20%+ correctionI know there are a lot of people calling for a crash right here, and while I do think we end up getting one, I think there's one last move higher above $700 first.
I think we need to squeeze out the shorts and convince everyone the next leg is starting before we see a move down.
I do think after we hit and reject one of the upper resistances, that it will set up a great short opportunity.
The trigger for the short will be UVIX to hit it's lower support levels combined with SPY hitting it's upper resistances.
Don't know what will cause the move, but I think it'll likely happen even faster than the April move.
So be prepared to exit as we approach the highs or set tight stop losses.

S&P500 vs VIX Is increasing volatility signaling a Bear Cycle?The S&P500 index (SPX) opened considerably lower following the Martin Luther King Jr Day and with that market volatility has started spiking. In fact it's been rising since the week of December 22 2025, approaching levels last seen two months ago in November.
Market volatility is captured by the Volatility Index (VIX) as illustrated on this chart by the black trend-line. We are making a cross asset analysis with S&P500 as such VIX spikes have historically coincided with strong market corrections. Some have just been triggered by shock geopolitical events (such as the Tariff war in February - March 2025 and the March 2020 COVID flash-crash) but most signified proper technical Bear Cycles (2022, 2018, 2015, 2011), occurring harmonically on the market's multi-decade uptrend.
Since we've completed 3 years since the last technical Bear Cycle (2022), the pattern justifies a new one to start this year (2026). The VIX Cycles (red Arcs) come to confirm this as the current VIX rise coincides with roughly the time all previous S&P500 Bear Cycles started.
Interestingly enough, all such corrections tested the 1W MA200 (orange trend-line) and after holding, it initiated the next Bull Cycle. S&P500 hasn't touched its 1W MA200 since October 10 2022. The Feb - March 2025 correction 'only' hit the 1W MA100 (green trend-line) before rebounding. As a result, and based on the 1W MA200 current trajectory, an end-of-2026 test of it could technically take place at 5500 at least.
---
** Please LIKE 👍, FOLLOW ✅, SHARE 🙌 and COMMENT ✍ if you enjoy this idea! Also share your ideas and charts in the comments section below! This is best way to keep it relevant, support us, keep the content here free and allow the idea to reach as many people as possible. **
---
💸💸💸💸💸💸
👇 👇 👇 👇 👇 👇

SPX Has Now Broken Down From Our Wedge As AnticipatedTrading Fam,
It's time. We've prepared. SPX has now broken our wedge to the downside. Another candle on the daily will confirm this bearish move. I expect the 50-day SMA to give us a bit of a bounce. We may retest the underside of the wedge before further moving down at the end of this week or the beginning of next.
Again, as stated in my previous video post, I would expect us to draw back to at least that 200-day SMA in red. More likely, we'll go to support, which intersects with that 350-day SMA (orange) at around 6100. If we go lower and break below that 350-day SMA, we're likely to test the bottom of our channel.
Trade accordingly once confirmation of this bearish move can be had.
✌️Stew

SPX.. buy nowSPX 500 is in a clear upwards channel and has broken the last bit of resistance (white trendline line shown) - this is a clear confirmation that the next target will be the next resistance zone to the upside shown above (this is a great buy trade opportunity) - buy SPX 500 now...

Still waiting for a correction in the S&P 500Still waiting for a correction in the S&P 500 from its peak, around 10% or so.
The correction pattern looks pretty similar to what we saw at the start of 2025, let's see how it plays out this time.
Target: $6250

ES (SPX, SPY) Analysis, Key Levels, Setup for Tue (Jan 20)U.S. cash markets paused on Monday in observance of Martin Luther King Jr. Day, but trading on the Globex platform displayed pronounced volatility amid soaring U.S.-EU trade tensions focused on Greenland. The E-mini S&P 500 (ES) saw a decline of approximately 1.1% from Friday's close, while the Nasdaq-100 (NQ) lagged further, dropping 1.4%. In a shift towards safe-haven assets, gold prices surged to an all-time high of $4,660, driven by a weakening U.S. dollar and strong performance from the Swiss franc.
The catalyst behind the market's movement was President Trump’s announcement of a 10% tariff on eight European NATO allies specifically Denmark, the UK, France, Germany, the Netherlands, Norway, Sweden, and Finland set to take effect on February 1. This tariff is scheduled to escalate to 25% by June 1 unless an agreement regarding Greenland is reached. In response, the EU has activated an emergency protocol and is deliberating potential countermeasures.
Treasury Secretary Bessent, speaking at the World Economic Forum in Davos, expressed optimism about the U.S. economy, stating, “We expect investment to accelerate this year.”
FORECAST
BIAS: Neutral-to-Bearish (Short-Term)
OVERNIGHT THOUGHTS: The Asia and Europe trading sessions are anticipated to test recent overnight lows, with potential for unsuccessful dip-buying efforts at resistance levels.
TUESDAY NY SESSION OUTLOOK: As U.S. traders return to the markets, they will react to the weekend’s accumulated news. An initial attempt at short-covering is expected, likely followed by renewed selling pressure. Failed rallies in the 6920-6935 range may further exacerbate the downward trend.
BULLISH SCENARIO (30% likelihood): A retraction back to 6923 that holds could lead to a gap fill toward the 6950-6960 area.
BEARISH SCENARIO (50% likelihood): A failed rebound at resistance may signal a continuation down to the 6870-6850 discount zone.
CHOPPING SCENARIO (20% likelihood): The market may remain range-bound between 6887-6920 while awaiting clearer catalysts.
INVALIDATION POINT: A sustained break above 6950 would shift the bias towards bullish.
HIGH-IMPACT SCHEDULED ITEMS (ET)
09:30 - US cash equities reopen after MLK Day closure (gap-and-go risk; repricing of Greenland tariff headlines that built up while cash was shut)
10:00 - Supreme Court session begins. Oral arguments scheduled: Wolford v. Lopez (2A), M&K Employee Solutions v. Trustees (pension). Opinions possible but not guaranteed - the tariff case (Learning Resources v. Trump) ruling could drop any session. Court did not pre-commit which decisions will be released. Last courtroom session until Feb 20.
11:30 - Treasury bill auctions (supply event; can jolt front-end yields and spill into ES via rates):
6-week bill auction (announced Thu prior)
4-week/8-week bills settle Tuesday per standard pattern
52-week bill auction possible (every 4 weeks on Tues)
16:01 - Netflix (NFLX) Q4 earnings release - HIGH IMPACT
16:15 - Fed H.10 Foreign Exchange Rates (pushed from holiday)
16:45 - Netflix earnings interview begins
After the close (earnings beta into index futures):
Netflix (NFLX) - major index weight, sentiment driver
United Airlines (UAL)
Interactive Brokers (IBKR)
US Bancorp (USB)
Fifth Third (FITB)
KeyCorp (KEY)
Before the open (also relevant if you trade the open):
3M (MMM)
DR Horton (DHI)
Fastenal (FAST)
WHAT IS NOT ON THE CALENDAR (STILL IMPORTANT)
No top-tier BEA macro prints (GDP/PCE/Income) scheduled for Tue Jan 20 per BEA release schedule
No major BLS releases scheduled for Tue Jan 20 per BLS January schedule
No FOMC meeting - next meeting is Jan 27-28
Fed note: Daily/weekly statistical releases scheduled on the holiday (Mon) are pushed to Tuesday - H.10 at 4:15 PM, H.8 on Thu. Can nudge rates/liquidity expectations.
Trump v. Cook (Fed's Cook firing case) oral arguments are Wednesday Jan 21 - could create Fed-related headline risk heading into that session
WATCH LIST (UNSCHEDULED BUT HIGH PROBABILITY)
EU tariff retaliation announcement - emergency meeting concluded, response expected
Trump/Bessent comments from Davos
Any SCOTUS tariff ruling leak or rel
Good Luck !!!

S&P Futures Trading Day 91 — Why Low Volume Saved This Support LEnded the day +$642.50 trading S&P Futures. I've been eyeing the 6893 level for days as a major zone to watch—it’s our critical 97-minute MOB. When we opened -60 points last night, I realized the probability of dropping into that zone was high, so I set a cluster of orders between 6896 and 6890 to catch the move. My thesis was simple: with it being a holiday, the low volume meant we likely wouldn't have the momentum to break such a key support, setting up a hard bounce. The plan executed perfectly.
Day 91— Trading Only S&P Futures
Daily P/L: +642.50
Sleep: 6 hours
Well-Being: Good
🔔News Highlights: U.S.-EU Tariff War
📈Key Levels for Tomorrow:
Above 6935= Bullish Level
Below 6935 = Bearish Level

SPX500 Bearish Breakout!
HI,Traders !
#SPX00 made a bearish
Breakout and the breakout
Is confirmed so we are
Bearish biased and we
Will be expecting a further
Bearish move down !
Comment and subscribe to help us grow !

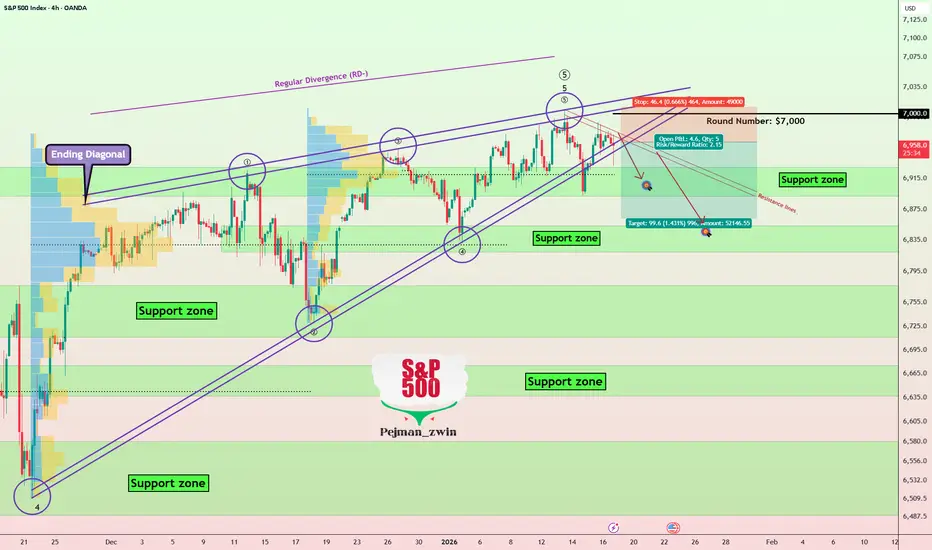
S&P 500 Completes Wave 5 via Ending Diagonal — Correction Ahead?The S&P 500( FX:SPX500 ) is a crucial index in the financial markets, and understanding its trends can greatly help in analyzing other markets, such as cryptocurrencies, especially Bitcoin( BINANCE:BTCUSDT ).
The S&P 500 is currently near its resistance lines, and from a classic technical analysis perspective, it has formed a rising wedge pattern.
From the Elliott Wave perspective, it seems that the main wave 5 in the S&P 500 index has been completed via an ending diagonal.
Considering the ongoing tensions in the Middle East and the U.S. moving its forces to the region, there’s a possibility that these tensions may escalate in the coming days. Therefore, given that the S&P 500 is currently near its all-time highs, and based on our technical analysis, going long might be risky, and I currently favor short positions for the S&P 500.
I expect that after breaking the support zone($6,930_$6,892), the S&P 500 index could drop to around $6,863.
Furthermore, since Bitcoin has a correlation with the S&P 500, a decline in the S&P 500 could also lead to a drop in Bitcoin .
First Target: $6,923
Second Target: $6,863
Stop Loss(SL): $7,009
Points may shift as the market evolves
💡 Please respect each other's opinions and express agreement or disagreement politely.
📌S&P 500 Index Analyze (SPX500USD), 4-hour time frame.
🛑 Always set a Stop Loss(SL) for every position you open.
✅ This is just my idea; I’d love to see your thoughts too!
🔥 If you find it helpful, please BOOST this post and share it with your friends.
SPX: Markets pause amid political noiseU.S. equity markets were not quite happy during the previous week with all political developments, related to the DOJ probe on Fed Chair Powell, political narrative of the US President taking over Greenland, as well tensions in Iran and potential interference of the US. All these topics are bringing insecurity among investors, making them favour gold and silver against riskier assets. The S&P 500 tested ATH at the start of the week, however, the rest of the week was traded at the lower grounds, closing the week at 6.940. The magical number of 7.000, which most investors are expecting for the S&P 500 to reach, at this moment seems on hold.
The season of quarterly results started with tech companies. The Taiwan Semiconductors were specially watched for their performance. The company reported results above forecasts, with a revenue growth of 35% y/y, driven by robust demand for advanced chips, particularly for AI and high-performance computing. Stock gained around 10% on a weekly basis. Also other chip companies were weekly gainers, like Broadcom and Advanced Micro Devices.
On the opposite side were stocks of financial institutions, as the US President announced putting a cap on credit card interest rates. JPMorgan and Bank of America were the ones most hit by this news, as largest banks in the US, with drop in share prices around 5%.
The week ahead brings US PCE data for November, as well as quarterly results for some notable names like Intel, Netflix, Johnson&Johnson, U.S Bancorp and 3M.

Trend is your Friend. #NKE is a prime example...fade the bullish moves
look for continuation down
that is going to be the money maker
shorting into resistance
not longing on reversals

SPX Trades Heavy as 7k Approaches, Rising Wedge BuildsWhile the Russell 2000 has broken out in a very big way to start 2026 and while the Nasdaq 100 holds an ascending triangle formation which points to bullish breakout potential, the S&P 500 has been consolidating deeper and deeper into a rising wedge formation.
I think a part of the reason behind it is obvious, as the 7k level has gotten closer and closer and as that level comes into play, the perceived top-end for bullish continuation gets more and more limited. But - there has been a continued hold of support on pullbacks which is what lends itself to the varying angles of the trendlines making up the formation.
Last week saw the support trendline come into play, and this led to another rally although bulls were unable to take out the prior ATH.
At this point, SPX isn't quite as attractive as the Russell for bullish equity plays as it appears as though we're seeing a late-stage broadening in the rally that began a few years ago. Structurally, given the higher-highs that have continued to post in SPX, there would be a more optimistic argument for continuation here rather than the Nasdaq, but timing for that is difficult as the Nasdaq, at the least, holds a bullish breakout formation via the ascending triangle. - js

SPY Mid-Week Update (Jan 15–16)SPY Mid-Week Update (Jan 15–16)
Technical Look:
As mentioned in my Sunday SPY Weekly Prediction, price followed the downside move exactly as expected. The market reached 687.50, which I labeled as Bearish Target 1, and once again behaved in line with the outlined plan.
After price printed a daily close back above 687.50, a reversal confirmation was triggered from that level.
Prediction – Outlook:
In my view, once SPY secured a daily close above 687.5, the upside move started to develop. Based on this confirmation, I entered my call contracts approximately one hour before the market close.
I am currently expecting the following upside targets, in sequence:
691.75 – 694 – 695.25
The 688–689 zone now acts as a key support area, where price may find support if a pullback occurs. That said, it is also possible for the market to open strong and continue directly toward the bullish targets without a meaningful retracement.
Bearish Scenario:
If price breaks strongly and closes above the 686 level, I will exit my call positions and look to buy puts from that level. In this scenario, my downside target would be 680.
Options flow shows a concentration of a put wall around the 680 level. Price may first run toward 691.75 and then reverse back to the downside, shifting into a bearish move.
Position Management Notes:
Once price reaches the first target, I plan to close 1/2 of my position and move the stop loss on the remaining size to breakeven. This is how I personally manage my positions.
I share deeper US Market breakdowns and weekly scenario updates on Substack. Link is in my profile.
This analysis is for educational purposes only and reflects my personal opinion. It is not financial advice.

Is The Price Of Silver Telling Us What The Dollar Is Going To DoTrading Fam,
I am sensing some events on the horizon, and the charts seem to confirm what I am feeling. I want to let you know what I am seeing. We’ll talk Silver, the dollar, S&P500, Bitcoin, and Ethereum in this video. Don’t shoot the messenger.
✌️Stew

ES (SPX, SPY) Analysis, Key Levels, Setup for Fri (Jan 16)
The S&P 500 futures market is signaling renewed optimism heading into Friday's session, buoyed by a powerful earnings report from Taiwan Semiconductor Manufacturing Co. and resilient labor market data that together have eased concerns about the durability of the artificial intelligence trade.
E-mini S&P 500 futures extended gains for a second consecutive session, settling Thursday near 6994, advancing 12.25 points, or 0.18%, from the prior close of 6981.75.
The catalyst proved to be TSMC's fourth-quarter results, which showed profit growth of 35% and a commitment to capital expenditures of $52 billion to $56 billion in 2026. The guidance dispelled fears that hyperscaler spending on AI infrastructure might be cooling, sending Nvidia Corp. shares up more than 2% and lifting the broader semiconductor complex.
"Taiwan Semi's results today, and more importantly, their capex spending plans, point to reassuring investors that the AI trade is not necessarily a bubble at this point," said Kim Forrest, chief investment officer at Bokeh Capital Partners.
The CBOE Volatility Index fell 5.43% to 15.84, its lowest level in weeks, suggesting options traders see diminished risk of near-term turbulence.
Trade Developments Add Tailwind
Taiwan's Vice Premier confirmed that a bilateral tariff agreement with the United States would be signed within several weeks. The arrangement includes $250 billion in company-led investment alongside $250 billion in credit guarantees a framework the official described as distinct from recent deals struck with Japan and South Korea.
The development carries implications for semiconductor supply chains that remain central to U.S. economic competitiveness. Taiwan emphasized that domestic investment would continue even as companies expand their American footprint, a signal that TSMC's Arizona operations will complement rather than replace its home-island capacity.
Bank earnings provided additional support. Goldman Sachs Group Inc. and Morgan Stanley both exceeded analyst expectations, capitalizing on a resurgence in dealmaking activity. BlackRock Inc. reported record assets under management of $14 trillion.
Labor market data reinforced the constructive tone. Initial jobless claims for the week ending January 10 totaled 198,000, well below the 215,000 economists had forecast—evidence that employment conditions remain firm despite elevated interest rates.
Technical Picture Favors Continuation
From a structural perspective, the daily chart maintains a pattern of higher highs and higher lows, with price holding above a significant volume concentration between 6880 and 6900. Fibonacci extensions derived from the recent swing project potential upside targets at 7149.75, 7226.75, and 7311.75.
The four-hour timeframe shows consolidation between a premium zone near 7025-7050 and equilibrium around 6900. A higher low established at 6923 earlier this week suggests buyers remain willing to defend pullbacks.
On the one-hour chart, a series of bullish momentum signals have confirmed the near-term uptrend. The 6900-6910 zone, representing the prior week's low, now serves as structural support. Overhead, resistance near 7050, where distribution activity would be expected.
Treasury yields present a modest headwind, with the 10-year note at 4.17% as of Thursday's close.
Key Levels
Resistance
7050 → Premium zone, Weak High 39%
7017.25 → PDH (primary target)
7000 → Psychological, PWH area
Pivot
6992.25 → VWAP
6981.75 → Prior Close
Support
6974.75 → PDL (range edge)
6949.50 → ONL
6920-6925 → 1H HL structure
6900-6910 → PWL, critical support
6860 → Strong Low 61%, 1.272 Fib extension
Primary Setup: Long ES at PDL Support
Bias: Bullish above 6992.25 VWAP
Entry Zone: 6974 - 6978 (PDL range edge)
Stop Loss: 6964 (below PDL structure)
Target 1: 6992.25 (VWAP) → Scale 50%
Target 2: 7017.25 (PDH) → Runner at breakeven
Risk: 10-14 points
Confirmation Checklist
- CVD divergence at 6974-6978 (selling exhaustion)
- Bid wall formation / absorption
- Hold above 6970 on retest
- Volume decline into the pullback
Alternative Setups
Long Breakout
Entry: Above 7020 (with retest)
Target: 7040-7050
Stop: Below 7010
Short at Premium
Entry: 7040-7050 (rejection only)
Target: 7020 / 7000
Stop: Above 7060
Long Deep Pullback
Entry: 6920-6925 (1H HL)
Target: 6975 / 7000
Stop: Below 6910
Economic Calendar - Friday Jan 16
8:30 AM ET → Business Leaders Survey (Low)
9:15 AM ET → Industrial Production & Capacity Utilization ⚠️ (High)
11:45 AM ET → NY Fed Staff Nowcast (Low)
Industrial Production is the main event. A beat confirms manufacturing strength and supports continuation toward 7017.25+. A miss could offer pullback opportunity toward structural support.

$SPY & $SPX — Market-Moving Headlines Friday Jan 16, 2026🔮 AMEX:SPY & SP:SPX — Market-Moving Headlines Friday Jan 16, 2026
🌍 Market-Moving Themes
🧠 AI Hardware Euphoria
TSMC earnings smash expectations as AI chip demand described as tight and insatiable
🔧 Semiconductor Capex Wave
TSMC guides higher spending, reinforcing strength across chip manufacturing supply chains
🛢️ Oil War Premium Evaporates
Crude drops sharply after geopolitical tensions ease, erasing recent risk pricing
💻 Hardware vs Software Split
AI capital continues rotating toward chips and infrastructure while software lags
🏦 Bank Rotation Shift
Investment banks rebound on dealmaking strength as consumer banks remain under pressure
📊 Key U.S. Economic Data Friday Jan 16 ET
9:15 AM
- Industrial Production Dec: 0.1%
- Capacity Utilization Dec: 76.0%
10:00 AM
- Home Builder Confidence Index Jan: 40
⚠️ Disclaimer: For informational purposes only. Not financial advice.
📌 #SPY #SPX #Macro #Earnings #AI #Semiconductors #Oil #Fed #Markets #Trading #Stocks #Options

$SPY & $SPX — Market-Moving Headlines Thursday Jan 15, 2026🔮 AMEX:SPY & SP:SPX — Market-Moving Headlines Thursday Jan 15, 2026
🌍 Market-Moving Themes
⚛️ Oklo Volatility Reset
Oklo stabilizes after insider-sale panic as nuclear-for-AI narrative stays dominant
🏦 Bank Stress Hangover
Banks remain under pressure as credit card rate-cap risk overwhelms earnings prints
🟡 Anti-Fiat Bid Expands
Gold silver and Bitcoin hold strength amid Fed political pressure and risk-off flows
💻 Hardware Over Software
Intel strength reinforces rotation toward physical AI infrastructure over legacy software
🛍️ Retail Fracture Signal
Saks bankruptcy raises concerns around luxury demand as value retail gains mindshare
📊 Key U.S. Economic Data Thursday Jan 15 ET
8:30 AM
- Initial Jobless Claims Jan 10: 215K
- Import Prices Nov delayed: -0.2%
- Empire State Manufacturing Jan: 1.0
- Philly Fed Manufacturing Jan: -4.5
⚠️ Disclaimer: For informational purposes only. Not financial advice.
📌 #SPY #SPX #Macro #Inflation #Jobs #Fed #Markets #Trading #Stocks #Options

ES (SPX, SPY) Analysis, Key Levels, Setups for Thur (Jan 15)
The E-mini S&P 500 (ES) closed at 6,961.50, down 40.25 points or 0.57% from the previous day's close of 7,001.75. This marks the second consecutive decline, with the technology sector leading the losses.
Session Highlights:
- Prior Day High (PDH): 6,979.75
- Prior Day Low (PDL): 6,923.25
- Overnight High (ONH): 7,002.50
- Overnight Low (ONL): 6,963.50
- Volume Weighted Average Price (VWAP): 6,947.00
- Value Area High (Y-VAH): 6,957.50
- Point of Control (Y-POC): 6,940.50
- Value Area Low (Y-VAL): 6,927.50
The session featured a cautious tone, opening at 6,972.25 and briefly testing a low at 6,926.50 through New York afternoon hours. Buyers emerged near a critical cluster of support, allowing for a slight recovery ahead of the close, although the overall day ended on a negative note. The market is seeing a risk-off rotation as technology underperforms, whereas energy stocks reached all-time highs and precious metals rallied, with silver increasing by over 6% to above $92.
---
Key News and Catalysts
1. Semiconductor Tariffs (High Impact)
President Trump has implemented a 25% tariff on advanced computing chips including NVDA’s H200 and AMD’s MI325X. Certain exemptions are in place for chips used in data centers, startups, and public sector applications. The White House cautioned that additional tariffs could be imposed soon.
2. CPI/PPI Data (Released January 14)
December's Consumer Price Index (CPI) met expectations, but the Core CPI revealed weaker-than-anticipated results. The Producer Price Index (PPI) rose by 0.2% in line with forecasts. Analysts believe this data will likely lead the Federal Reserve to maintain its current stance through at least March.
3. Retail Sales (Released January 14)
November retail sales data were released post-shutdown, showing a better-than-expected increase of 0.6%, surpassing the predicted growth of 0.5%, thus reinforcing the narrative of consumer strength.
4. Bank Earnings
Bank of America reported earnings exceeding projections (98 cents vs 96 cents expected), while Wells Fargo fell short on revenue targets. The market awaits reports from Goldman Sachs, Morgan Stanley, and BlackRock, which could further influence the financial sector.
5. Geopolitical Developments
- Ongoing discussions regarding Greenland in the White House
- A Supreme Court ruling on tariffs may come soon
- Arguments concerning Federal Reserve independence are scheduled for January 21
---
Economic Calendar for January 15
8:30 AM ET (6 releases):
- Initial Jobless Claims: Expected 215K | Prior 208K
- Empire State Manufacturing Index: Expected +1.1 | Prior -3.9
- Philadelphia Fed Manufacturing Index: Expected -2.9 | Prior -10.2
- Import Prices MoM: Expected 0.0% | Prior +0.1%
- Export Prices MoM
- Continuing Claims
10:00 AM ET:
- Business Inventories: Expected +0.1%
- Existing Home Sales
Note: Future retail sales release dates remain to be determined by the Census Bureau due to ongoing data verification from the shutdown period.
---
Overnight Session Forecast
Asia Session (6:30 PM - 2:00 AM ET)
Bias: Neutral to Slightly Bearish
- Markets in Japan, China, and Hong Kong will react to the chip tariff announcements, while India is closed for local elections. Initial volatility is anticipated with a test of the overnight low at 6,963.50 expected, particularly focusing on Asian semiconductor stocks like TSMC and Samsung.
London Session (2:00 AM - 6:00 AM ET)
Bias: Neutral, Range-Bound
- With several significant UK data releases approaching, including GDP and Industrial Production, market participants should monitor for potential movements in the Euro Stoxx 50, which is at record highs. The anticipated trading range is set between 6,940 and 6,980, pending US data developments.
Pre-Market/NY Open (6:00 AM - 9:30 AM ET)
- Earnings from Goldman Sachs, Morgan Stanley, and BlackRock will influence market sentiment. The upcoming Philly and Empire Fed surveys will offer insights into the manufacturing sector, along with initial jobless claims data expected to provide a gauge on the labor market.
---
Key Resistance Zones
R1: 6,979.75 | PDH
R2: 7,002.50 | ONH + Psychological level at 7K
R3: 7,040 - 7,050 | January Swing High
R4: 7,094.50 | 1.272 Fibonacci (1H)
R5: 7,113.25 | 1.272 Fibonacci (4H)
R6: 7,149.75 | 1.272 Fibonacci (Daily)
R7: 7,161.75 | 1.618 Fibonacci (4H)
Key Support Zones
S1: 6,947 - 6,952.50 | VWAP + Asian Session Low
S2: 6,927.50 - 6,940.50 | Y-VAL to Y-POC cluster
S3: 6,923.25 | PDL / Equilibrium
S4: 6,880 - 6,900 | PWL zone
S5: 6,800 - 6,788 | PML + Major Weekly Support
The 6,923-6,940 range presents a significant confluence of support.
---
Trade Setups for Tomorrow
Primary Setup: Value Area Bounce (Long)
Context: With the bull market intact, the price is positioned within a value area, finding support below.
- Entry Zone: 6,927 - 6,940
- Trigger: Bullish displacement from support
- Stop Loss: Below 6,918
- Targets:
- Target 1: 6,965
- Target 2: 6,979.75
- Target 3: 7,002.50
Risk-Reward Calculation (for an entry at 6,935 and stop at 6,918):
- Risk: 17 points
- Target 1 Reward: 30 points → 1.76:1
- Target 2 Reward: 44.75 points → 2.63:1
- Target 3 Reward: 67.5 points → 3.97:1
Invalidation: A close below 6,918 with follow-through.
Secondary Setup A: ONH Breakout (Long)
- Entry Zone: Above 7,002.50
- Trigger: 15-minute close above ONH with volume
- Stop Loss: Below 6,985
- Targets:
- Target 1: 7,020
- Target 2: 7,040
Note: Target 1 alone presents unfavorable risk-reward; focus on achieving Target 2 with partial at Target 1.

Jan 14 Trade PlanThe market has been sneaky and yesterday it almost fooled me as premarket after CPI data it reached 6997 but that was a bull trap... So, as always as much as I can I try to be as objective as I could and ignore the noise. I pick up calls but it didn't work well as the market in the last 8 minutes crossed 6963 which was not enough for me, however, it is enough for the narrative.
Objectively and ignoring all the noise here's my levels:
6945 has been respected and the market trapped bears as it broke it for a couple of minutes and came back with strength.
Respecting 6945 gives me a clear 7000
after clearing 7000 we will dig into the new targets.
My position as long as we keep respecting 6945 is CALLS all the way... because it confirms a higher low and that gives us new higher highs.. breaking it will take us back to 6920 then 6900 followed by 6880, breaking the latter = bear market.
Will update you as we go.
GOOD LUCK!
remember all of this is my personal narrative & reading and it is not an ADVICE.
