LONG SPX - Bullish Sunday BetGood technical backdrop for a bullish Sunday bet on the S&P500. Long SPXUSD
SPXUSD

SPX500USD 2021 Feb 15 Week
OANDA:SPX500USD
SPX500USD 2021 Feb 15 Week
Red/Green zones = preferred entry
Grey = price rotation zones
Last week's long targets
3938 = reached
3913 = reached
Support1 = 3905
Support2 = 3885
Support3 = 3868.8
Demand has come in, will maintain long on dip as long as buy volume can be sustained,
or on rest of 3931 level.
If in the near future reversal price action occurs and close below 3930.90,
then will consider change in direction to short.
Have a safe and profitable trading week.
Like and follow if you find this useful : )
Gong Hei Fatt Choi & Happy Chinese New Year to my Chinese friends!

SPX500 - distributionBefore the Chinese New Year.
I think we will go for a correction.
China is the engine of the global economy.
After the Chinese New Year I expect growth in all markets.
Push like if you think this is a useful idea!
Before to trade my ideas make your own analysis.
Write your comments and questions here!
Thanks for your support!

SPXUSD going short , waiting for price to retest 3822 SPXUSD going SHORT , waiting for price to retest the zone at 3822 for a better risk to reward.

S&P aiming for 4070 - 4200 by MarchPurely RSI and Fibonacci extension based analysis. As you see since the March bottom every Higher High is on a higher Fib extension (0.382, 0.618). Similarly, the Higher Lows have so far followed a 0.382, 0.5, 0.618 Fibonacci retracement sequence.
The RSI is currently trading sideways since mid November. In the previous two Fib cycles, this RSI consolidation came before the new Higher High. Assuming this sequence is extended, then S&P should soon make its new Higher High within the -0.786 - 1.000 Fibonacci zone, which is within 4070 - 4200.
Most recent S&P signal:
Please like, subscribe and share your ideas and charts with the community!
--------------------------------------------------------------------------------------------------------
!! Donations via TradingView coins also help me a great deal at posting more free trading content and signals here !!
🎉 👍 Shout-out to TradingShot's 💰 top TradingView Coin donor 💰 this week ==> ProjectSyndicate
--------------------------------------------------------------------------------------------------------

SPX bearish craba perfect bearish crab has formed adding more bearish signs, including 5 months of bearish divergences and a rising wedge.


What are your ideas?
TVC:SPX
If you liked the analysis, follow me so that you can be informed of the analysis in the shortest possible time.
Support me with your likes and comments
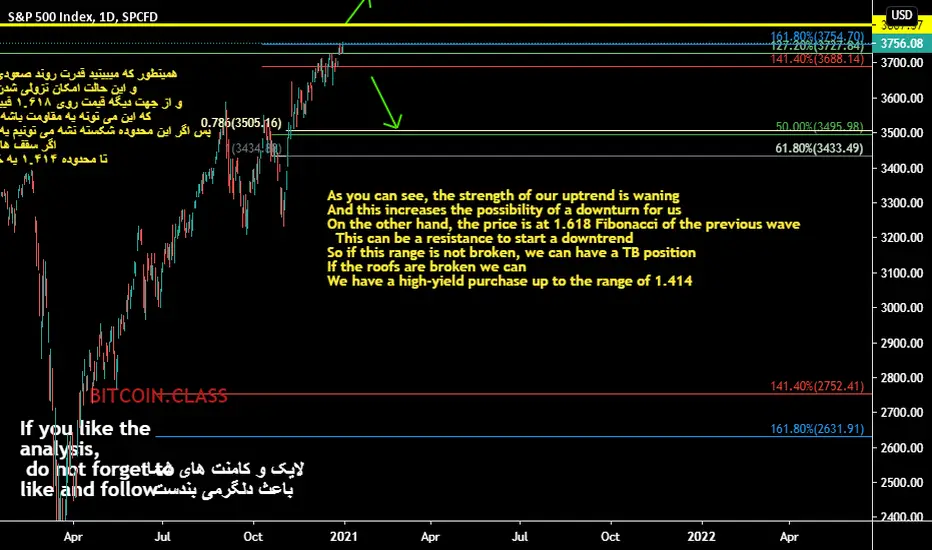
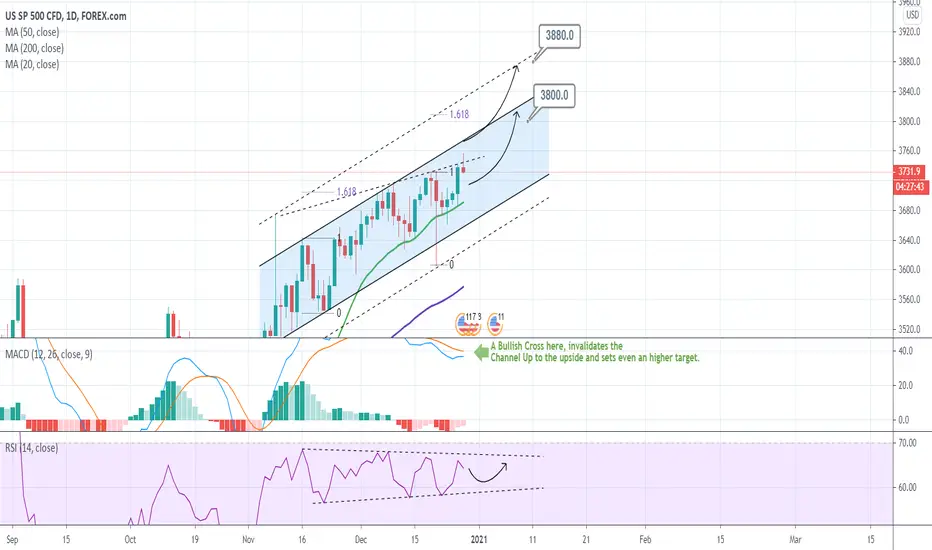
S&P500 aims at 3800Pattern: Channel Up on 1D.
Signal: Buy (a) if the MACD makes a Bullish Cross (every prior 1D Bullish Cross has delivered an extreme rise), or (b) if the RSI approaches its Higher Lows trend-line.
Target: (a) 3880, (b) 3800
** Please support this idea with your likes and comments, it is the best way to keep it relevant and support me. **
--------------------------------------------------------------------------------------------------------
!! Donations via TradingView coins also help me a great deal at posting more free trading content and signals here !!
🎉 👍 Shout-out to TradingShot's 💰 top TradingView Coin donor 💰 this week ==> TradingView
--------------------------------------------------------------------------------------------------------


[SPX] Trying to Complete the Megaphone Structure! UH OH...I think a lot of people will try to buy this dip but seems like a mistake.
At this level with everything going in its favor it can't even hold over the 5Y Peak Channel more than a few days.
If one thing turns sour, this market is proper fcked.


SPXUSD SELL TP_3232.4_10.44%_376.8pips_SL_3676.1_1.85%_66.9pipsSPXUSD SELL TP_3232.4_10.44%_376.8pips_SL_3676.1_1.85%_66.9pips

BTCUSD/SPXUSD fractal updateComparing BTC price to S&P 500 with the long-term BLX symbol. The cycle is obvious. Careful, in the short term, we may have a 20-30% drop while BTC flirts with the ATH. After that, the skies are clear for takeoff. Happy trading!

SP-500 {Bearish Divergence}Hi every one
US SP 500 CFD
no need to say something , chart is speaking it self .
Things can change...
The markets are always changing and even with all these signals, the market changes tend to be strong and fast
Traders, if you liked this idea or have your opinion on it, write in the comments,We will be glad.
Thank you for seeing idea
Have a nice day and Good luck.

SP-500 created { TRIPLE TOP }Greetings!
US SP 500 CFD
As you can see, the triple top is formed. which is a sign of a drop in price
If the price can not break the resistance, the price will fall.
It is the analysis in daily timeframes that raises the importance
chart is speaking it self!!
Take a look at my previous analysis!!
Things can change...
The markets are always changing and even with all these signals, the market changes tend to be strong and fast
Traders, if you liked this idea or have your opinion on it, write in the comments,We will be glad.
Thank you for seeing idea
Have a nice day and Good luck.

SPXUSD SELL TP_2.798_18.92%_651.20pips_SL_3.490_1.42%_48.90pipsSPXUSD SELL TP_2.798_18.92%_651.20pips_SL_3.490_1.42%_48.90pips

SPXUSD BUY IDEASPXUSD H4 VIEW
Thank you very much that you support me with your likes and Comments
If you have another analysis at this pair, please share in comments, I will be glad to discuss with you.

DXY SPX NDX US100 GOLD SILVER BTC -- Exciting timesA general overview of where the markets are trading tonight heading into the first poll closures. Watching the Dollar Index and Resistance on US Markets.
BTC Breakout. Gold & SIlver trying to continue upward momentum. 10yr Bond drop--- Optimism for the bulls but the night is not over yet.

SnP500, a leg low but not that low 😉The trade is still active and its stop-loss moved to profit, just above the local trendline.
The forecast has shown on the chart, plus 2 low and lower possibilities.
Happy Trading, Stay Green! ✌️
➖➖➖➖➖➖➖➖➖➖➖➖➖
💬 Please let me know your view about the idea
🔗 Check out the "Related ideas..." in the links below too
Find us on social media 😉

SPXUSD Showing possible reversal corrective move possibleA lot going on here on the 4 hr chart:
- RSI reach oversold level of 19 and started bullishly diverging for a full day
- 4hr/12hr/Daily Hidden rsi divergence higher low possible
- Macd overstretch diverged and now is crossing up
Possible corrective move back up before doomville?

SP500 AnalysisFOREXCOM:SPXUSD has clear uptrend but it has not broken previous resistance and began to retracement
