$SPY & $SPX — Market-Moving Headlines Week of Feb 2–6, 2026🔮 AMEX:SPY & SP:SPX — Market-Moving Headlines Week of Feb 2–6, 2026
🌍 Market-Moving Themes
💥 Anti-Fiat Unwind
Gold, Silver, and Crypto suffer forced liquidation as capital rotates out of crowded hedges
🧠 AI Earnings Take Center Stage
GOOGL, AMZN, PLTR headline a second straight AI earnings stress test week
🏭 Manufacturing vs Services Split
Weak manufacturing data contrasts with resilient services, complicating the growth narrative
👷 Labor Market Reality Check
ADP, Jobless Claims, and Friday’s Jobs Report will drive Fed cut expectations
🌏 Emerging Market Pressure
India budget selloff highlights fragility across EM, raising spillover risk to EEM
📅 Post-FOMC Re-Pricing
Markets digest last week’s Fed tone through hard data instead of rhetoric
📊 Key U.S. Economic Data — Feb 2 to Feb 6 (ET)
MONDAY, FEB. 2
- TBA Auto sales Jan | Previous: 16.1M
- 9:45 AM S&P flash U.S. manufacturing PMI Jan | Previous: 51.9
- 10:00 AM ISM manufacturing Jan | Actual: 48.4 | Forecast: 47.9
TUESDAY, FEB. 3
- 9:45 AM S&P final U.S. services PMI Jan | Previous: 52.5
- 10:00 AM Job openings Dec | Actual: 7.1M | Previous: 7.1M
- 10:00 AM ISM services Jan | Actual: 53.5 | Previous: 54.4
WEDNESDAY, FEB. 4
- 8:15 AM ADP employment Jan | Actual: 45K | Forecast: 41K
THURSDAY, FEB. 5
- 8:30 AM Initial jobless claims Jan 31 | Actual: 212K | Previous: 209K
- 10:50 AM Atlanta Fed President Raphael Bostic speaks
FRIDAY, FEB. 6
- 8:30 AM U.S. employment report Jan | Actual: 55K | Forecast: 50K
- 8:30 AM U.S. unemployment rate Jan | Actual: 4.4% | Previous: 4.4%
- 8:30 AM U.S. hourly wages Jan | Actual: 0.3% | Previous: 0.3%
- 8:30 AM Hourly wages YoY | Actual: 3.6% | Previous: 3.8%
- 10:00 AM Consumer sentiment prelim Feb | Actual: 54.0 | Previous: 56.4
- 3:00 PM Consumer credit | Actual: $8.0B | Previous: $4.2B
⚠️ Disclaimer: For informational purposes only. Not financial advice.
📌 #SPY #SPX #Macro #JobsReport #NFP #Earnings #AI #Crypto #Gold #Markets #Options
Spy!

SPY Weekly Outlook – Week 4 of 2026 (Jan 26–30)SPY Weekly Outlook – Week 4 of 2026 (Jan 26–30)
Technical Look
SPY moved exactly as expected on the bearish side, reaching its downside targets with the Tuesday open last week and finding a bounce from those levels.
In the Mid Week Update shared afterward, I highlighted that price had transitioned into a bullish structure and that higher targets were now in focus. I’m also linking last week’s outlook on the side for reference.
Scenarios – Prediction
At this point, I am tracking two possible scenarios for SPY.
Scenario 1: Bullish Scenario (Likely)
With the bullish structure formed during the week, I expect price to continue higher and potentially target all time highs. Bullish sentiment remains strong enough to support this move.
That said, risks remain. Escalation around Iran or a potential 100% tariff on Canada could shift market structure back to bearish, so staying cautious is important.
This bullish scenario can play out in two ways:
1-A direct gap up open followed by continuation toward bullish targets
2-A pullback toward the 687 area, a brief deviation, then a bounce with a strong close above that level, leading to higher targets
Bullish scenario targets:
691 – 696 – 700
Scenario 2: Bearish Scenario
Geopolitical tension around Iran or a potential tariff shock could still trigger a bearish shift, keeping this scenario in play.
A strong break and close below 687 would activate the bearish scenario for me. On any retest, price should fail to reclaim and close back above 687. If that happens, I would look to actively trade this scenario using puts.
Potential bearish targets:
676.5 and 669.5
Position Management Notes
I manage risk by scaling out of positions at key reaction levels and adjusting exposure as structure confirms. Partial profit taking at major levels is a core part of my approach.
I share deeper SPY-QQQ breakdowns and weekly scenario updates on Substack. Link is in my profile.
This analysis is for educational purposes only and reflects my personal opinion. It is not financial advice.

SLV - Parabolic Exhaustion Play - $100 Puts Feb 13📉 Pattern Recognition Setup
AMEX:SLV just completed a 68% run from $65 to $110 in under 3 months. This isn’t normal commodity ETF behavior - this is meme-stock price action.
Key Observation:
The current parabolic structure mirrors the prior $30→$48 spike that collapsed violently after hitting exhaustion (see bar pattern overlay on daily). Same RSI divergence, same volume behavior, same exhaustion signature.
Technical Confluence:
• RSI: 74 (overbought with multiple bear divergence signals)
• Structure: Double top at $110 resistance zone
• Volume: 8h chart shows peak Volume surges mark local Tops/Bottoms
• Pattern Target: $88.91 measured move
• Historical Precedent: Prior parabolic collapse followed identical setup
Trade Details:
Entry: $100 Puts, Feb 13 expiration
Trigger: Close below $105 on 4H timeframe
Target: $88-90 zone
Stop: Reclaim and hold above $110 invalidates pattern
Risk Management:
This is a defined-risk speculation on technical pattern completion. When parabolic runs exhaust at resistance with stacked divergence, retracements are swift and violent - not gradual. Size accordingly.
Timeline: 11 trading days for execution
This is my own thoughts put together by Claude.ai
This is my own charting and my own words and thoughts gathered into a presentable form.

IGV HAS BEGUN MAJOR DECLINE OTHERS TO FOLLOW The chart posted Is Some of the Big Tech IGV I have this sector Bull as ENDED The rest of the market will be in harmony by 2/9 spiral turns I am looking for a 6 % PLUS drop MIN best of trades WAVETIMER

Updated January 14 Volatility Event BreakdownThis video will help you understand how the markets are playing out related to my original prediction of a big volatility event on January 14.
Watching the markets swing up and down over the past two weeks while almost perfectly following my predicted price trends has been incredible.
But, I'm not always this accurate in my predictions - no one is.
I believe this market move is following my longer-term prediction of a moderate breakdown in Q1/Q2 of 2026. If my research is correct, we will continue to see an ABC or ABCDE wave structure where price continues to move downward and attempts to find a base near July 2026.
The one thing I really wanted to point out is the use of Fibonacci Defense Levels and how you can use them to better determine when and how price is breaking from a moderate pullback into an extended or deeper pullback/trend reversal.
I've been using these Defense Levels for quite a while, and I find they work well.
Please take a minute to watch this video.
I also highlight Gold/Silver and Natural Gas in this video.
Hope all of you are GETTING SOME today.
#trading #research #investing #tradingalgos #tradingsignals #cycles #fibonacci #elliotwave #modelingsystems #stocks #bitcoin #btcusd #cryptos #spy #gold #nq #investing #trading #spytrading #spymarket #tradingmarket #stockmarket #silver

ES (SPX, SPY) Analysis, Key-Zones, Setup for Fri (Jan 30)AAPL crushed it today - iPhone revenue up 23%, China sales up 38% - and the market just sold it. Couldn't hold the pop. Tim Cook mentioned chip shortages and being in "supply chase mode" which spooked some folks. Meanwhile MSFT got hammered, down 10% after hours on cloud growth slowdown and AI spending concerns. That's a big deal - roughly 15-20 points of drag on ES at the open.
ES broke down during Asia, flushed from 6,980 through 6,968 all the way to 6,943 before catching a bid. Bounced back to 6,967-6,970 where we're now seeing a Lower High form on the 15-min. Structure is bearish - lower highs, lower lows confirmed. The 4H equilibrium at 6,930-6,920 is the magnet below.
Forecast:
• Overnight: Down to flat, leaning bearish
• Morning Session: Expecting downside pressure
• Afternoon: Likely choppy and two-sided
• Daily Close: Leaning toward a red close
• Expected Range: 6,900 to 6,990
• Most Likely Path: Test and reject 6,970-6,980 early, roll over and break 6,950, test the 6,930 equilibrium, bounce attempt fails, fade into close near 6,920-6,940
Friday Events:
• 6:15 AM: CVX (EPS 1.38 exp, Rev 44.1B)
• 6:30 AM: XOM (EPS 1.69 exp, Rev 81.3B)
• 6:30 AM: VZ (EPS 1.06 exp, Rev 36.1B)
• 7:00 AM: AXP (EPS 3.56 exp, Rev 18.9B) - good read on consumer spending
• 10:00 AM: Core Trend Inflation data
• After the bell: AMZN, GOOGL, INTC
Resistance:
• 7,022 – Thursday's High
• 7,010-7,012 – Prior Equilibrium Zone
• 6,993-6,995 – Critical Level / PDH Area
• 6,980-6,982 – VWAP / Demand Turned Resistance
• 6,968-6,970 – Lower High Formation
Support:
• 6,955-6,950 – Tested Support Zone
• 6,943-6,945 – Overnight Low
• 6,930-6,920 – 4H Equilibrium (Major Target)
• 6,900 – Psychological Level
• 6,875 – Prior Week Low
How I'm seeing it:
• Leaning bearish below 7,000
• A push back to 6,970-6,980 that can't reclaim sets up a fade toward 6,950, 6,940, then 6,930
• The bounce from 6,943 looks like a selling opportunity, not a trend change
• Above 6,995 and held - bearish view weakens
• Below 6,943 opens the door to 6,930-6,920
The market couldn't rally on perfect AAPL numbers. MSFT down 10% will probably overshadow META's +9%.
Good Luck !!!

$SPY & $SPX — Market-Moving Headlines Friday Jan 30, 2026🔮 AMEX:SPY & SP:SPX — Market-Moving Headlines Friday Jan 30, 2026
🌍 Market-Moving Themes
🛒 Mega Cap Save
AMZN and AAPL lift Nasdaq after hours as cloud demand and product certainty calm markets
📉 Goldilocks Inflation
Cooling PCE resets rate fears as yields fall and risk appetite broadens
🧠 AI Hardware Wins
Capex spending funnels into suppliers with NVDA and ANET leading on data center buildouts
🏥 Obesity Buyout Chatter
VKTX spikes on takeover rumors as pharma M and A focus returns to weight loss
📅 End of Month Flows
Window dressing dynamics dominate as January closes after a catalyst-heavy week
📊 Key U.S. Economic Data Friday Jan 30 ET
8:30 AM
- Producer Price Index Dec delayed: 0.3%
- Core PPI Dec delayed: 0.3%
- PPI YoY
- Core PPI YoY
9:45 AM
- Chicago Business Barometer PMI Jan: 44.0
1:00 PM
- Fed Gov Stephen Miran TV interview
1:30 PM
- St Louis Fed President Alberto Musalem speech
5:00 PM
- Fed Vice Chair for Supervision Michelle Bowman speech
⚠️ Disclaimer: For informational purposes only. Not financial advice.
📌 #SPY #SPX #PPI #Inflation #Earnings #AMZN #AAPL #AI #Macro #Markets #Stocks #Options

$SPY the beginning of a covid style selloff? 20-32% drop?It is finally time for a larger selloff to happen. As you can see, we've broken down out of a rising wedge and many people are calling for another scenario to buy the dip, but this dip doesn't look the same as all of the other dips.
To me, this looks more like the start of a larger selloff. My thesis is that this selloff will be a cross between the selloff that took place in 1989 and covid. I think we're about to see a 20-32% drop that comes very quickly not giving people time to get out.
The past two days we're already trading exactly like we did in covid, where we can see sharp rallies that are met with more selling.
The reason this selloff is different is because volatility is starting to react and I have strong buy signals on the weekly timeframe while I'm getting weekly sell signals on SPY.
While my base case was that we'd only get a 20% selloff down to the $550-560 area on the chart, I won't rule out the possibility of the market selling off to the next support level down at $468-$481.
The selling should get stronger once we're under the $666-672 level and volatility will start to rise quickly. Under the $650 level should be lights out for the market.
Again, I think this selloff is going to happen very quickly over the next few weeks, so I'd be cautious buying any dips.
Let's see how it plays out.

MAJOR TURN 2/9/2026 plus or minus 1 TD This is the chart I promised to Post But waited till Now . This is my forecast Updated as I have said the market will see 5600/6100 easy my and on 10/10 to 10/20 2026 in the form a large ABC decline ! I see the market still seeing a 7031 in Cash SP 500 into 2/9/26 Best of trades WAVETIMER !

ES (SPX, SPY) Analysis, Key-Zones, Setup for Thur (Jan 29)FOMC is behind us. Powell kept rates at 3.50-3.75% with a dovish lean. Two dissents favoring a cut from Waller and Miran which tells you something about where the Fed might be heading. They upgraded growth to "solid pace" and said labor is "stabilizing" so the soft landing story is still alive.
Earnings after hours were solid. Microsoft beat EPS by 31%, Azure still growing at 38%. Meta crushed guidance. Tesla had 20% gross margins which surprised a lot of people, plus Optimus 3 coming in three months. IBM did well too.
But even with those beats, ES sold off about 21 points after the close. Interesting part though, CVD flipped positive during the drop. Looks like buyers were quietly absorbing on the way down. Something to keep in mind tonight.
Tomorrow morning GDP drops at 8:30 AM. Atlanta Fed GDPNow has it at 5.4% while street consensus is around 2.5-3%. If it comes in hot, could get choppy as people start pricing out cuts.
Resistance:
- 7010-7012: Need to get back above here first
- 7022: Today's high
- 7032-7044: Bigger resistance zone
- 7057-7060: Weekly extension
Support:
- 6990-6993: Where we're hanging out now
- 6975-6980: Minor demand
- 6920-6930: 4H equilibrium, bigger support
- 6875: PWL
How I'm seeing it:
- Neutral to slightly bullish overnight
- Watching 6990 for any absorption
- Above 7010 and 7022-7035 comes into play
- Below 6975 and bulls lose control
With CVD positive and earnings strong, feels like bears have some work to do here. But a hot GDP or weak Apple numbers Thursday evening could flip things around pretty quick.
Good Luck !!!

$QQQ Momentum Fracture Near Highs Similar Conditions To 2022 TopWe are currently trading inside a tight range near highs after a strong trend. What stands out to me is not price itself but momentum behavior.
When I compare this structure to the 2022 topping period I notice three things lining up.
Price consolidated near highs rather than expanding higher
RSI chopped sideways in the mid range instead of making higher momentum highs
MACD compressed and flattened showing loss of directional strength
That same behavior is showing up again now. RSI is not expanding with price and MACD is compressing instead of pushing higher. This is typically what distribution looks like before direction is resolved.
This does not mean price must collapse immediately. It does mean upside is no longer being confirmed by momentum and risk is increasing at these levels.
For me this is an area to be cautious chasing longs and instead focus on reactions. Acceptance above the range with expanding RSI and MACD would invalidate this. Failure and rejection would confirm a topping process.
This is a conditions based thesis not a prediction.
Looking at a swing perhaps, if we can consolidate and head lower. Patience for the next few days.

QQQ Weekly Outlook – Week 4 of 2026 (Jan 26–30)QQQ Weekly Outlook – Week 4 of 2026 (Jan 26–30)
Technical Look
QQQ moved exactly as expected on the bearish side, hitting its downside targets with the Tuesday open last week and finding a bounce from those levels.
In the Mid Week Update I shared afterward, I highlighted that the structure had shifted into a bullish phase and that price was now more likely to target higher levels. I’m also linking last week’s outlook on the side for reference.
Scenarios – Prediction
Scenario 1: Bullish Scenario (Likely)
With the current bullish structure established during the week, I expect price to continue higher and potentially target all time highs. Overall bullish sentiment remains strong, which makes this continuation reasonable.
That said, risks remain on the table. Escalation around Iran or a potential 100% tariff on Canada could quickly flip market structure back to bearish, so staying cautious is important.
This bullish scenario can play out in two ways:
1-A direct gap-up open followed by continuation toward bullish targets
2-A pullback toward the 687 area, a brief deviation, then a bounce with a strong close above that level, leading to higher targets
Bullish scenario targets:
626 – 629.5 – 636.5
Scenario 2: Bearish Scenario
Geopolitical tension around Iran or a potential tariff shock could still trigger a bearish shift, keeping this scenario in play.
A strong break and close below 618.5 would activate the bearish scenario for me. On any retest, price should fail to reclaim and close back above 618.5. If that happens, I would look to actively trade this scenario using puts.
Potential bearish targets:
607 and 599.5
Position Management Notes
I manage risk by scaling out of positions at key reaction levels and adjusting exposure as structure confirms. Partial profit taking at major levels is a core part of my approach.
I share deeper SPY-QQQ breakdowns and weekly scenario updates on Substack. Link is in my profile.
This analysis is for educational purposes only and reflects my personal opinion. It is not financial advice.

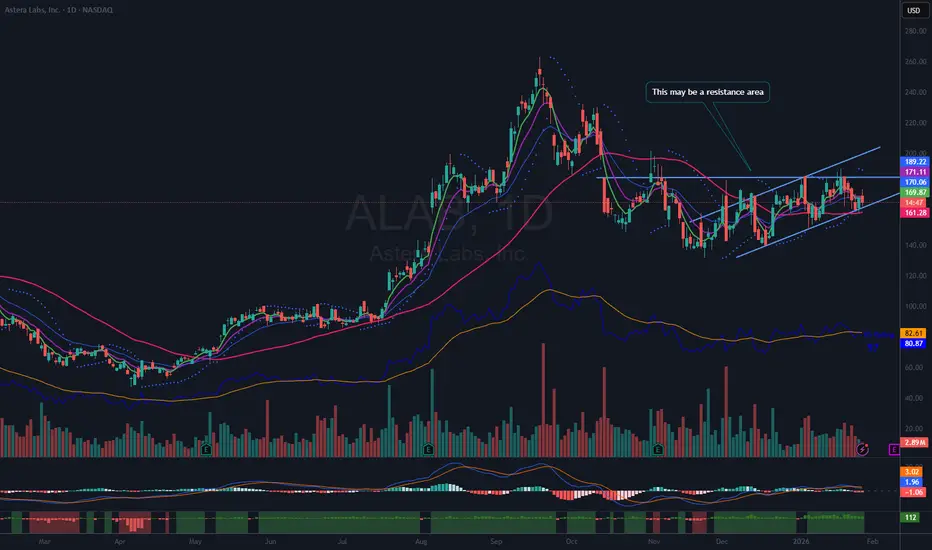
Astera Labs $ALAB Technical Analysis Overview of Recent Price Action
Astera Labs experienced significant momentum as a hot stock between July 2025 and September 2025, climbing an impressive 146% from its initial breakout point to reach its all-time closing high. Following this strong rally, the stock subsequently retraced approximately 45% of its gains.
Current Trend Channel Formation
Since the retracement, NASDAQ:ALAB appears to be trading within an upward-sloping channel, characterized by a pattern of higher lows. This technical setup suggests a potential continuation of the bullish trend, provided support levels within the channel remain intact.
Trading Strategy Considerations
Going forward, a key area of interest is the 21-day Exponential Moving Average (EMA). If ALAB manages to reclaim this level, it could signal renewed strength and provide an entry point for initiating a position. In such a scenario, the upper boundary of the channel would serve as an initial price target, while the lower upsloping trendline should be used as a stop reference to manage risk.
Upcoming Earnings Event
Investors should note that Astera Labs is scheduled to report earnings in 13 days from today. This event may introduce increased volatility and should be factored into any trading decisions.
Disclaimer
Readers are strongly encouraged to conduct their own analysis and adhere to their individual trading strategies. All investments carry inherent risks, and it is essential to make careful and informed decisions when allocating capital in financial markets.
SPY/QQQ Plan Your Trade For 1-28: Breaking(Up/Down)Today’s pattern is a Breaking(Up/Down) pattern.
This pattern suggests the SPY/QQQ will attempt to break away from yesterday’s price range. Normally, these Breaking patterns resolve as a moderately aggressive move away from the previous candle’s body range. Thus, my expectations are for the SPY/QQQ to attempt to move higher into the “new high” territory as we continue to work through the Flag Apex volatility phase.
Overall, I believe this move higher will stall out in early February and move downward as my Predictive Modeling has suggested. For many weeks, the Predictive Modeling tool has shown the markets will move into a potential breakdown phase in early/min February.
At this time, I believe the markets are pushing higher into a “false high” pattern that could translate into a larger breakdown phase moving through Q1:2026 and into Q2:2026. Time will tell.
As you know, I’ve moved my trades mostly to CASH and am currently sitting on about 70-80% CASH in my account. Yes, I still have some trades active and I have begun to setup 35+ day Shorts/Puts related to my expectation the markets may move downward in early February – but I’m not going to chase this move any further right now.
The one trade I believe I may make by the end of this week is to put on 1-3 longer-term Gold/Silver Calls. I believe this move in metals is unprecedented and I believe a small active position is almost essential. If you don’t play this once in a lifetime move efficiently, you can’t materialize the gains.
Right now, the hardest part of my trading is NOT wanting to get overly excited about these big runs in Metals and the potential for NatGas. I have to keep telling myself to be patient and wait for the right setups. Trust my analysis and trust my instinct.
There will always be another day to trade in the future.
At this point, I think the smartest move is to sit back and watch for a few days. This big move higher in Gold/Silver could be “the rally to the peak of Leg #2” – just like I predicted. One thing I’ve learned is not to chase moves when you believe they are over or nearly done.
Sure, you can leave a small runner position on if you want. Just be prepared for that position to turn into a loss if the markets suddenly turn against your trade.
NatGas rolled to the March contract. That is why we are seeing a big price gap on the NG chart. UNG is holding up well and I believe this storm will continue to increase demand into February – possibly into March. So, I plan on trying to take advantage of any price weakness in UNG.
If today goes as planned, it should be a day of mostly sitting and watching the markets. I don’t plan on being overly aggressive with my trades today.
Get some.

ES (SPX, SPY) Analysis, Key-Zones, Setups for Wed (Jan 28)
ES pulled back to 7,019 after Globex ripped to 7,039 overnight. We're consolidating below the overnight high ahead of FOMC at 2 PM and Mag 7 earnings after the close. The path of least resistance is higher but binary events cap conviction.
OVERNIGHT RECAP
Globex pushed to 7,039 - highest level of the rally - then reversed into London. It was liquidity sweep above Tuesday's high followed by profit-taking. Asia was bid, Europe faded. Currently holding Y-VAH area around 7,017-7,020.
Key overnight levels:
Overnight High: 7,039
London Open High: 7,039
Asia Session High: 7,027.75
GLOBAL DRIVERS
Bullish factors dominating the tape:
China approved 400K NVIDIA H200 chips for Alibaba, Bytedance, and Tencent. This is a massive AI tailwind and removes a key overhang on the semiconductor complex.
SoftBank announced plans to invest an additional $30 billion in OpenAI, reinforcing the AI investment narrative heading into Mag 7 earnings.
ASML surged 6% in Amsterdam after Q4 bookings crushed expectations. Semiconductor strength continues.
Gold hit a record high above $5,200 per ounce on dollar weakness and safe haven flows.
Asian tech index reached all-time highs. South Korea's market has now surpassed Germany in total value, gaining $1.7 trillion since the AI rally began.
Dollar weakness continues with DXY near 4-year lows around 95.60. Trump's dovish stance on the dollar ("the loss is good for US businesses") supports risk assets.
Kremlin indicated openness to Trump contact, signaling potential geopolitical de-escalation.
Caution factors:
ECB's Villeroy called the dollar drop "a sign of US unpredictability."
South Korea warned they cannot rule out US mentioning tariffs again due to investment disagreements.
Mortgage applications fell 8.5% with rates rising to 6.24%.
Daily oscillator at 110 - extreme overbought. Extended 5 sessions straight.
FOMC PREVIEW - 2:00 PM ET
The Federal Reserve is currently expected to maintain interest rates in the range of 3.50% to 3.75%, with a probability of 97.2%. However, the real focus will be on Powell's tone rather than the decision itself.
Dovish signals to watch for include the statement highlighting a cooling labor market, greater confidence in ongoing disinflation, indications that rate cuts may be likely in 2026, and less emphasis on upside inflation risks.
On the other hand, hawkish signals to look out for might emphasize inflation uncertainty, Powell stressing the need for "greater confidence" before considering any cuts, pushback against near-term easing expectations, and an overall emphasis on patience and caution.
I expect the Fed will make an in-line decision to hold rates and use data-dependent language. Powell is likely to avoid providing a timeline for cuts and will emphasize flexibility. We may see an initial spike in reaction to the decision, followed by a fade as the focus shifts to corporate earnings.
MAG 7 EARNINGS - AFTER CLOSE
Microsoft, Meta, and Tesla are all scheduled to report earnings tonight after 4 PM. This is significant because having three major companies report on the same night can cause the ES to move by more than 50 points in Globex.
For Microsoft, strong growth in Azure and acceleration in AI revenue are essential. Meta needs to show strength in ad revenue without raising concerns about AI spending. Tesla has the weakest setup, facing issues with margin compression and competition concerns.
Additionally, Apple will report after the close on Thursday.
FOMC EXECUTION
Reduce position size by 50% before 2 PM announcement.
Wait 5-10 minutes for initial reaction to settle. The first move is often a fake.
Trade the second move:
If dovish spike to 7,045+ then buy the pullback to 7,030-7,035.
If hawkish flush to 7,000 then short retest of breakdown or buy 6,988 support.
If chop then wait for earnings to resolve direction.
BOTTOM LINE
Day 6 of the rally: Overnight, the market pushed to new highs at 7,039 before reversing. This situation could indicate either a bull flag, suggesting a continuation to 7,050 and above, or a liquidity sweep that signals a mean reversion back to 7,000.
The Federal Open Market Committee (FOMC) meeting will determine the outcome. If Powell takes a dovish stance, we may see a squeeze higher; if he adopts a hawkish tone, we could experience a drop. However, tonight's earnings reports from Microsoft, Meta, and Tesla are the larger wildcards in this scenario.
Consider buying dips in the range of 7,005 to 7,008 with defined risk. Additionally, look to fade spikes between 7,035 and 7,039 if rejection is confirmed. It's advisable to be flat before the earnings announcements at 4 PM.
Trade what you see. Good luck !!!

S&P500 & NASDAQ: Trading Above The +FVG! Look For Longs!Welcome back to the Weekly Forex Forecast for the week of Jan. 27-30th.
In this video, we will analyze the following FX market: S&P500 and NASDAQ
Both indices have been trading sideways. Both made an inefficient bearish move last week that
took a week to recover from. Both have been struggling to get move higher through a bearish FVG.
That changed Monday. The Monday candle closed above the -FVG, indicating bullish order flow.
Look to take advantage tomorrow! Price is heading towards buy side liquidity, and there will be opportunities to take valid long setups over the next 24 hrs.
Enjoy!
May profits be upon you.
Leave any questions or comments in the comment section.
I appreciate any feedback from my viewers!
Like and/or subscribe if you want more accurate analysis.
Thank you so much!
Disclaimer:
I do not provide personal investment advice and I am not a qualified licensed investment advisor.
All information found here, including any ideas, opinions, views, predictions, forecasts, commentaries, suggestions, expressed or implied herein, are for informational, entertainment or educational purposes only and should not be construed as personal investment advice. While the information provided is believed to be accurate, it may include errors or inaccuracies.
I will not and cannot be held liable for any actions you take as a result of anything you read here.
Conduct your own due diligence, or consult a licensed financial advisor or broker before making any and all investment decisions. Any investments, trades, speculations, or decisions made on the basis of any information found on this channel, expressed or implied herein, are committed at your own risk, financial or otherwise.

$SPY & $SPX — Market-Moving Headlines Wednesday Jan 28, 2026🔮 AMEX:SPY & SP:SPX — Market-Moving Headlines Wednesday Jan 28, 2026
🌍 Market-Moving Themes
🧠 AI Confirmation Day
MSFT earnings validate AI spend with positive read-through for NVDA AMD PLTR and the Nasdaq
🏥 Managed Care Shockwave
UNH collapse on Medicare pricing pressures HUM CVS and drags the Dow
🧍 Consumer Confidence Divergence
Confidence plunges despite index highs, widening the gap between markets and households
🥈 Silver Volatility Reset
Silver pulls back from recent highs as margin changes cool leverage while the trend stays in focus
🏦 Fed Decision Risk
FOMC decision and Powell presser dominate flows as markets parse tone on inflation and cuts
📊 Key U.S. Economic Data Wednesday Jan 28 ET
2:00 PM
- FOMC Interest Rate Decision
2:30 PM
- Fed Chair Powell Press Conference
⚠️ Disclaimer: For informational purposes only. Not financial advice.
📌 #SPY #SPX #FOMC #Powell #MSFT #AI #Healthcare #Silver #Macro #Markets #Stocks #Options

ES (SPX, SPY) Analysis, Key Zones, Levels for Tue, (Jan 27)
BIAS: CAUTIOUSLY BULLISH — Breakout Watch
ES is testing 6,995-6,998 in premarket after rallying from the 6,970 area overnight. We're now less than 0.5% from all-time highs. Asia hit new records, Europe is bid, and risk appetite is at five-year highs according to Goldman Sachs. The path of least resistance is higher - but FOMC Wednesday and Mag 7 earnings create headline risk.
The dip buyers got their fill overnight. Now it's breakout or rejection at 7,000.
OVERNIGHT RECAP
Asia/Europe session was bullish across the board. MSCI Asia regional index hit a new all-time high. South Korean chipmakers rallied despite the tariff headlines. Stoxx 600 pushed higher led by a 21% surge in Puma. US futures followed with S&P +0.3% and Nasdaq +0.7%.
The yen gave back some gains, falling 0.2% as intervention fears cooled slightly. Gold and silver held near record highs. Dollar remained weak near 2022 lows.
Key overnight developments that shifted sentiment:
South Korea's Blue House clarified that the US letter they received was NOT directly related to Trump's tariff announcement. This de-escalates the immediate tension.
Canada's PM Carney said he had a "good conversation with President Trump." Another de-escalation signal.
Japan's Finance Minister Katayama confirmed they will "take action in line with the US-Japan FX agreement" and "closely coordinate with US authorities as needed." The intervention threat remains but is now expected rather than surprising.
BACKGROUND: IRAN TENSIONS
Trump told Axios on Monday that the US has "a big armada next to Iran" as the USS Abraham Lincoln carrier strike group entered the region. This is ongoing posturing, not a new headline — markets have already digested it. Watch for any escalation but this is not driving price action today.
WHAT'S DRIVING THE RALLY
Goldman Sachs strategists note that investor appetite for risk is at its greatest level in five years. Economic confidence is overcoming geopolitical concern.
Micron surged 5% in premarket after announcing plans to expand memory chip production. This is bullish for the semiconductor complex and supports the AI infrastructure narrative heading into Mag 7 earnings.
The three-year bull market continues to find buyers on every dip. Investors are looking to earnings this week to validate the AI-driven rally.
SCHEDULED CATALYSTS
Tuesday 10:00 AM: Consumer Confidence
Wednesday 2:00 PM: FOMC Decision (97% hold expected)
Wednesday 2:30 PM: Powell Press Conference
Wednesday After Close: Microsoft, Meta, Tesla earnings
Thursday 8:30 AM: Q4 GDP Advance (Atlanta Fed tracking 5.4%)
Thursday After Close: Apple earnings
Friday 8:30 AM: Core PCE (Fed's preferred inflation gauge)
The FOMC is fully priced for a hold at 3.50-3.75%. The market will trade Powell's tone. Hawkish = pullback. Dovish = breakout fuel.
Mag 7 earnings Wednesday night are the main event. These can swing ES 50+ points. Microsoft and Meta expectations are high. Any disappointment could trigger a sharp reversal from 7,000.
SUPPORT AND RESISTANCE ZONES
RESISTANCE
R2: 7,015 to 7,025
Extension target if 7,000 breaks cleanly. This is where profit-taking kicks in on breakout longs.
R1: 6,997 to 7,005
Current battle zone. Overnight high 6,998.75 and psychological 7,000. Must break and hold above 7,005 to confirm breakout.
SUPPORT
S1: 6,985 to 6,990
Overnight support and VWAP area. First level to buy if we pull back. Expect bids here.
S2: 6,970 to 6,978
Prior value area and overnight rally base. Strong support. If this holds on a pullback, bullish structure intact.
S3: 6,952
Monday's low. Losing this invalidates bullish structure and opens gap fill to 6,920-6,940.
PRIMARY SETUP: BREAKOUT LONG
We're at the door. The overnight session was bullish, de-escalation headlines are hitting, and risk appetite is at five-year highs. The setup favors a breakout above 7,000.
Trigger: Clean break and hold above 7,000 for 5+ minutes
Entry: 7,002 to 7,005 on the retest. Do NOT chase the initial spike. Wait for price to break above 7,000, pull back, and hold it as support.
Stop: 6,993
Target 1: 7,015 to 7,020 (take partials, move stop to breakeven)
Target 2: 7,035 to 7,040 (trail remainder)
Risk: 10-12 points
Reward: 15-35 points
R:R: 1.5:1 to 3:1
If the breakout fails and we reject back below 6,995, do NOT take this setup. Wait for price to pull back to S1 (6,985-6,990) or S2 (6,970-6,978) and reassess for a dip buy.
RISK FACTORS
Government Shutdown — 77% probability by Friday. Senate Democrats blocking DHS funding after Minneapolis shootings. Partial shutdown likely but markets typically shrug off short shutdowns.
Minneapolis Unrest — Two citizens killed by federal agents this month. Protests ongoing. Driving the shutdown standoff and adding political uncertainty.
Trump Tariffs - South Korea 25% threat de-escalated slightly with Blue House clarification. Canada conversation "good" per PM Carney. Still watch for headline risk.
Iran - USS Abraham Lincoln now in region. Tensions ongoing but not escalating today. Background noise unless new headlines hit.
Overbought Technicals - Daily oscillator at 110 (extreme). We're extended and due for mean reversion eventually, but momentum can stay overbought longer than expected in trending markets.
RISK MANAGEMENT
Reduce position size by 50% this week
No overnight holds through Wednesday earnings
Take quick profits at resistance
Use breakeven stops once in profit
Be ready to flip direction on headline surprises
The market can move 30-50 points on a single headline. Capital preservation first.
BOTTOM LINE
Bulls are in control. We rallied overnight, de-escalation headlines are hitting, and risk appetite is at multi-year highs. The setup favors a breakout above 7,000.
But this is FOMC week with Mag 7 earnings Wednesday night and a government shutdown Friday. The breakout needs to happen with conviction or we risk a "buy the rumor, sell the news" reversal.
Key question: Can ES break and hold 7,000 before FOMC? If yes, the path opens to 7,020-7,040. If no, expect consolidation between 6,978-7,000 until Wednesday's catalysts resolve.
Trade what you see, not what you think. Good luck !!!

$SPY & $SPX — Market-Moving Headlines Tuesday Jan 27, 2026🔮 AMEX:SPY & SP:SPX — Market-Moving Headlines Tuesday Jan 27, 2026
🌍 Market-Moving Themes
🥈 Silver Squeeze Escalation
Silver breaks out above 105 with miners ripping AG PAAS and attention on CDE SLV SILJ
🧠 Microsoft Earnings Gravity
MSFT drifts ahead of earnings with AI monetization nerves and read-through risk for PLTR NVDA QQQ
🚗 Mexico Tariff Threat
Trump floats 100 percent tariffs on Mexican-made cars putting pressure on F GM STLA and keeping TSLA firm
₿ Bitcoin 100k Print
BTC tags 100,000 with catch-up focus on miners CLSK MARA and broader anti-fiat flows
📊 Key U.S. Economic Data Tuesday Jan 27 ET
9:00 AM
- Case Shiller 20 City Home Price Index Nov: 1.3%
10:00 AM
- Consumer Confidence Jan: 90.0
⚠️ Disclaimer: For informational purposes only. Not financial advice.
📌 #SPY #SPX #Macro #Earnings #MSFT #AI #Silver #Crypto #Markets #Stocks #Options

5-10% Correction for S&P500 incoming SPX is at the 1.618 fib level measured from Jan 25 high and April low.
This fib level acted as a temporary resistance in all major bear Markets (except 2020) with drawdowns between 5 and 10%.
A breach of the 200 DMA and Jan 25 high and April low anchored VWAP is unlikely.

$QQQE NASDAQ 100 Equal-Weighted ETF: Breaking Out?Overview
The NASDAQ:QQQE NASDAQ 100 Equal-Weighted ETF has recently shown signs of breaking out from a period of consolidation. Since reaching its all-time high on October 27, 2025, the ETF has been trading within a wedging pattern. This technical formation typically indicates the potential for a resumption of the previous uptrend.
Recent Price Action
On the most recent trading day, the intraday high for NASDAQ:QQQE surpassed the previous high set on October 27th. This development reinforces the notion that the ETF may be poised to continue its upward movement.
Trading Strategy
In anticipation of a breakout and sustained uptrend, a half-size position has been initiated. The 21-day Exponential Moving Average (EMA), represented by the blue line on the chart, will serve as the reference point for setting a stop loss to manage risk.
Risk Management and Disclaimer
Readers are strongly encouraged to perform their own analysis and adhere to personal trading strategies. All investments involve inherent risks, so it is crucial to make careful and informed decisions when allocating capital in financial markets.

Why You Should Backtest (Before You Trust Any Strategy)Most traders ask the wrong question.
They ask:
“Does this strategy work?”
The better question is:
“When does this strategy stop working?”
Backtesting exists to answer that.
1. A Single Backtest Is Not Proof
One profitable run does not mean a strategy is good.
It means it worked once, under one set of assumptions.
Markets change.
Volatility changes.
Behavior changes.
Backtesting across parameters, symbols, and timeframes shows whether performance is structural or accidental.
2. Drawdown Matters More Than Profit
Profit attracts attention.
Drawdown determines survival.
Two strategies can both make money.
Only one lets you stay disciplined long enough to compound.
Backtesting reveals:
Worst historical drawdown
Length of drawdowns
Recovery behavior
If you don’t know those, you don’t know the strategy.
3. Most Strategies Fail From Fragility
Many strategies look great until you:
Change RSI length by 2
Shift timeframe slightly
Switch from BTC to ETH
If performance collapses from small changes, the edge isn’t robust.
Backtesting exposes fragility before the market does.
4. Backtesting Protects You From Yourself
Most trading mistakes aren’t technical.
They’re emotional.
Backtesting:
Sets realistic expectations
Reduces overconfidence
Prevents panic exits during normal variance
Confidence comes from data, not conviction.
5. Backtesting Is About Risk, Not Prediction
Backtesting doesn’t predict the future.
It defines boundaries.
It tells you:
What’s normal
What’s abnormal
When something is truly broken
That’s the difference between trading and guessing.
Final Thought
Strategies don’t fail because they’re bad.
They fail because traders never tested their limits.
Backtesting isn’t optional.
It’s the cost of taking trading seriously.

Why Default Strategy Settings Break Down Across MarketsThe Assumption: Defaults Are Good Enough
Most traders start with default indicator settings . RSI at 14. MACD at 12, 26, 9. Moving averages set to familiar values.
Defaults feel safe because they are familiar. They feel reasonable because they are widely used.
The problem: defaults are not designed to work across all symbols, timeframes, or market conditions.
The solution: instead of assuming defaults are acceptable, test how those settings behave when parameters are varied. Small changes often reveal whether a strategy is stable or dependent on coincidence.
The Assumption: If It Works on One Chart, It Should Work Elsewhere
A strategy looks clean on a single chart. Entries make sense. Losses feel explainable. Confidence builds.
The problem: one chart is not a market. Performance on a single symbol or timeframe says very little about robustness.
The solution: test the same logic across multiple symbols and timeframes. When behavior changes dramatically, it’s not failure, it’s information. Consistency across variation is what signals durability.
The Assumption: Indicator Logic Is the Edge
Traders often focus heavily on the logic behind indicators. Momentum, trend, mean reversion. The reasoning feels solid.
The problem: good logic does not guarantee good behavior. Two parameter sets can follow the same logic and produce completely different risk profiles.
The solution: explore how performance shifts as parameters move. Testing ranges, not single values, shows whether logic holds up under pressure or collapses when assumptions change.
The Assumption: Profit Tells the Full Story
Many traders judge strategies by net profit alone.
The problem: profit without context hides risk. Large drawdowns, unstable equity curves, or long stagnation periods often go unnoticed until they’re experienced live.
The solution: test for drawdown, consistency, and trade distribution alongside profit. Seeing how risk expands or contracts across parameter combinations changes how strategies are evaluated.
The Assumption: Defaults Fail Because Markets Changed
When defaults stop performing, traders often blame the market.
The problem: markets always change. A strategy that only works under narrow conditions was fragile from the start.
The solution: testing across broader conditions reveals whether a strategy is regime-dependent or structurally resilient. This allows expectations to adjust before capital is exposed.
What Testing Actually Replaces
Testing doesn’t replace strategy logic.
It replaces assumptions.
It replaces:
“This should work”
“This looks reasonable”
“Everyone uses this”
With:
“This is how it behaves”
“This is where it struggles”
“This is how sensitive it is”
Final Thought
Default settings are not wrong.
They are incomplete.
They are a starting point, not a conclusion.
The moment defaults are tested across parameters, symbols, and timeframes, they stop being assumptions and start becoming data. That shift is where real understanding begins.
