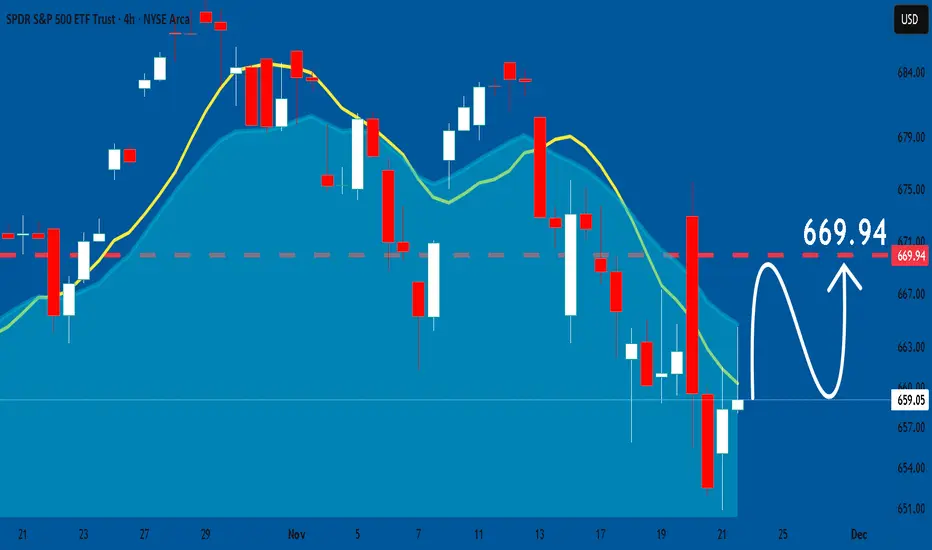
SPY: Will Start Growing! Here is Why:
Looking at the chart of SPY right now we are seeing some interesting price action on the lower timeframes. Thus a local move up seems to be quite likely.
Disclosure: I am part of Trade Nation's Influencer program and receive a monthly fee for using their TradingView charts in my analysis.
❤️ Please, support our work with like & comment! ❤️
Spy!
Daily QQQ (US100-NQ) Outlook - Prediction (21 NOV)Daily QQQ (US100-NQ) Outlook - Prediction (21 NOV)
📊 Market Sentiment
Market sentiment is bearish right now, in my opinion. The FED is expected not to cut rates in December, and the uncertainty around when rate cuts may resume in 2026 is adding pressure. After yesterday’s intraday crash, overall market anxiety has increased significantly.
📈 Technical Analysis
Price tapped the monthly FVG level around 588.5, which holds significant liquidity. In my view, this zone may set up the foundation for a potential Friday bounce.
📌 Game Plan – Prediction
I expect two possible scenarios:
Scenario 1 (Black Line):
Price may consolidate and range between 597–588, creating choppy intraday price action.
Scenario 2 (Red Line):
Price may retrace toward 578.5, then recover and move back above the 588 level.
💬 For detailed insights and broader market context, please check my Substack link in profile.
⚠️ For educational purposes only. This is not financial advice.

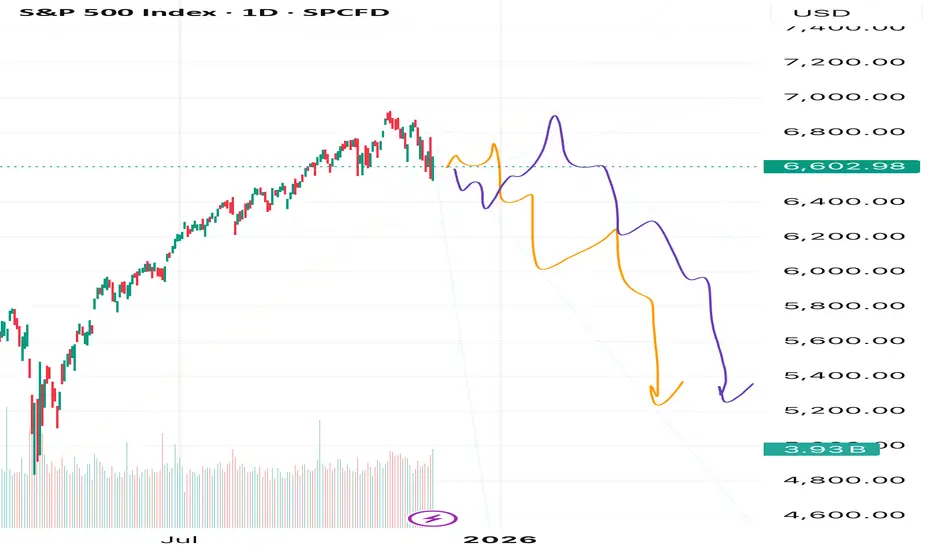
A Historic Shift in the S&P 500 Is BeginningFriends, in my view, the unstoppable rally in the S&P 500 has finally come to an end. The market has completed a massive five-wave structure with an extended fifth wave — and now we’re witnessing a historic moment as an exceptionally large correction begins.
As always, I’m watching two possible scenarios: the orange path and the purple path. But despite their differences, both point to the same outcome — my target at 5200. And that’s only the first target out of several.
Make sure to follow and subscribe, so you don’t miss the upcoming updates and deeper breakdowns.
This is just my personal market outlook — not financial advice. More updates coming soon.
Barchart says SPY had a nice bounce on the 100MA... uhhhh..So yeah, Barchart posted on FB with a screenshot of a "nice bounce" on the S&P500.
Firstly, that wasn't much of a bounce at all with the weekly closing not far from the point of impact on the 100-day moving average.
Secondly, this is just retail thinking and not considering the entire context of where the market wants to go in terms of liquidity, efficiency, and fair value.
Let's dive a bit deeper into how price REALLY moves.
- R2F Trading

BTC Wyckoff (pt. III), Pi Cycle Top, 350 SMA, and SPY Is A SELL!Trading Fam,
Was this the top? Where is Bitcoin going? Where are stocks going? Will the selling continue? How long? Can we find some targets? Where should we look to start DCA'ing back in? These are hard questions. Let's take a look at what my charts are showing us.
✌️Stew

SPY Momentum Play: QuantSignals V3 Sees DownsideSPY | QuantSignals Katy 1M Prediction (2025-11-21)
Current Price: $659.25
Predicted Close: $654.44 (-0.73%)
30-min Target: $655.71 (-0.54%)
Trend: Bearish
Confidence: 64.9%
Volatility: 14.8%
Trade Signal
Direction: SHORT (PUT)
Entry: $659.25
Target: $655.40
Stop Loss: $669.14
Expected Move: -0.73%
Summary: 1 trade signal generated from 1 successful analysis.
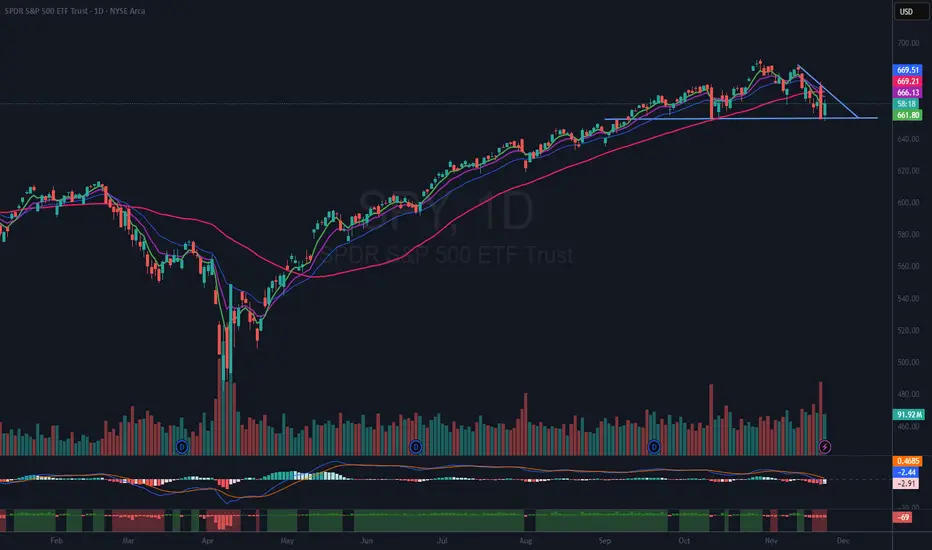
Analyzing Support in the S&P 500: $SPY Chart InsightsHas the S&P 500 Found a Support Area?
I have closely examined the AMEX:SPY chart to determine whether the recent correction of 5% plus has reached a bottom. While the answer is uncertain, the chart suggests that the index dropped to a level of interest and subsequently bounced today. However, it remains unclear if today’s bounce signals a true reversal or is simply a temporary movement.
Criteria for Increasing Risk Exposure
To consider re-entering a larger position in the SPY ETF, which I previously trimmed after the price fell below the red 50-day moving average (DMA), I am looking for two critical signals. First, the price must recover the 50 DMA. Second, it needs to break above the downward-sloping trendline. Only if both conditions are met would I contemplate increasing my risk exposure.
Current Approach
At this stage, I am focused solely on observing present conditions and potential future developments. I am refraining from taking further action until clearer signals emerge from the chart.
The coming collapse of the carry trade part 2I have held off for a few weeks now to post this chart . Reason the timing I think now this should be seen as i called a top at 161.8 last year . we are now approaching the ABC targets in a double zig zag up to form a major top in Liquidity as we started to see by the crashing of BITCON in Bitcoin I am only looking for an wave A up to 96 and then down and then Up to peak at 106 zone to complete The head n shoulder top . best of trades Wavetimer

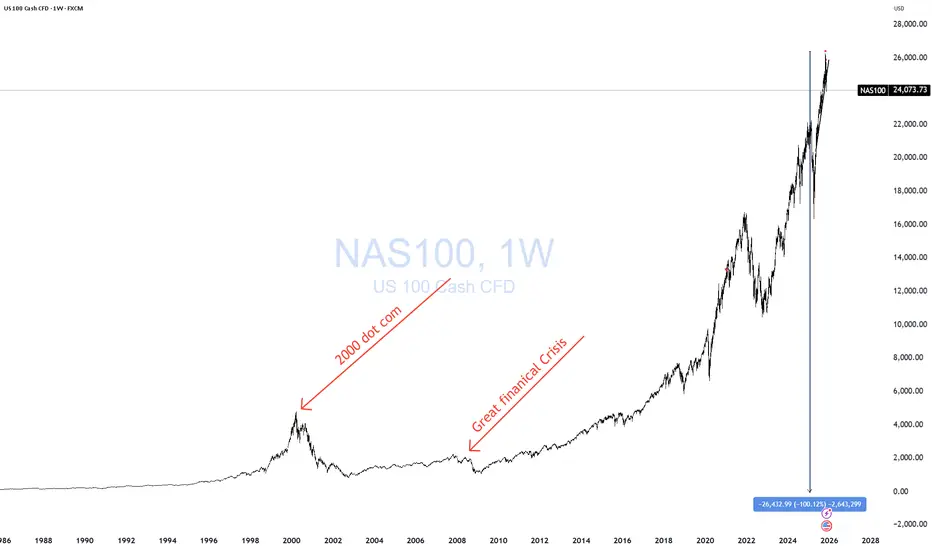
NDX - 92% From ZeroI want you to always remember one thing:
Wherever the price goes, it’s always 100% from zero.
That’s why every now and then you need to take the chart off log and look at it with fresh eyes.
Occam’s razor.
I keep hearing the PERMA-BULL crowd screaming that “the bears are calling this an AI bubble,” and in the same breath whining that the pullback is “overdone” or “extreme.”
Really?
The S&P is down 5%, and they’re already crying about the bears?
SMH.
It’s all strawman nonsense. Don’t fall for it.
Take it off log…
Remember everything is 100% from zero…
Use your basic, instinctive judgment…
And then ask yourself what your eyes are telling you when you look at this chart.
That’s the truth — not the narratives.
THANK YOU for getting me to 5,000 followers! 🙏🔥
Let’s keep climbing.
If you enjoy the work:
👉 Boost
👉 Follow
👉 Drop a solid comment
Let’s push it to 6,000 and keep building a community grounded in truth, not hype.
SPX - Hours Of Work To Buy 1 ShareHours of work needed to buy just one share of the S&P 500 just hit a new all-time high: 187 hours.
That’s:
150% more work than 2007
60% more than pre-COVID (2019)
10% more than “Liberation Day”
As I tell my kids:
Don’t look at the price tag.
Look at how many hours of your life — your blood, sweat, and effort — it takes to buy the thing.
Then decide if it’s actually worth it.
When the amount of work required keeps rising while what you get keeps shrinking, that’s not “innovation” or “AI magic.”
That’s over-speculation.
Buffett said it best:
Price is what you pay. VALUE is what you get.
Everyone screams about the price going up…
but nobody asks whether the VALUE justifies the hours of work required to own it.
That’s the truth — not the narratives.
THANK YOU for getting me to 5,000 followers! 🙏🔥
Let’s keep climbing.
If you enjoy the work:
👉 Boost
👉 Follow
👉 Drop a solid comment
Let’s push it to 6,000 and keep building a community grounded in truth, not hype.

ES (SPX, SPY) Analysis, Levels, PA Forecast, Setups Fri (Nov 21)Analyzing Today’s Sharp Market Decline
The significant selloff observed today was not an arbitrary event. The day began with a robust rally following another impressive earnings report in the AI-chip sector, which propelled futures sharply upward and triggered a short squeeze in the Nasdaq. However, the release of a stronger-than-anticipated jobs report shifted the market's sentiment. While hiring showed signs of rebounding, the unemployment rate also ticked higher, undermining the prevailing narrative that the Federal Reserve would soon lower interest rates.
This development served as a stark reminder of the ongoing restrictive monetary policy, coupled with slowing economic growth and exorbitant valuations in the tech sector. Major investment funds capitalized on the morning’s strength in AI and large-cap stocks as an opportunity to reduce their risk exposure. Additionally, systematic trend-followers faced compulsion to sell once the S&P 500 fell below critical support levels.
The environment for high-beta assets, including cryptocurrencies, is already in a “reset” phase, which left little incentive for dip-buying at lower price points. As the E-mini S&P 500 futures broke through the previous day’s support levels, the situation escalated into a full liquidation. This perfect storm involved trapped long positions from the morning breakout, stop-loss orders falling into execution beneath yesterday’s lows, and mechanical selling, culminating in the largest intraday reversal since the spring.
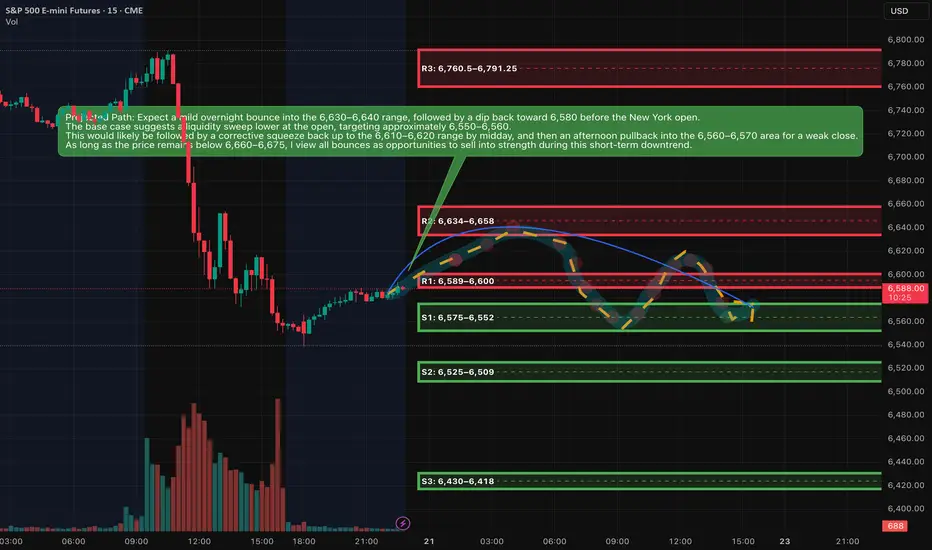
Market Outlook
The current market sentiment is skewed bearish as the ES remains entrenched below the critical 6,660 to 6,700 range. The price is hovering near a significant demand zone established around the lows of the previous trading day and today’s New York session. While we can expect some upward bounces, these movements appear to be temporary rallies within an ongoing downtrend, rather than indicators of a potential new upward leg.
Market Analysis: Is This the Beginning of a Downtrend or a Temporary Shakeout?
In the recent developments within the E-mini S&P 500 (ES) on the daily timeframe, we’ve observed the formation of a distinct lower high following the recent all-time peak. This shift has seen prices breach the last identified higher-low area, establishing a new narrative. The sequence has transitioned from a higher high to a lower high, culminating in a movement into prior demand zones marked by increased volume, all while momentum appears to be rolling over.
On the four-hour chart, the prevailing trend reflects a series of lower highs and lower lows. The recent selloff has further entrenched this trajectory into the discount zone, now signaling proximity to the next Fibonacci retracement target below.
While momentum indicators have already dipped from overbought conditions, they have not yet reached deeply oversold thresholds, indicating potential for another leg downward following any short-term corrective bounce.
From a broader perspective, the long-term trend remains positive; however, a short- to medium-term corrective phase appears to be in play. Today’s market dynamics suggest we may be in the midst of this corrective leg rather than witnessing the final downturn.
As prices have recently entered a significant demand zone, a bounce lasting one to three sessions—or a period of sideways consolidation—seems likely before any potential further decline.
In summary, while current conditions favor a move towards lower prices in the days ahead, the market likely anticipates a "lower after a bounce" scenario rather than an immediate and steep decline.
Key resistance zones
Resistance is written as bands, not single ticks.
R1: 6,589–6,600
This band sits around the current Asia-session high and the underside of today’s New York low. It is the first lid above price. If rallies stall here, the tape stays heavy and favors another test of the lows.
R2: 6,634–6,658
This is the main breakdown zone from today, centered around the New York afternoon high and the upper edge of the late-session range. As long as ES trades below this shelf, the short-term downtrend remains intact and every bounce is suspect.
R3: 6,760.5–6,791.25
This band covers the New York morning low-to-high range and the origin of the big sell leg. If price ever retests this area and fails, it is a prime region for larger swing shorts. Only sustained trade and closes above this pocket would suggest the current corrective leg is ending.
---
Key support zones
S1: 6,575–6,552
This is the immediate floor combining the Asia-session low, New York afternoon low, and prior-day value low. It is where we are effectively trading now. Expect reactive bounces and stop-runs here, as both sides are active.
S2: 6,525–6,509
This is the next downside magnet if S1 breaks cleanly. It aligns with a fib extension and 4-hour demand. A decisive move into this region would represent the next step down in the correction.
S3: 6,430–6,418
Deeper extension and prior higher-timeframe demand. If the correction matures into a more serious pullback over several sessions, this pocket becomes a reasonable medium-term downside destination.
A++ Setup 1 – Short from R2 supply (continuation short)
Direction: Short
Entry zone: 6,638–6,648
SL (hard stop): 6,678
TP1: 6,588
TP2: 6,552
TP3: 6,515
Invalidation (structure):
If we get a 15m full-body close above 6,675, treat the short idea as invalid and stand aside; market is likely shifting into a squeeze toward 6,700+ instead of extending the down leg.
---
A++ Setup 2 – Quick-reclaim long from S1 demand (counter-trend bounce)
Direction: Long
Entry logic: need a flush then reclaim
Entry zone (after reclaim): 6,562–6,568
SL (hard stop): 6,538
TP1: 6,610
TP2: 6,638
TP3: 6,660
Invalidation (structure):
If price breaks below 6,552 and 15m closes stay below 6,545 without a fast reclaim, the bounce idea is invalid; then you wait for the deeper S2 zone instead of forcing longs here.
Good Luck !!!
$SPY & $SPX Scenarios — Friday, Nov 21, 2025🔮 AMEX:SPY & SP:SPX Scenarios — Friday, Nov 21, 2025 🔮
🌍 Market-Moving Headlines
📊 Flash PMIs take center stage: These are the first real-time reads on November growth — high-impact for equities, yields, and recession-tracking.
🧭 Consumer sentiment + inventories wrap the week: UMich final reading offers clues on spending resilience; wholesale inventories remain a shutdown-delayed report.
⚠️ Shutdown backlog: Wholesale inventories (Aug) is still delayed due to the Oct 1–Nov 12 shutdown.
📊 Key Data & Events (ET)
⏰ 9:45 AM — S&P Flash PMIs (Nov)
• Services: 54.5 (vs 54.8 forecast)
• Manufacturing: 52.0 (vs 52.5 forecast)
One of the most important releases of the day — markets move off this.
⏰ 10:00 AM — Consumer Sentiment (Final, Nov)
Actual: 51.0
Low sentiment continues to weigh on forward demand expectations.
⏰ 10:00 AM — Wholesale Inventories (Aug, delayed report)
Actual: 0.1 percent
⚠️ Delayed due to the federal shutdown — low relevance, but still part of the data backlog.
⚠️ Disclaimer: Educational/informational only — not financial advice.
📌 #SPY #SPX #trading #macro #PMI #consumer #markets #stocks #investing

How to Identify Stocks Uptrends and Downtrends to Gain a TradingHow to Identify Stocks Uptrends and Downtrends to Gain a Trading Edge and understand the psychology behind the patterns

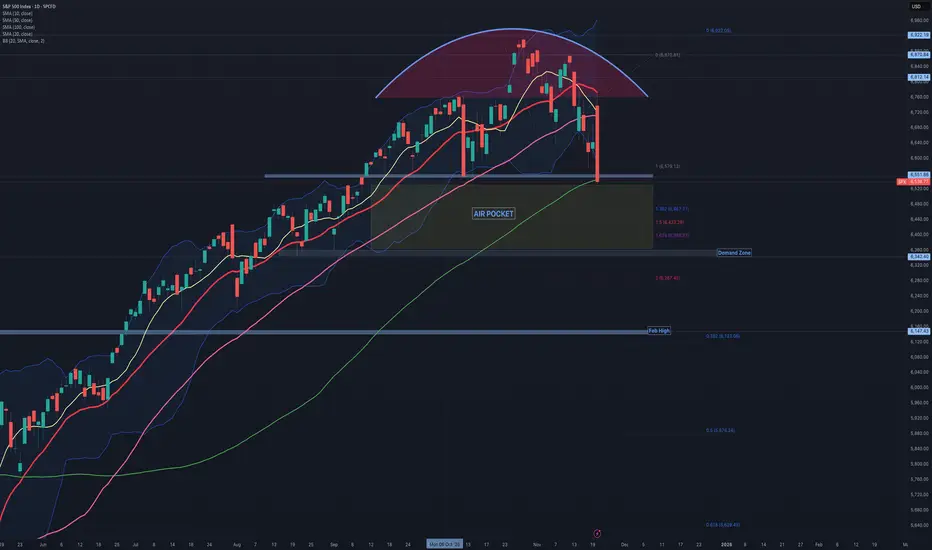
$SPX: A worrying Intraday Turnaround!While everyone, even the taxi driver, was celebrating NVDA's positive earnings report, the SP:SPX suddenly reversed. After touching the 20-day simple moving average, it dropped sharply with no buyers stepping in. With a 3.5% swing between the intraday high and low, the SP:SPX closed slightly below the horizontal support level at 6,550 and the 100-day moving average.
It's unfortunate that the right shoulder is missing, as it would otherwise form a perfect head and shoulders pattern—though it might be more accurately described as the head of a one-armed head and shoulders. Jokes aside, the technical outlook for the SP:SPX has significantly deteriorated. The market's bullish sentiment has evaporated, making it more challenging to establish a bottom.
If the S&P 500 doesn’t recover and consolidate support around 6,550 by Friday—an extremely important level that also aligns with the 1:1 extension below—we could face an “Air Pocket” of approximately 175 points. Within this Air Pocket area, we have extensions at 1.382, 1.5, and 1.618. The 14-period RSI is approaching oversold conditions, but it's not quite there yet.
Maximize Your Gains: Latest QS V3 AI Trade AlertsSPY 0DTE Signal (2025‑11‑20)
Direction: Buy PUTS (Short)
Strike Price: $650.00
Entry Range: $0.02 – $0.03 (mid ~$0.03)
Target 1: $0.06 (~+200% gain)
Target 2: $0.09 (~+350% gain)
Stop Loss: $0.01 (~‑50% from entry)
Expiry: 2025‑11‑20 (same-day)
Confidence Level: 60% (Low-Moderate)
Position Size: 2% of portfolio
📊 Market / Signal Analysis
Katy AI Prediction: Bearish trajectory with price expected to decline to $670.84 (~‑0.48% from current price). 390 prediction points show consistent downward momentum despite neutral summary.
Technical Factors:
Current Price: $674.09
VWAP: $672.77 (price slightly above)
Session Range: $662.62 – $674.70 (support near lower bound)
Volume: 9.1× average → strong participation, direction uncertain
News / Sentiment: Mixed geopolitical developments (Russia oil sanctions, China-US trade) create risk-off sentiment; no strong bullish catalysts
Options Flow: Neutral PCR 0.79, unusual activity at $691 call, max pain ~$668 → mild downward pressure
⚠️ Risk Considerations & Strategy
0DTE trade → extreme time decay and rapid price swings.
Katy AI shows bearish signal, but confidence moderate → low conviction trade.
Tight stop-loss and small position size recommended.
Trade aims to capture intraday downward momentum, especially afternoon acceleration as predicted.

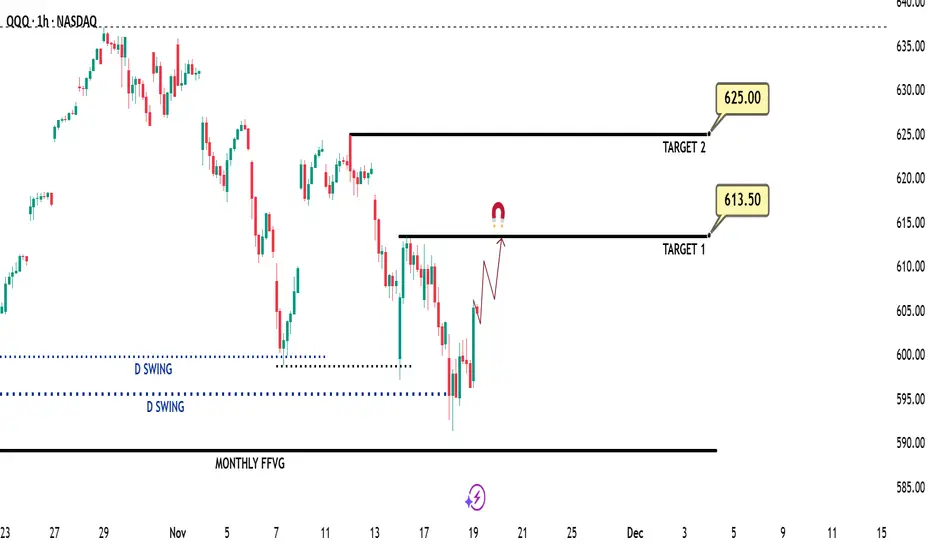
Daily QQQ (US100-NQ) Outlook - Prediction (20 NOV)Daily QQQ (US100-NQ) Outlook - Prediction
📊 Market Sentiment
Market sentiment appears neutral to bullish right now, in my opinion. The FED may pause rate cuts in December, which previously contributed to selling pressure and hedging flows. However, with the U.S. government reopening last week, updated economic data will begin to flow again. If employment data weakens and CPI comes in low or stable, it could support renewed bullish momentum.
NVDA beat earnings expectations and addressed AI bubble concerns clearly. AI demand remains strong, and their revenue growth continues to accelerate. U.S. tech firms turned notably green after the release, further boosting bullish sentiment.
📈 Technical Analysis
Price is currently rising toward 613.5 following NVDA’s earnings results. A strong bullish candle close has appeared on NQ, indicating solid upward momentum heading into today’s session.
📌 Game Plan – Prediction
I will be buying calls at the opening, targeting 613.5 first. After that, I will be targeting 625. If I see a 1H bearish close below the opening price, I will exit my positions, as I expect strong bullish momentum after the market opens.
💬 For detailed insights and broader market context, please check my Substack link in profile.
⚠️ For educational purposes only. This is not financial advice.

Fear greed prints 10 Vix 25 and put/call I am BULLISH 6954/7031WAVE FOUR IS IN THE THE LAST HOURS .We should hold above 6491 /6554 zone based on the math and wave structure . I went from all cash to 75 % long on close 11/18 I am adding today into a new low to 90% long sp 500 Nik 225 and ALL WORLD CHARTS ARE THE SAME BULLMOVE NEXT Best of trades WAVETIMER

$SPY & $SPX Scenarios — Thursday, Nov 20, 2025🔮 AMEX:SPY & SP:SPX Scenarios — Thursday, Nov 20, 2025 🔮
🌍 Market-Moving Headlines
📉 Dual labor signals hit premarket: The delayed September employment report and weekly jobless claims land at the same time — a rare setup that can jolt both yields and equities.
🛒 Housing + recession gauges follow shortly after, giving traders a full macro pulse before midday.
⚠️ Reminder: Some October data (leading indicators) may still be affected by shutdown delays.
📊 Key Data & Events (ET)
⏰ 8:30 AM — U.S. Employment Report (Delayed Sept)
• Payrolls: 50,000
• Unemployment Rate: 4.3%
• Wages: 0.3% m/m, 3.7% y/y
Treat this like a fresh NFP — major market mover.
⏰ 8:30 AM — Initial Jobless Claims (Nov 15)
Actual: 227,000
Weekly update on cooling/tightening labor conditions.
⏰ 8:30 AM — Philadelphia Fed Manufacturing (Nov)
Actual: 1.5 vs –12.8 prior
Important for gauging demand softness vs stabilization.
⏰ 10:00 AM — Existing Home Sales (Oct)
Actual: 4.10M vs 4.06M forecast
Clean read on rate-sensitive housing momentum.
⏰ 10:00 AM — Leading Economic Indicators (Oct)
Actual: –0.3%
⚠️ May still be subject to shutdown-related reporting delays.
⚠️ Disclaimer: Educational/informational only — not financial advice.
📌 #SPY #SPX #trading #macro #jobs #housing #labor #markets #PMI #investing #stocks

ES (SPX, SPY) Analysis, Key-Zones, Setups for Thu (Nov 20th)Market Bias Analysis
The current short-term bias is constructively bullish, yet it remains contingent on upcoming events. Recent momentum has been bolstered by Nvidia's exceptional earnings report and a significant intraday reversal in the E-mini S&P 500 (ES). As long as the 6,670–6,680 range holds during any pullbacks, the path of least resistance appears to be upward. It is important to note that the broader daily trend is still bullish, unless we see a decisive breach below the key demand zone of 6,520–6,510 in the ES.
Market Overview
In a notable shift following a four-day decline, today's trading session exhibited a renewed bullish sentiment. The E-Mini S&P 500 (ES) printed a robust green daily candle, bouncing off a low of approximately 6,622.00 yesterday to close near 6,740.
From a technical perspective, the daily chart reveals that the recent selloff has established a lower high without breaking the prior significant higher low. The reaction low remains comfortably above the daily 1.272 extension cluster situated around 6,521.25. On the 4-hour chart, the price action has transitioned from a pattern of lower lows to a new higher low, currently pushing into the Price Quotient Median (PQM) and Price Quotient High (PQH) band, just below previous 4-hour supply levels. Observing the 1-hour chart, today's trading reflected a definitive trend day upward, characterized by a consistent series of higher lows and higher highs, culminating the session near the 1-hour 1.272 Fibonacci extension at 6,743.75.
Macroeconomic factors played a crucial role in this market turnaround, particularly after Nvidia reported stunning Q3 earnings that exceeded expectations, generating approximately $57 billion in revenue. The company’s strong AI-driven outlook and positive after-hours performance alleviated concerns that the recent downturn in technology stocks signified the onset of a broader unwinding of the AI bubble. This development contributed to a rally in index futures as the session drew to a close.
Nonetheless, the overarching theme remains one of valuation pressures and interest rate concerns. Despite breaking a four-session losing streak, market participants are poised for tomorrow’s data, which will be pivotal in shaping the Federal Reserve's policy trajectory moving forward.
Scheduled Events (Tomorrow – Thursday, Nov. 20, 2025)
Tomorrow’s docket is heavy and directly relevant for ES:
• 8:30 a.m. ET – September Employment Situation (delayed jobs report)
The September nonfarm payrolls and unemployment rate, postponed by the government shutdown, are finally released. This is the only full jobs report the Fed will have before its December meeting, and markets are treating it as a major verdict on the labour market.
• Other U.S. data (during the morning/early afternoon)
Various calendars flag building permits / housing data, regional manufacturing (e.g., Philadelphia Fed), and existing home sales clustered through the U.S. session – all secondary to the jobs report but able to add fuel if they confirm or contradict the labour story.
• Fed speakers / meetings
• Chicago Fed President Austan Goolsbee has a scheduled fireside chat around midday (12:40 p.m. ET).
• The Fed also has a closed Board meeting at 1:15 p.m. ET and a two-day Cleveland Fed financial-stability conference that can generate headlines.
Net: the jobs report is the main event; Fed comments will colour the move rather than drive it on their own.
Setups (A++ Concepts)
These are two high-conviction, rule-style ideas you can plug into your own framework. Price levels are exact from your charts.
A++ Setup 1 – Continuation Long from Value Pocket
Entry trigger concept:
Look for a sweep into the chosen band (e.g., wick into 6,690–6,695 or down into 6,663–6,668) followed by a strong 15m/5m bullish close back above 6,700. That shows buyers defending value and rejecting a deeper rotation into S3.
Risk / invalidation:
Structural invalidation if ES closes the hour below 6,652.50 (Y-POC) and cannot reclaim 6,668. In practice, a tight stop can sit just under 6,652.00 if entering from 6,690–6,705, or under 6,645.00 if using the deeper S2 pocket.
Targets:
• TP1: 6,743.75 (1H 1.272)
• TP2: 6,777.00 (1H 1.618)
• TP3: 6,813.50 (1H 2.0)
---
A++ Setup 2 – Short Fade from 1H Extension Cluster
Entry zone:
Primary sell pocket: 6,777.00–6,813.50
(1H 1.618 to 2.0 extension cluster.)
Risk / invalidation:
Structural invalidation above 6,825–6,830 (clear 1H/4H acceptance beyond the 2.0 extension).
A practical stop can sit around 6,828.00 if entering inside the band.
Targets:
• TP1: 6,743.75 (1H 1.272 / prior extension)
• TP2: 6,683.50–6,690.00 (NYPM high / S1 top)
• TP3: 6,659.00–6,664.75 (VWAP/value pocket S2)
Narrative:
If Nvidia’s beat triggers a euphoric push straight into the upper fib level but the tape immediately rejects that strength, the market is saying “good news already in the price.” This setup expresses the view that the real gravity is lower, back toward value and potentially into S3 if macro data disappoint.

NVDA Earnings, FOMC Minutes, US Non-Farm OH MY!!!All eyes on NVDA and earnings - they matter (a lot)
More important than a beat or miss is the price action around NVDA earnings
-bulls have a long ways to go to reclaim all-time highs
-bears have pressured NVDA enough that it seems like major support could break
FOMC Minutes today
-CME Fed Watch Tool is literally 50/50 on the December rate cut outlook
-if the FED doesn't cut in December, they will likely be cutting in early 2026
US Employment Data
-Remember Non-Farm Payroll? Well it's back with a Thursday release
-58k forecasted, 4.3% unemployment forecasted
-let's see how the release is taken by the markets
Although it feels like "the brink" in many ways, my thoughts as expressed in the video
are I believe the market can win both ways and just provide wild volatility but no real direction or follow through. Negative sentiment is truly awful and it rarely rewards the bears with a sustainable down move. Seasonality is expected but perhaps bulls have grown too complacent. Therefore, the market is comfortable making everybody uncomfortable
More to come later this week when the smoke clears or the dust settles
Thanks for watching!!!
CP

Daily QQQ (US100-NQ) Outlook - Prediction (19 NOV)Daily QQQ (US100-NQ) Outlook - Prediction (19 NOV)
📊 Market Sentiment
Market sentiment appears bearish right now, in my opinion. The FED may pause rate cuts in December, which has contributed to recent selling pressure and possible hedging flows. However, with the U.S. government reopening last week, we will begin receiving updated economic data again. If employment data weakens and CPI comes in low or stable, it could trigger renewed bullish momentum.
NVDA earnings will be released today after market close. If NVDA beats expectations, this could trigger an impulsive bullish move for both QQQ and SPY. If earnings miss, that may create strong bearish sentiment across the market.
📈 Technical Analysis
Price tapped the 595.5 level and bounced cleanly from there. A strong bullish candle close has appeared on NQ, indicating solid upward momentum for the day.
📌 Game Plan – Prediction
I am buying calls targeting 613.5 first. I will also keep a runner for a potential move toward 625 in case NVDA reports strong earnings. That could generate significant bullish momentum, potentially pushing price toward new all-time highs. My runner is positioned for that potential after hours continuation.
💬For detailed insights and broader market context, please check my Substack link in profile.
⚠️ For educational purposes only. This is not financial advice.
SPY Bearish Pullback: Channel Breakdown or BounceOn the daily chart (1D), SPY remains in a strong long-term uptrend, with price still well above the 120-day moving average around 643. However, the short-term picture has turned corrective. Price has slipped below the 20-day MA near 677 and is now battling the 60-day MA around 665, moving inside a descending channel of lower highs and lower lows. The recent swing high near 690 is the key resistance that capped the last bullish leg and started this pullback.
The immediate battleground sits in the 650–655 zone. A daily close below 655 would confirm a breakdown from the channel and open room toward 645 and the 120-day MA, where dip buyers may look for a stronger reaction. As long as SPY holds above the 120-day MA and especially 642, the broader bullish structure remains intact. On the flip side, a daily close back above 677 would signal that buyers have reclaimed the short-term trend, putting 690 and then 701 back on the map as upside reference points. A deeper dip toward the 643–650 zone followed by a daily close back above 650 would frame a classic “buy-the-dip” scenario in a primary uptrend.
Thought of the Day 💡: The most powerful setups come from knowing exactly where your idea is wrong, not from predicting where price “must” go.
This is a study, not financial advice. Manage risk and invalidations.
----------------------
Thanks for your support!
If you found this idea helpful or learned something new, drop a like 👍 and leave a comment, I’d love to hear your thoughts!

Day 72 — AI Bubble Fears Hit the Market | S&P Futures RecapStarting to get a bit worried about the stock market. Everything feels tied to NVDA earnings this week, and we’re starting to lose major support levels across multiple timeframes. I took a few losses overnight, so I went into the morning a bit more hesitant and wanted to wait until the market slowed down before committing.
I made some small profits trading off Bia's order and took a few scalp trades off the 1-minute MOB, which helped stabilize the day. This wasn’t a high-conviction environment for me, so I stayed defensive and focused on execution.
📈 Key Levels for Tomorrow
🔼 Bullish Above: 6725
🔽 Bearish Below: 6710
These are the two main pivot levels I’m watching.
Above 6725 we may see buyers regain control.
Below 6710 the bearish wave accelerates.
