Huge Dark Pools... Will This Time be Any Different?QQQ CME_MINI:NQ1! CME_MINI:ES1! stock market Forecast
Nvidia Stock NASDAQ:NVDA Forecast
Apple Stock AAPL Forecast
Microsoft Stock MSFT Forecast
Google Stock GOOGL Forecast
Amazon Stock AMZN Forecast
Meta Forecast Technical Analysis
Tesla Stock NASDAQ:TSLA Forecast
Magnificent 7 stocks forecast
SPDR S&P 500 ETF (SPY)

SPY Buyers In Panic! SELL!
My dear subscribers,
SPY looks like it will make a good move, and here are the details:
The market is trading on 657.41 pivot level.
Bias - Bearish
Technical Indicators: Both Super Trend & Pivot HL indicate a highly probable Bearish continuation.
Target - 650.13
About Used Indicators:
The average true range (ATR) plays an important role in 'Supertrend' as the indicator uses ATR to calculate its value. The ATR indicator signals the degree of price volatility.
Disclosure: I am part of Trade Nation's Influencer program and receive a monthly fee for using their TradingView charts in my analysis.
———————————
WISH YOU ALL LUCK

TSLA UPDATE 13 SEP 2025I dont care what price does next. I have exited from Tesla at $390. I want it to go moon and I will buy it back again whenever I want but wont hold here or make new entries here. There is a big monthly supply zone here so I wont be touching Tesla now & wait for further price action

SPX500 Holds Below 6,590 Pivot After Hitting 6,600 TargetSPX500 – Overview
The S&P 500 reached our 6,600 target following softer inflation data that reinforced Fed rate-cut expectations.
Price is now stabilizing below the 6,590 pivot, signaling the potential for a near-term pullback.
📉 Bearish scenario: While trading below 6,590, momentum favors a drop toward 6,571. A confirmed break under this level could extend the decline to 6,550 → 6,527.
📈 Bullish scenario: A 1H close above 6,590 would shift bias bullish, opening the way toward 6,604 → 6,631.
Key Levels
Pivot: 6,590
Resistance: 6,604 – 6,631
Support: 6,571 – 6,550 – 6,527
Bias: Bearish while below 6,590; bullish breakout confirmed only on a 1H close above this pivot.

SPY's Final Wall: The Bearish ThesisRight now, SPY is facing the most significant confluence of resistance trend lines it has seen in years. Think of this as the ultimate ceiling—a multi-layered wall that the bulls have to smash through.
The market's parabolic move has pushed the price to this critical point. But here's the thesis: the combined strength of these converging trend lines is just too much. The buying power is exhausted.
We believe this is a classic rollover setup. Instead of a breakout to new highs, we expect a strong rejection from this level. The price will hit this solid wall of resistance and turn over, leading to a significant pullback.
The current price isn't a simple pause; it's a test of strength that the bulls are likely to fail.
Day Trade/Swing Trade Idea: Short at red arrow and cover at the green arrow

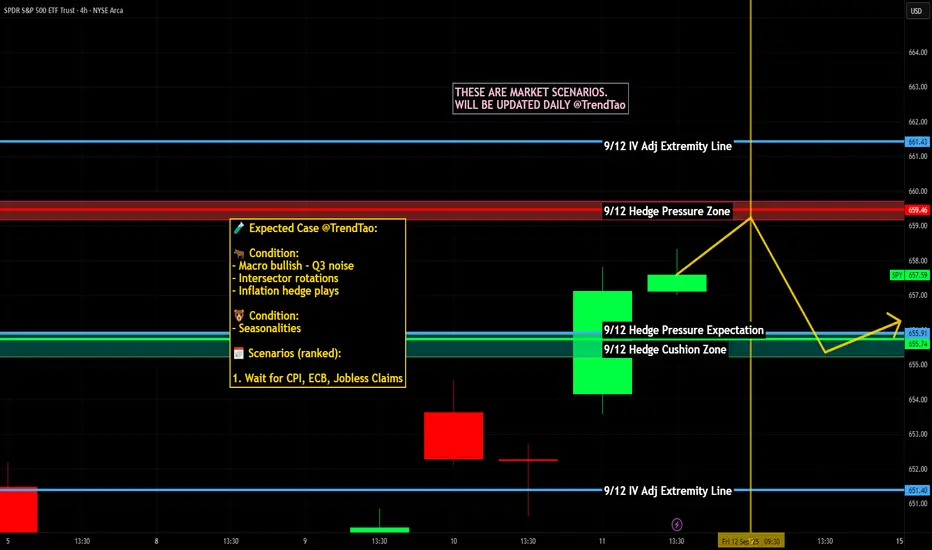
$SPY / $SPX Scenarios — Friday, Sept 12, 2025🔮 AMEX:SPY / SP:SPX Scenarios — Friday, Sept 12, 2025 🔮
🌍 Market-Moving Headlines
📉 Markets digest 🚩 CPI + ECB shocks — Friday closes the week with sentiment checks.
🚩 Consumer mood in focus: UMich prelim survey drives inflation expectations + spending tone.
📦 Trade & price gauges: Import/export prices fill in the inflation picture post-CPI/PPI.
📊 Key Data & Events (ET)
⏰ 8:30 AM — Import & Export Prices (Aug)
⏰ 🚩 10:00 AM — UMich Consumer Sentiment (Prelim, Sept)
⚠️ Disclaimer: Educational/informational only — not financial advice.
📌 #trading #stockmarket #SPY #SPX #UMich #inflation #Fed #consumer #bonds #economy
Melt-Up into FOMC - Post FED Expect CorrectionMore all-time highs
I shouldn't be upset (and I'm really not as the portfolio continues to make new YTD highs)
But technically, it is extremely frustrating to see nothing more than slow grind higher after slwo grind higher on the indexes - and also see blowout moves on individual stocks (ORCL, GOOGL, AVGO for example)
Rising Wedge still hasn't rolled over, resistance at 6500 hasn't been a wall yet
50 Day Moving Average is now over 90 bars from price. I could see price action melting up
into a crescendo or peak pre, during, or post FOMC and then fading lower after to find
some technical levels I've been eyeing for weeks
Enjoy the melt-up, just be ready for some action and volatility in the indexes, gold, silver,
bitcoin, and the bond/yield markets
I won't complain about YTD highs, but it's the caution ahead that I don't want to be
surprised by in the coming weeks
Plan accordingly - I'll continue to grind through it the best and safest way I know how
Thanks for watching!!!

$XBI Trade UpdateChannel Breakout
On September 3rd, AMEX:XBI broke out of its previously established, upward-trending channel. This movement was significant, as it marked a departure from the pattern that had been guiding its price action up until that point.
Current Price Action and Potential Setup
Since the breakout, AMEX:XBI appears to be forming a flat base. This development suggests the possibility of another breakout in the near future, which warrants close monitoring.
Trade Execution and Position Management
I entered this trade on September 2nd, anticipating a breakout. However, the price pulled back by the end of the day. Despite the initial setback, I am considering increasing my position if AMEX:XBI decisively breaks out of the flat base.
Risk Management Strategy
To manage risk, I have set my stop just below the upper channel line. This level provides a cushion and would result in a small profit if the stop is triggered quickly.

$BWXT After Earnings Consolidation or Bear Flag?NYSE:BWXT I sold this today for a tiny loss but I think it could have an "after earnings rally." I bought on Aug 21st at what looked like a reversal confirmation. It wasn't. Looks like there is a lot of resistance at the horizontal line area. This could also be a bear flag. I won't know until it resolves. I have an alert over the area of resistance. Let's see what happens.
Most of the time when a stock pulls back like this one, there is a resumption of the prior trend. In this case that is up. Operative word here is "most."
As always, if you like this idea, please make it your own by following YOUR trading plan and rules. Remember, it is YOUR money at risk.

TESLA BULLISH,READ NOTES SEP 11 2025Tesla is looking bullish to break this consolidation. Initial target would be $390. Now breakout is an expectation so always manage your risk.
NOTE: LOOKING BULLISH TO BREAKOUT

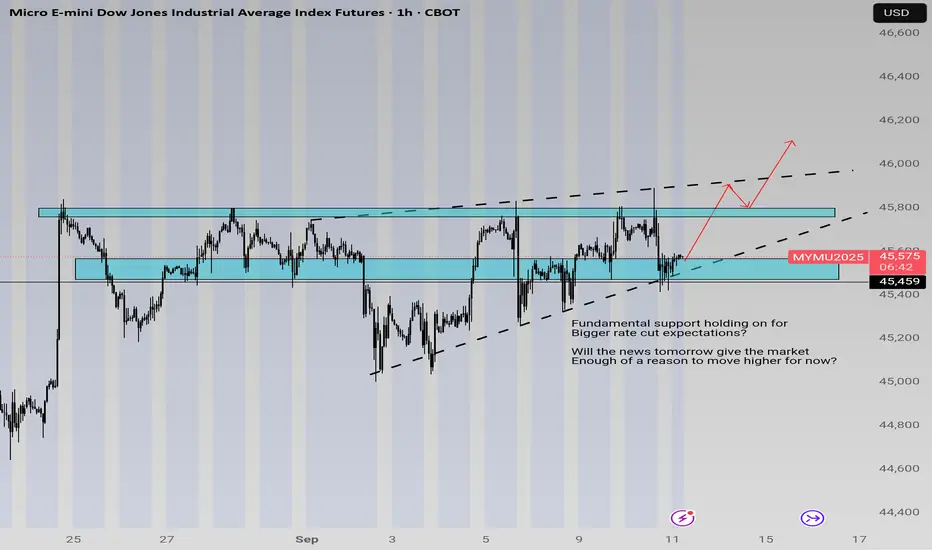
Technicals Illustrating Current Positioning of BullsEquities have bulls building into positions as seen with rising support, and the pressure against the supply zone around ATHs are becoming more squeezed as we get closer to next week.
The zone is main Key Level holding direction. Tomorrow's news will give more volatility and will be the next clue as to what may happen.
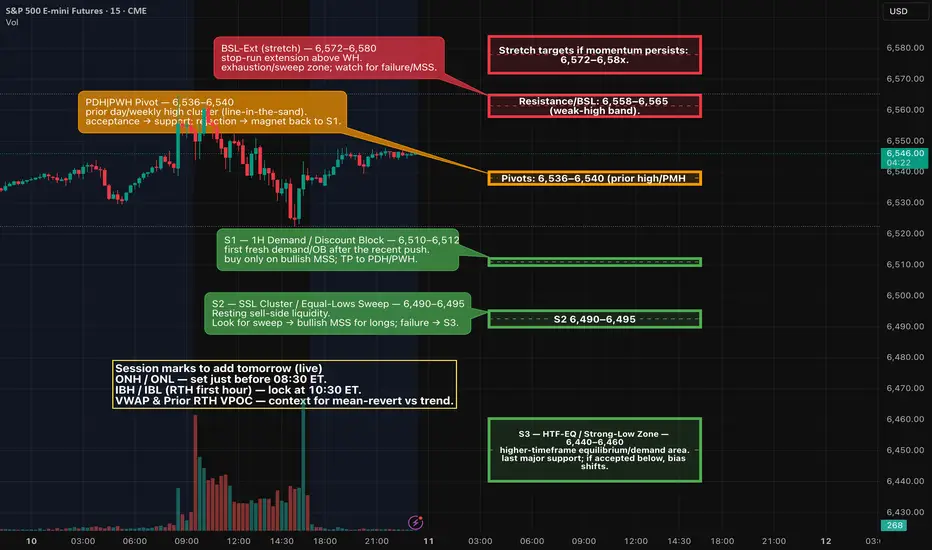
ES (SPX) Analyses for Thu, Sep 11 (CPI day)What matters tomorrow (fundamentals)
CPI (Aug) at 8:30 ET — the BLS schedule shows the August CPI release Thu Sep 11, 08:30 ET. This is the day’s primary driver.
Weekly Initial Jobless Claims at 8:30 ET — standard Thursday release; calendars show the event scheduled for Sep 11 at 08:30 ET.
Treasury 30-yr bond auction — $22B long-bond sale Thursday (typically 13:00 ET). This can move yields into the NY afternoon and spill into equities.
Context into the print: PPI (Aug) was released today (Sep 10); YoY +2.6% per data trackers/BLS release, keeping focus on CPI for confirmation. Markets are leaning toward a Fed cut at next week’s meeting.
I’m using your 1D / 4H / 1H.
Trend: Uptrend intact on 1D; price sits just beneath a “weak-high / premium” supply band. (1D shows fib extensions near ~6705 (1.272) and ~6799 (1.618) as far targets, not base-case for tomorrow.)
4H: Recent push into a red supply band then pullback; mid-range equilibrium roughly ~6,44x–6,45x.
1H: Resistance zone ~6,558–6,565 (your “Weak High” band). Prior highs around ~6,536–6,540 act as local pivot/PMH; below that, demand/discount blocks stack ~6,50x → 6,46x–6,44x.
Scenario A — Disinflationary/soft CPI (yields down)
Likely path: Early sell-side sweep into 6,51x → 6,49x discount → bullish MSS.
Entry: Buy the 1–5m PD-array in discount after displacement.
Targets: 6,536–6,540 → 6,558–6,565 (weak-high). Leave runner toward 6,57x–6,58x only if order-flow stays bid.
Invalidation: 1–5m structure loses 6,49x and cannot reclaim.
Scenario B — Hot CPI (yields up)
Likely path: Buy-side sweep through 6,558–6,565 → failure → bearish MSS back below the band.
Entry: Short premium PD-array after displacement down.
Targets: 6,536–6,540 → 6,51x, stretch 6,49x then 6,46x–6,44x if momentum accelerates.
Invalidation: Acceptance back above 6,565 with bullish structure.
Projections:
ES futures are anticipated to respond within a 5-15 minute window following the 8:30 AM release, with intraday movements likely intensified by algorithmic trading and stop-hunting activities. Historical analysis of the past 6 CPI events indicates an average end-of-day ES move of approximately +0.76% in response to ±0.1% deviations from forecasts. The prevailing volatility suggests that implied moves, derived from options data, are forecasting a swing of around 0.5-1% (equivalent to ±30-60 points from current levels), though actual market responses have been known to exceed these expectations in the event of surprises.
In the pre-release phase, spanning overnight to pre-market hours (approximately 4:00-9:30 AM ET), market participants are likely to observe a consolidation or mild upward bias within a range of 6480-6575, building upon today’s record highs. The light trading volume may lead to false breakouts around critical levels. Traders are currently positioning for a "failed breakdown" pattern, wherein an initial dip below recent lows could trigger stop-loss orders, followed by a swift reversal higher if market sentiment remains intact.
As the clock strikes 8:30 AM ET, high volatility is expected, with the potential for a 20-40 point gap open or sharp spike. A common occurrence is an initial downside flush aimed at testing liquidity (for instance, dipping below 6500) before a definitive market direction is established. Whipsaw action is likely as news headlines emerge, with particular focus on the core CPI data, which will be pivotal for determining sustained market trends.
Good Luck Everyone!
$SPY / $SPX Scenarios — Thursday, Sept 11, 2025🔮 AMEX:SPY / SP:SPX Scenarios — Thursday, Sept 11, 2025 🔮
🌍 Market-Moving Headlines
🚩 CPI Day: August Consumer Price Index at 8:30 AM — the main macro print of the week.
🚩 ECB Decision: 8:15 AM ET — Europe’s call on rates adds global cross-asset volatility.
📉 Labor + growth mix: Jobless claims alongside CPI sharpen the Fed outlook.
📊 Key Data & Events (ET)
⏰ 🚩 8:15 AM — ECB Rate Decision
⏰ 🚩 8:30 AM — Consumer Price Index (CPI, Aug)
⏰ 🚩 8:30 AM — Initial Jobless Claims (weekly)
⚠️ Disclaimer: Educational/informational only — not financial advice.
📌 #trading #stockmarket #SPY #SPX #CPI #ECB #inflation #Fed #jobs #bonds #economy

AMD 1D Time frameMarket Snapshot
Current Price: ~$155.82
Daily Change: +2.9%
Recent Trend: Up more than 30% year-to-date, but momentum has slowed in the last few weeks.
🔎 Technical Indicators
RSI (14-day): ~54 → Neutral, neither overbought nor oversold.
MACD: Slightly negative → Mild selling pressure.
Moving Averages:
5-day MA: ~$154.6 → Supportive (bullish short-term).
50-day MA: ~$157.9 → Acting as resistance.
200-day MA: ~$168.3 → Major long-term resistance.
Summary: Short-term momentum is holding, but medium to long-term averages are pushing down on price.
📈 Support & Resistance
Immediate Support: ~$150 – $155 zone
Resistance Levels: ~$158 (50-day), then ~$168 (200-day)
📅 Outlook
Bullish Case: If AMD sustains above ~$158, upside targets near $170–175 open up.
Bearish Case: A break below ~$150 could drag it toward $140–145.
Bias: Neutral to mildly bearish in the near-term, with long-term upside still intact if it reclaims the 200-day MA.

AAPL 1D Time frameCurrent Price & Market Metrics
Current Price: $234.35 USD
Market Cap: $3.01 Trillion
P/E Ratio: 30.28
EPS: $6.59
Beta: 1.15
Volatility: 2.32%
52-Week Range: $139.34 – $200.00 USD
🔎 Technical Indicators
Relative Strength Index (RSI): 67.00 — Neutral
Moving Averages:
5-day: $237.11 — Buy
10-day: $233.72 — Buy
20-day: $231.59 — Buy
50-day: $219.01 — Buy
100-day: $210.66 — Buy
200-day: $220.99 — Buy
Moving Average Convergence Divergence (MACD): 5.61 — Sell
Stochastic Oscillator: 89.58 — Sell
Commodity Channel Index (CCI): 136.25 — Sell
Average True Range (ATR): 4.41
📈 Support & Resistance Levels
Support: $220.11
Resistance: $239.78
📅 Outlook
Bullish Scenario: A breakout above $239.78 could signal a move toward $255.59.
Bearish Scenario: A drop below $220.11 may lead to further downside.
Overall Bias: Neutral to Bullish, with mixed signals from momentum indicators and moving averages.

SENSEX 2Hour Time frameS&P BSE Sensex 2-Hour Snapshot
Current Value: ₹81,425.15
Change: +0.41% from the previous close
Market Cap: ₹1.86 Trillion
P/E Ratio: 25.95
EPS: ₹27.56
Intraday High: Not available
Intraday Low: Not available
🔎 Technical Indicators
RSI (14): Neutral
MACD: Neutral
Moving Averages:
5-period SMA: Not available
10-period SMA: Not available
20-period SMA: Not available
50-period SMA: Not available
📈 Market Sentiment
Pivot Points:
R1: Not available
R2: Not available
R3: Not available
S1: Not available
S2: Not available
S3: Not available
📅 Outlook
Bullish Scenario: A breakout above the current price could lead to further gains.
Bearish Scenario: A drop below the current price may test support levels.
Overall Bias: Neutral, with mixed signals from moving averages and momentum indicators.

SPX500 Holds Above 6,527 Ahead of U.S. PPI DataSPX500 – Overview
Global equities rose early Wednesday as bets for a Federal Reserve rate cut next week strengthened after more weak U.S. jobs data. Traders now await the release of U.S. PPI today and CPI tomorrow, which may spark short-term volatility, though few expect them to alter the Fed’s plans.
Technical Outlook:
📈 The index remains in a bullish trend, with potential to set a new ATH near 6,550. A confirmed breakout above this level could open another bullish leg.
📉 To confirm bearish momentum, price would need to close a 1H candle below 6,527, exposing downside targets at 6,518 → 6,506.
Key Levels:
Pivot: 6,527
Resistance: 6,550 – 6,566
Support: 6,518 – 6,506

TSLA 45Minutes Time frameTSLA 45-Minute Snapshot
Current Price: $346.97 USD
Change: +0.18% from the previous close
Intraday Range: Not available
🔎 Technical Indicators
RSI (14): 53.64 — Neutral
MACD: 1.78 — Buy signal
Moving Averages:
5-period SMA: $347.01 — Sell signal
10-period SMA: $346.78 — Buy signal
20-period SMA: $347.82 — Sell signal
50-period SMA: $340.53 — Buy signal
📈 Market Sentiment
Pivot Points:
R1: $347.52
R2: $348.18
R3: $348.95
S1: $345.32
S2: $344.65
S3: $343.99
📅 Outlook
Bullish Scenario: A breakout above $347.52 could lead to a push toward $348.18 and higher.
Bearish Scenario: A drop below $345.32 may test support around $344.65.
Overall Bias: Neutral to slightly bullish, with mixed signals from moving averages.

NIFTY 45Minutes Time frameNifty 45-Minute Snapshot
Current Price: 24,976.70 INR
Change: +0.42% from the previous close
Recent High: 24,970.00 INR (August 28, 2025)
Recent Low: 23,500.00 INR (March 13, 2025)
🔎 Technical Indicators
RSI (14): Neutral
MACD: Bullish momentum
Moving Averages:
5-period SMA: Buy signal
10-period SMA: Buy signal
20-period SMA: Buy signal
50-period SMA: Buy signal
📈 Market Sentiment
Golden Cross: The Nifty 50 recently formed a "golden cross," where the 50-day moving average crossed above the 200-day moving average, indicating a bullish trend.
Analyst Outlook: Analysts maintain a positive outlook on Nifty 50, with a consensus rating of "Buy" and a 12-month price target suggesting potential upside.

META 45Minutes Time frameMETA 45-Minute Snapshot
Current Price: $765.70 USD
Change: +1.81% from the previous close
Market Cap: $1.86 Trillion
P/E Ratio: 25.95
EPS: $27.56
Intraday High: Not available
Intraday Low: Not available
🔎 Technical Indicators
RSI (14): Neutral
MACD: Neutral
Moving Averages:
5-period SMA: Not available
10-period SMA: Not available
20-period SMA: Not available
50-period SMA: Not available
📈 Market Sentiment
Pivot Points:
R1: Not available
R2: Not available
R3: Not available
S1: Not available
S2: Not available
S3: Not available
📅 Outlook
Bullish Scenario: A breakout above the current price could lead to further gains.
Bearish Scenario: A drop below the current price may test support levels.
Overall Bias: Neutral, with mixed signals from moving averages and momentum indicators.

HOOD 3Hour Time frameHOOD 3-Hour Snapshot
Current Price: $118.50
Change: +1.21% from the previous close
Market Cap: $82.63 billion
P/E Ratio: 46.21
EPS (TTM): $1.96
🔎 Key Levels
Resistance:
R1: $120.00 (recent high)
R2: $125.00 (next resistance zone)
Support:
S1: $115.00 (immediate support)
S2: $110.00 (next support level)
📈 Technical Indicators
RSI (14): 43.40 — Neutral
MACD: 0.69 — Bullish momentum
Moving Averages:
5-period SMA: $116.00 — Buy signal
10-period SMA: $113.00 — Buy signal
20-period SMA: $110.00 — Buy signal
50-period SMA: $105.00 — Buy signal
📌 Market Sentiment
S&P 500 Inclusion: Robinhood is set to join the S&P 500 index on September 22, 2025, replacing Caesars Entertainment. This milestone reflects the company's growth and stability in the financial technology sector.
Reuters
Recent Performance: The stock has gained approximately 496% over the past 12 months, driven by strong financial performance and increased user engagement.
Barron's
Analyst Outlook: Analysts maintain a positive outlook on HOOD, with a consensus rating of "Buy" and a 12-month price target suggesting potential upside.
TipRanks
📅 Outlook
Bullish Scenario: A breakout above $120.00 could lead to a push toward $125.00 and higher.
Bearish Scenario: A drop below $115.00 may test support around $110.00.
Overall Bias: Moderately bullish, with positive momentum but facing near-term resistance.

BABA 3Hour Time frameBABA 3-Hour Snapshot
Current Price: $147.10
Change: +4.18% from the previous close
Market Cap: $347.34 billion
P/E Ratio: 16.47
EPS (TTM): $8.84
Beta: 0.54
Dividend Yield: 0.73%
🔎 Key Levels
Resistance:
R1: $148.50 (prior high and Fibonacci cluster)
R2: $157.80 (Fibonacci 0.382 retracement)
Support:
S1: $135.00 (recent breakout level)
S2: $130.00 (next support level)
📈 Technical Indicators
RSI (14): 62.82 — Neutral
MACD: 4.08 — Bullish momentum
Moving Averages:
5-period SMA: $135.30 — Buy signal
10-period SMA: $128.98 — Buy signal
20-period SMA: $125.03 — Buy signal
50-period SMA: $119.26 — Buy signal
📌 Market Sentiment
Catalyst: Shares surged ~13% following a favorable court ruling, marking the highest close since March 2025.
Sector Performance: Positive momentum in the Chinese tech sector, with Alibaba leading gains.
Analyst Outlook: Average 12-month price target of $167.17, indicating a 13.64% upside from current levels.
StockAnalysis
📅 Outlook
Bullish Scenario: A breakout above $148.50 could lead to a push toward $157.80 and higher.
Bearish Scenario: A drop below $135.00 may test support around $130.00.
Overall Bias: Moderately bullish, with positive momentum but facing near-term resistance.

COIN 3Hour Time frame📊 COIN 3-Hour Snapshot
Current Price: $318.78
Change: +5.49% from the previous close
Intraday Range: Not specified
Market Cap: Approximately $83.3 billion
P/E Ratio: Not specified
Beta: 2.89
🔎 Key Levels
Resistance:
R1: $318.78 (recent high)
R2: $330.00 (next resistance zone)
Support:
S1: $310.00 (immediate support)
S2: $300.00 (next support level)
📈 Technical Indicators
RSI (14): Not specified
MACD: Not specified
Moving Averages:
5-period SMA: Not specified
50-period SMA: Not specified
200-period SMA: Not specified
📌 Market Sentiment
Catalysts: Positive momentum following recent gains and analyst upgrades.
Sector Performance: Cryptocurrency market showing strength, with Coinbase leading gains among peers.
Options Activity: Significant trading in call options at $318.78 strike price, indicating bullish sentiment.
📅 Outlook
Bullish Scenario: A breakout above $318.78 could lead to a push toward $330.00 and higher.
Bearish Scenario: A drop below $310.00 may test support around $300.00.
Overall Bias: Moderately bullish, with positive momentum but facing near-term resistance.
