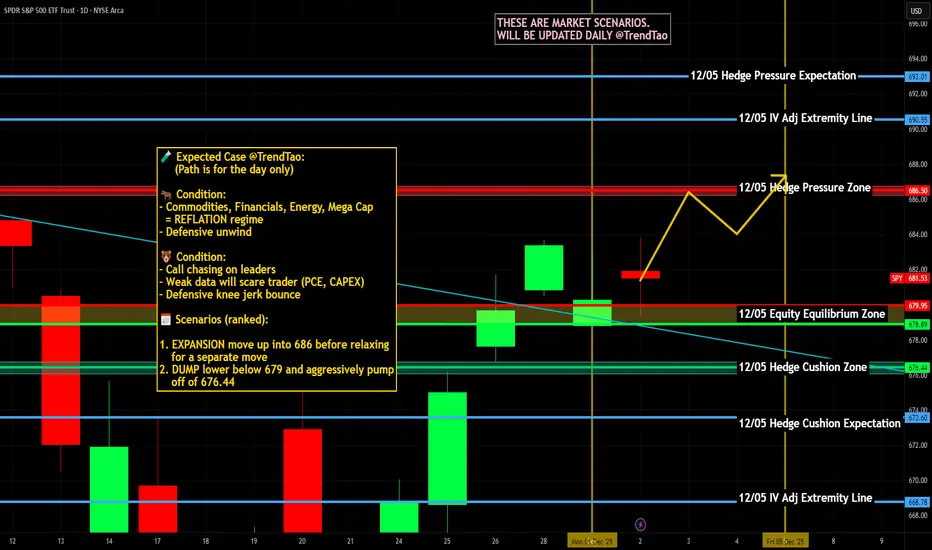
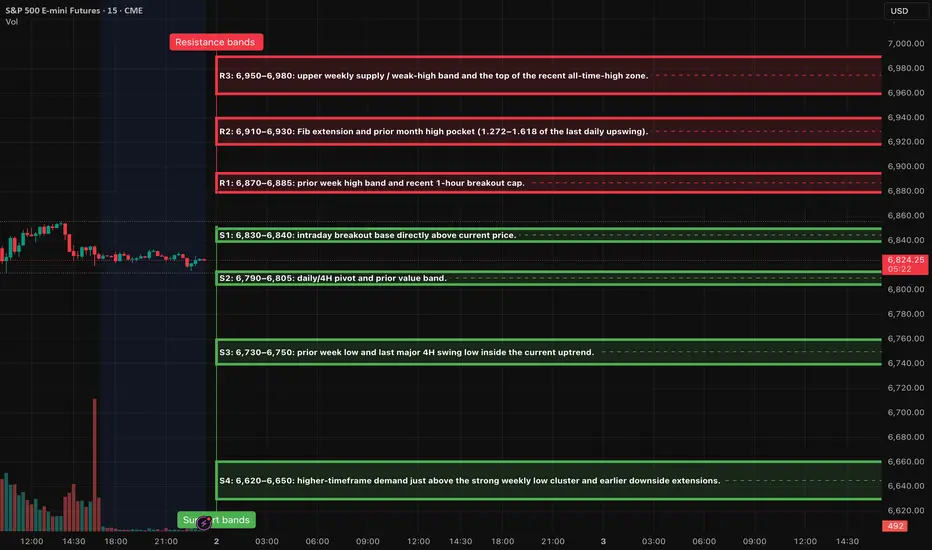
ES (SPX, SPY) Analysis, Key-Zone, Setups for Fri (Dec 5th)Market Overview
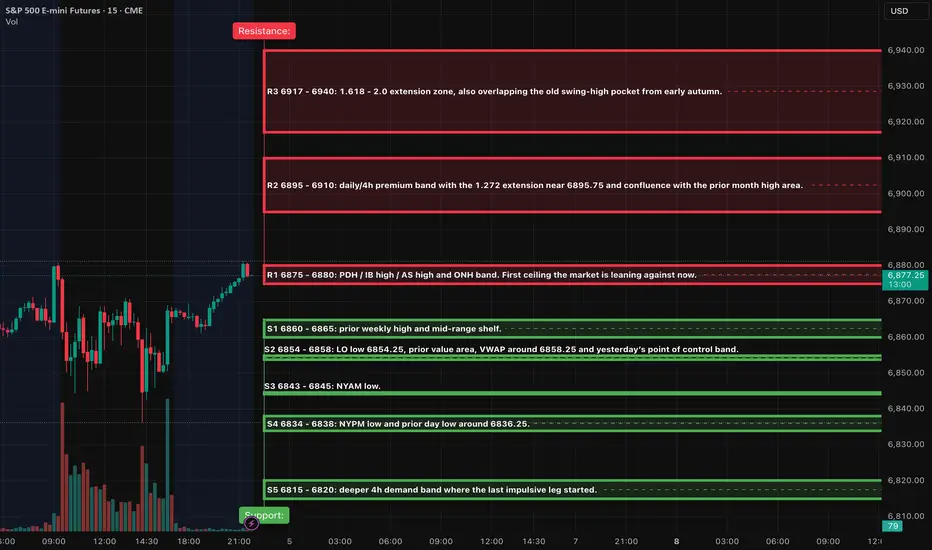
The daily trend remains firmly upward, with prices pressing against the November swing-high band, characterized by a sequence of higher lows and a gradual ascent toward previous peaks. Momentum indicators on both the daily and 4-hour charts are on the rise, yet they have not entered extreme levels, suggesting a likelihood of continued upward movement into the upper premium band rather than an imminent substantial reversal.
On the 4-hour and 1-hour charts, the E-mini S&P 500 (ES) has been consolidating in a narrow range, roughly between 6835 and 6880, as it builds energy just below the prior high. This range coincides with the 1.272 to 1.618 Fibonacci extension zone, located around 6895 to 6917. Given this setup, the outlook for tomorrow appears slightly bullish, provided the price remains above the mid-range support levels.
Market Brief: Key Developments for December 5, 2025
As we approach the final Federal Open Market Committee (FOMC) meeting of the year scheduled for December 9 -10, market participants are increasingly pricing in a substantial likelihood of a 25 basis point rate cut, along with further easing anticipated in the coming year.
For tomorrow, however, it’s important to note that the widely followed November employment situation report (including Non-farm Payrolls and the unemployment rate) has been officially postponed to December 16 due to the ongoing government shutdown. While some generic calendars may still reflect the original December 5 date for the payroll figures, this information has become outdated. At this time, it appears unlikely that any partial wage data will be released in lieu of the full report.
Nevertheless, many calendars are still marking U.S. hourly earnings and related labor indicators for the morning session. Expectations are set for hourly earnings, nonfarm payrolls, and unemployment rate placeholders around 8:30 AM ET, alongside the University of Michigan consumer sentiment and inflation expectations reports at 10:00 AM ET.
In practical terms, traders should expect regular liquidity levels in Asian and London markets. However, be prepared for potential volatility spikes around the 10:00 AM ET release of the U. Michigan data, especially if any unexpected headlines arise concerning the delayed labor report.
Market Outlook: Overnight Trends into New York Trading Session
As we head into the New York trading session, the key focus remains on the E-mini S&P 500 (ES). The base case scenario suggests that as long as ES maintains support above the significant range of 6854 to 6858 - often referred to as S2 - during any dips seen in the Asian and London sessions, we can anticipate a gradual upward movement. This trajectory would likely involve repeated testing of resistance levels around 6875 to 6880 (R1). Should we witness consistent hourly closes that approach this resistance with only modest pullbacks toward 6860, the likelihood of a breakout toward the premium zone of 6895 to 6910 increases, potentially occurring before or during the New York session.
On the other hand, the alternative scenario would unfold if the market decisively breaks below S2, resulting in a series of hourly closes beneath 6854. Such a development would signal a shift in sentiment and a potential rotation toward support levels S3 and S4, which target 6835. This would likely create a mean-reversion environment, with trading in New York focused more on the lower half of the 6835 to 6880 range rather than pushing for a breakout above resistance. Investors should tread carefully as these scenarios develop.
A++ setup 1 - Long breakout continuation above 6875
Bias: continuation long, only if we see real acceptance above R1.
Trigger conditions:
15m candle closes with a solid body above 6880, turning the 6875 - 6880 band from
Entry zone: 6878 - 6882 on the first 1m/5m higher low after that pullback holds.
Initial stop: 6869, tucked below the 6870 intraday pivot and just under the reclaimed band.
• TP1: 6904 - 6908, inside the 6895 - 6910 premium band, giving you roughly 2R or better if you are filled near the middle of the entry band and respect the tight stop.
• TP2: 6915 - 6918, near the 1.618 extension.
A++ setup 2 - Short reversal from failed break 6895 - 6910
Bias: high-quality fade only if the market runs stops into the premium band and then traps longs.
Entry zone: 6890 - 6896 on a retest of 6895 from below after that rejection is confirmed.
Initial stop: 6908, above the rejection high and inside the upper part of the premium band.
• TP1: 6858, back into the VWAP / prior value area pocket. That gives you roughly 2R or better if you are filled near mid-band with a 10 - 12 point stop.
• TP2: 6843 - 6845, test of NYAM low.
Tomorrow is shaping up to be a pivotal decision point following a robust advance in the market. As long as the support level around 6855 remains intact, any dips should be viewed as buying opportunities, particularly targeting the premium range of 6895 to 6917. However, a decisive rejection from this premium zone, with prices falling back through 6870, may signal an A++ short opportunity, potentially driving prices down toward 6858 and beyond.
Good Luck !!!
SPDR S&P 500 ETF (SPY)
IWM - Buy The Rumor Sell The News?Today the IWM saw massive bullish flow, almost piercing the all time high double top.
Many high beta stocks absolutely ripped higher today on huge rate cut expectations.
There a strong chance they may keep small caps strong into the rate cut, which could set up a buy the rumor sell the news.
The rate cut is next week December 10th and it sure has fueled this rally.
we have been trimming some of our long positions into this strength and still have long exposure in key names.
Today we closed
AMEX:UMAC NASDAQ:DPRO FOR 15 - 17% GAINS
NYSE:SLB CALLS 45% GAIN
NYSE:ACN CALLS 102% GAIN

$GLXY Galaxy Digital Inc. Earnings and Technical AnalysisQ3 Earnings Report Overview
On Tuesday, October 21, 2025 at 7:46 AM ET, Galaxy Digital Inc. (GLXY) released its third quarter earnings report for the period ended September 2025. The company announced earnings of $1.12 per share on revenue totaling $29.22 billion. This performance significantly surpassed the consensus estimates, which had projected earnings of $0.38 per share on revenue of $14.69 billion. Overall, Galaxy Digital Inc. exceeded expectations by 194.74%.
Company Background
Galaxy Digital Inc. is recognized as a global leader in digital assets and data center infrastructure. The company delivers innovative solutions aimed at accelerating advancements in finance and artificial intelligence.
Market Reaction and Technical Analysis
Despite reporting strong earnings and revenue figures, Galaxy Digital Inc.’s stock price declined by over 45% following the announcement. This unexpected reaction highlights the challenge of predicting investor sentiment based solely on earnings results. Recently, however, buyer interest has returned, as indicated by a rounded bottom formation on the stock chart. The stock broke above a previous resistance level and has also reclaimed the 20-day Exponential Moving Average (EMA).
Investment Approach
In response to these technical developments, a 1/4 size position was initiated with a stop set just below the previous day's low. The plan is to increase the position once the stock demonstrates a clear higher low and remains above the key resistance level.
Important Considerations
Readers are encouraged to conduct their own analysis and adhere to personal trading strategies. All investments carry inherent risk, and informed decision-making is crucial when allocating capital in financial markets.

Opening (IRA): SPY January 30th 605/615/730/740 Iron Condor... for a 1.25 credit.
Comments: Structuring the setup such that the credit received is about 1/10th the width of the wings which results in the short option legs being at about their respective 10 delta strikes.
Metrics:
Max Profit: 1.25 ($125)
Max Loss/Buying Power Effect: 8.75 ($875)
ROC at Max: 14.28%
ROC at 50% Max: 7.14%
Will generally look to adjust on side test or on side approaching worthless. Am looking to take profit at .25, resulting in a 1.00 ($100) realized gain.

ES (SPX, SPY) Analysis, Levels, Setups for Thursday (Dec 4th)Market Outlook: Key Event and Trading Strategy
Main Event: Tomorrow's primary focus will be the release of US Initial Jobless Claims at 8:30 AM ET. Market participants should anticipate a significant increase in volatility during the premarket session surrounding this announcement. Notably, no other major US economic indicators of similar significance are scheduled to be released, which typically influence the E-mini S&P 500 (ES) as consistently as Jobless Claims does.
Investors should consider the 8:30 AM release as the initial decision point. It is advisable to allow for the initial volatility spike to materialize before assessing market levels as they begin to normalize. The A++ trading setups detailed below are designed to activate following the 8:30 move, ideally capitalizing on opportunities that arise during the morning session in New York.
Market Analysis: Current Landscape and Outlook
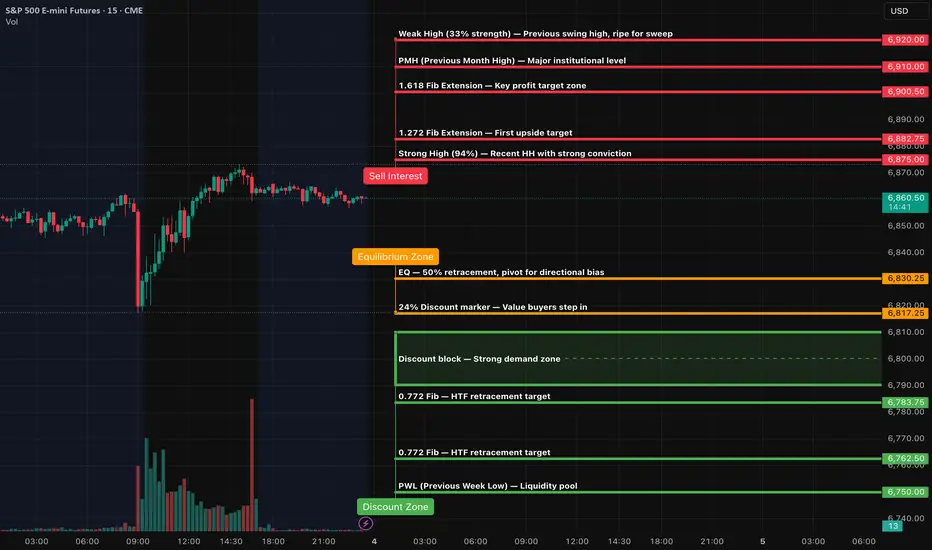
Daily Overview: The E-mini S&P 500 (ES) has maintained an upward trajectory, approaching the swing high levels from November. Currently, the price is positioned within the upper range of recent activity, just below a significant resistance zone situated in the high 6800s to low 6900s. While daily momentum indicators remain in positive territory, they are showing elevated levels, suggesting potential for upside continuation. However, the reward for initiating new long positions in proximity to resistance appears limited at this juncture.
An examination of the four-hour chart reveals a sideways trading band beneath the recent highs. Despite repeated attempts to breach the upper boundary, gains have not been sustained, though buyers continue to defend pullback levels. Below the current price, a notable demand zone exists between 6815 and 6825, with a deeper support area around 6780 to 6790. Should the 6815 level hold on a closing basis, the medium-term trend remains favorable.
Today’s price activity has formed a tight range, approximately between 6857 and 6865, with the previous day’s high located near 6873 and early lows today around 6820. The market appears to be consolidating near last week’s highs, with clear liquidity zones identified both above 6873 and below 6840.
For the overnight session extending into the New York trading day, the expectation is sideways-to-up as long as the price remains above 6815. This scenario suggests potential squeezes toward the 6885 to 6900 range before a more significant decision point emerges. Conversely, a decisive break and 15-minute close below the 6815 level would open the door to the 6780 to 6790 region and would likely temper the bullish outlook heading into Friday's session.
A++ Setup 1 - Short from upper band 6885-6898
Entry zone: 6882-6888 short on the first clean 5m lower high after the 15m rejection.
Initial stop: above 6898 (or 2-3 points above the rejection wick if that printed higher). From a mid-band entry, this is roughly 10-12 points of risk.
• TP1: 6860-6863 (return to the top of today’s box and prior week high zone).
• TP2: 6835-6840 (mid-band support).
• Optional runner TP3: 6818-6822 if 6840 fails and selling pressure accelerates.
Invalidation
A decisive 15m close above 6898 that then holds on a pullback. In that case, the short idea is downgraded and price is more likely aiming for 6915-6925.
A++ Setup 2 - Long from demand pocket 6815-6825
Entry zone: 6820-6826 long after the first clean 5m higher low and reclaim of 6825.
Initial stop: under 6808-6810, below the rejection wick and the lower edge of the pocket. From a 6823 entry this is about 13-15 points of risk.
• TP1: 6857-6860 (today’s box floor and first resistance on the way back up).
• TP2: 6868-6873 (prior day high and recent NYPM highs).
• Optional runner TP3: 6885-6895 if price continues squeezing toward the upper resistance band.
Invalidation
A 15m close beneath 6810 that is not reclaimed quickly. That opens the way toward 6780-6790 and downgrades the long.
Good Luck !!!
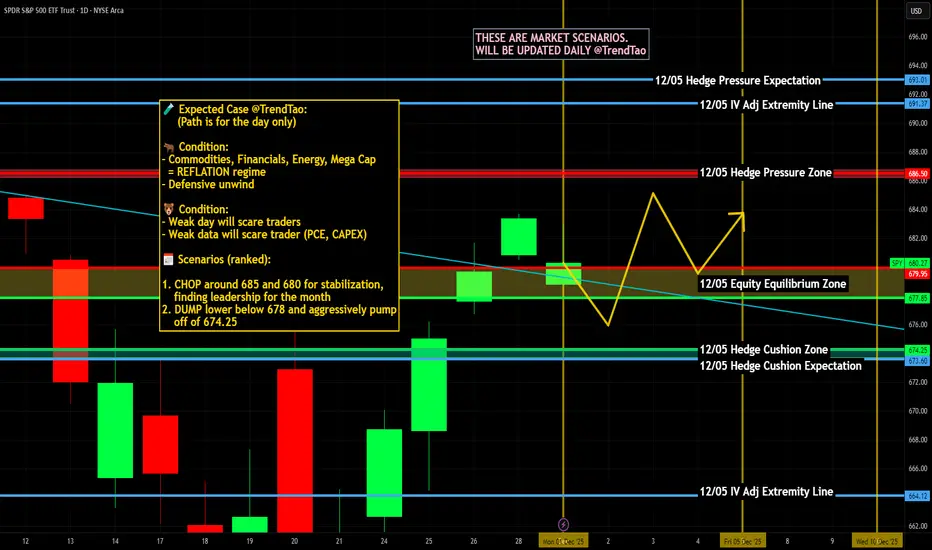
$SPY & $SPX Scenarios — Thursday, Dec 4, 2025🔮 AMEX:SPY & SP:SPX Scenarios — Thursday, Dec 4, 2025 🔮
🌍 Market-Moving Headlines
🧱 Labor pulse before the weekend: Weekly claims remain a key gauge of cooling versus resilience in the labor market — especially with jobs data still disrupted from prior shutdown delays.
🎤 Bowman speaks at noon: Moderate-impact event, but tone on regulation, credit conditions, and inflation watch may move yields slightly in a light-data session.
📊 Key Data and Events (ET)
⏰ 8 30 AM
• Initial Jobless Claims (Nov 29): 220,000 vs 216,000
⏰ 12 00 PM
• Fed Vice Chair for Supervision Michelle Bowman — Remarks
⚠️ Disclaimer: Educational and informational only — not financial advice.
📌 #SPY #SPX #macro #labor #joblessclaims #fed #markets #stocks #trading #investing
MSTR - Wave 4? - Next stop 197-202 then reload for 220-235!THESIS
The recent price action confirms a bullish Elliott Wave impulse move from the $155.61 low. The market has validated an Extended Wave 3 by successfully holding the maximum 61.8% retracement level during the deep Wave 4 pullback (low of $177.82).
We are now in the final thrust of Minor Wave 5, we should then see a 3 wave pullback which sets up the full corrective rally to our higher-degree target of $220-$235!
Analysis & Targets (Aligned to the Chart)
1. 🎯 Wave (A) Completion: The Final Minor Impulse
The current action is the final push of Minor Wave 5 (the fifth wave of the initial impulse from the $177.82 low).
• Entry Signal: The bounce from the $177.82 low confirmed the Wave 4 bottom.
• Target Zone (A): The technical projection for Wave 5 (using W5 = W1 or 0.618 \times W1-3) places the peak between $196 - $202
• Action: This is the initial profit-taking zone. Look to sell calls here, as this completes the first major structural move.
2. 🌊 Wave (B) Correction: The High-Grade Reload
Once the Wave (A) target is hit, a larger corrective pullback (Wave (2) in the larger context) is mandatory before the final surge. Since the preceding Wave 4 was sharp/deep, this Wave (B) correction is likely to be shallow/sideways (a Flat or Triangle) to adhere to the Principle of Alternation.
• Target Zone (B): We project a 38.2-50-61.8% retracement of the entire impulse. This places the reloading zone between $182 - $172 (The green box on the chart).
• Action: This is the Optimal Reloading Zone for long positions before the final rally.
3. 🚀 Wave (C) Final Target: The Greater Rally Peak
The final Wave (C) completes the overarching corrective rally. This leg is targeting a significant Fibonacci retracement of the prior, large bear wave.
• Target Zone (C): The $220 - $235 box is perfectly aligned with the high-probability 38.2% of the massive Wave 3 down that preceded this entire rally.
• Action: This is the final take-profit target for the entire trade structure.
Key Levels to Watch
• Buy Target (Sell Limit): $197 (Exit Minor W5).
• Reload Zone: $182- $172 - (Buy the Wave B dip).
• Invalidation Price: $170 (A close below this invalidates the entire impulse).
Good luck with the final wave! Remember to manage risk and set a stop loss! I am a guy on the internet and not a financial advisor!
#ElliottWave #MSTR #Bitcoin #Bullish #TechnicalAnalysis

US30 - DOW Hits Major Supply Reversal coming on Dow as it hits a major supply zone. This is part of a bigger cross-asset move that I am anticipating across global equities. I see a synchronised sell off in global equities coming this month.

SPX - H4 - SELL SETUP - Supply Retest confirmedSPX has entered bear market territory last month and I expect a continuation to the downtrend from here onward. Based on many different macro indicators such as credit default swaps on big tech, macro regimes, sentiment and technical analysis. I see SPX falling off the clip from this precise supply zone

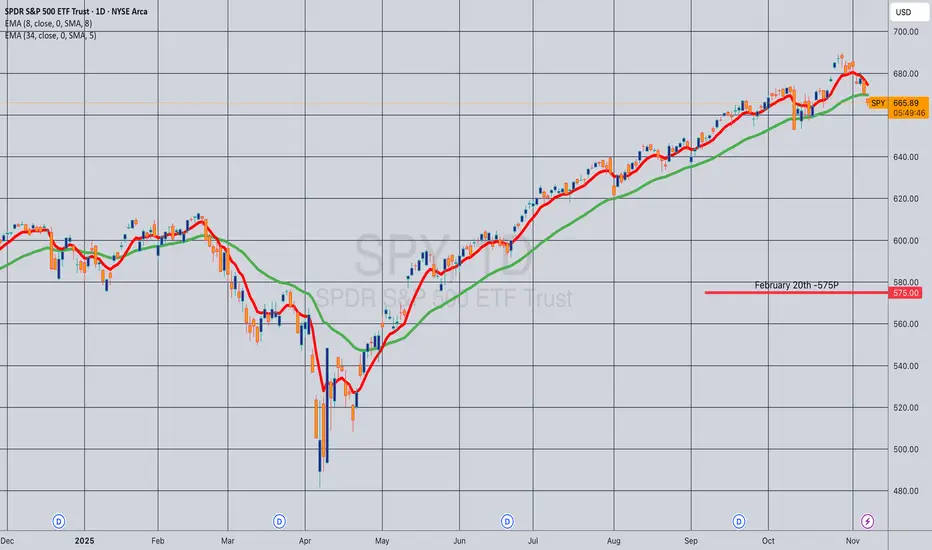
Opening (IRA): SPY March 20th -550P... for a 5.75 credit.
Comments: Adding at intervals, assuming I can get in at prices better than what I current have on. Targeting the strike paying around 1% of the strike price in credit.
I'm going out quite far dated here because I already have rungs on in December 31st (-642P), January (-605P, -625P), and February (-575P, -600P) expiries and didn't want to step on those as it were as I look to manage them via roll.

Opening (IRA): SPY February 20th -600P... for a 6.09 credit.
Comments: Laddering out at strikes better than what I currently have on. It would be better if I had weakness, but I've got dry powder for that should it occur.
Targeting the strike paying around 1% of the strike price in credit. Will generally roll to lock in realized gains and/or "window dress" (i.e., roll down and out to a lower strike paying approximately the same amount of credit.

Opening (IRA): SPY January 16th -575P... for a 5.94 credit.
Comments: Laddering out ... . Targeting the strike paying around 1% of the strike price in credit. Will look to add at intervals, assuming I can get in at strikes/break evens better than what I currently have on and/or roll out short put at 50% max.
Opening (IRA): SPY February 20th -575P... for a 5.93 credit.
Comments: Adding at strikes better than what I currently have on, targeting the strike paying around 1% of the strike price in credit.
Opening (IRA): SPY January 16th -605P... for a 6.28 credit.
Comments: Adding at strikes better than what I currently have on, targeting the strike price paying around 1% of the strike price in credit.

Opening (IRA): SPY December 19th -605P... for a 6.47 credit.
Comments: On second thought, going to ladder out a bit here on weakness plus higher IV. Targeting the strike paying around 1% of the strike price in credit.
Will look at add at intervals, assuming I can get in at strikes better than what I currently have on and/or roll out at 50% max.

$SPY & $SPX Scenarios — Wednesday, Dec 3, 2025 🔮 AMEX:SPY & SP:SPX Scenarios — Wednesday, Dec 3, 2025 🔮
🌍 Market-Moving Headlines
💼 Labor + services-heavy morning: ADP, import prices, services PMIs, and ISM all land before 10 AM — a full macro pulse on jobs, inflation pressure, and service-sector strength.
🧾 Shutdown-delayed September reports continue: Import Prices, Industrial Production, and Capacity Utilization still come from the backlog but remain relevant for inflation and growth trend review.
📈 ISM Services is the star: With manufacturing soft, services remain the market’s key gauge of economic momentum into year end.
📊 Key Data and Events (ET)
⏰ 8 15 AM
• ADP Employment (Nov): 40,000 vs 42,000
⏰ 8 30 AM
• Import Price Index (Sept, delayed): 0.1 percent vs 0.3
• Import Prices ex Fuel (Sept, delayed): 0.4 percent
⏰ 9 15 AM
• Industrial Production (Sept, delayed): 0.1 percent
• Capacity Utilization (Sept): 77.3 percent
⏰ 9 45 AM
• S and P Final United States Services PMI (Nov): 55.0
⏰ 10 00 AM
• ISM Services (Nov): 52.5 percent
⚠️ Disclaimer: Educational and informational only — not financial advice.
📌 #SPY #SPX #trading #macro #ADP #services #ISM #inflation #imports #markets #investing
DXY EXTREME BEARISH DIVERGENCE > ABOUT TO COME STRAIGHT DOWN!DXY Has been on a tear but I think thats about to end and I think it will end very quickly. There is multiple very strong bearish divergences on the weekly, across multiple indicators showing that a major move down is coming. I think we have reached the top for the DXY for a while and its about to tank. Dont know whats around the corner as far as news but something big is about to come out thats going to kill the DXY. This is not trading or financial advice this is just my opinion. If you apprecaite my work please consider giving this chart a boost and follow me for more updates. Thank you and good luck my friends.

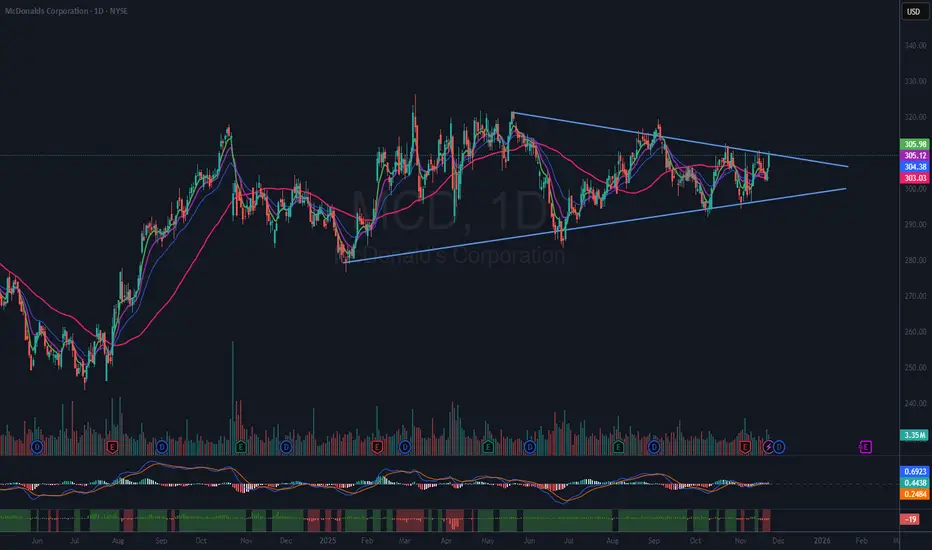
$MCD VCP (Volatility Contraction Pattern) AnalysisOverview of the VCP Pattern in MCD
The Volatility Contraction Pattern (VCP), originally named by Mark Minervini, is characterized by a series of price contractions accompanied by declining volume. While Minervini typically focuses on shorter timeframes with more pronounced contractions and volume reductions, the current setup in McDonald's Corporation (MCD) appears to align with the fundamental principles of the VCP.
Recent Volume and Price Action
One notable feature in MCD’s recent trading activity is the relationship between up-day and down-day volumes. Since the release of earnings, the volume on down days has been consistently lower than the volume on up days, suggesting underlying buying support during contractions.
Breakout Attempts and Trading Strategy
Throughout the past month, MCD has made several attempts to break out of its current consolidation range. To monitor potential breakout opportunities, an alert has been set on the upper downtrend line. If the stock manages to break above this trend line, plans are in place to initiate a position, with a stop order set just below the most recent low. This low is also situated near the 50-day moving average (DMA), which may act as a support level.
Risk Management and Reader Guidance
All readers are strongly encouraged to conduct their own analysis and adhere to their individual trading rules. It is crucial to recognize that all investments carry inherent risks. Making informed decisions is essential for prudent capital allocation and long-term success in trading.
The Bond Markets Effect on the Stock MarketThe trend shown here is what helped me derisk prior to sustained market pullbacks seen during the Covid crash and in early 2022. When the 10Y rises sharply, the stock market usually pulls back in the days / weeks to follow. The major 10Y trend can be seen in my previous post which uses the blue lines shown here to show the large wedge that is forming. Right now we are bottoming on this wedge again and forming an upside down Head and Shoulder pattern. I believe we will have a Santa crash this year instead of a Santa rally if the 10Y breaks out of this pattern and continues to climb higher. AMEX:SPY TVC:US10Y FOREXCOM:SPX500 NASDAQ:NVDA NASDAQ:QQQ

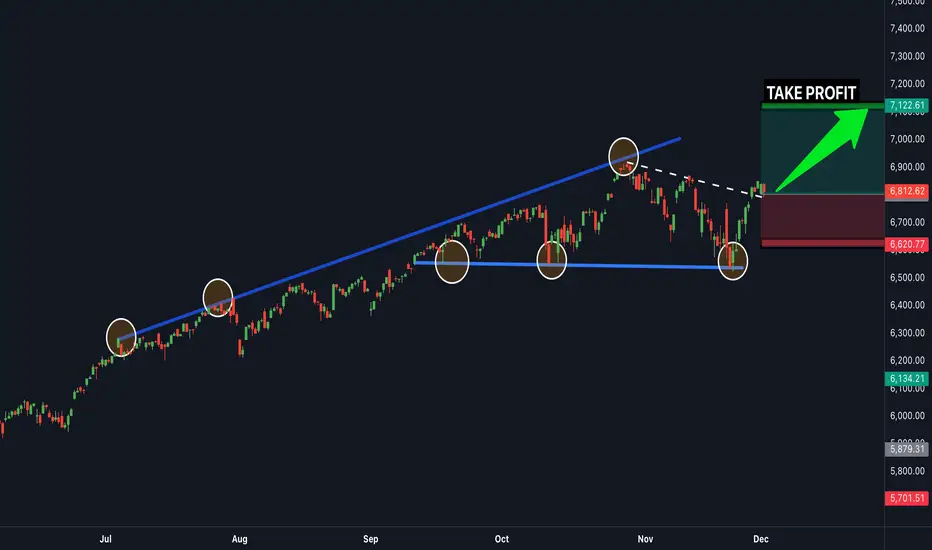
BUY SPX NOW...time to buySPX500 is in a clear upwards channel and has broken the last bit of resistance (white trendline line shown) - this is a clear confirmation that the next target will be the next resistance zone to the upside shown above (this is a great buy trade opportunity) - Time to buy!
ES (SPX, SPY) Analysis, Levels, Setups for Tue (Dec 2nd)The market structure remains optimistic on the higher timeframes, bolstered by a significant rebound from the 6,520 levels. Currently, prices are fluctuating in the upper range of this move, consolidating between the intraday support and the previous weekly high. Although momentum indicators are stretched, they have yet to indicate a reversal, suggesting a potential continuation toward resistance levels R1 and possibly R2, provided that buyers can uphold the nearest support zones. Conversely, a failure to maintain support at S1 and S2 could pave the way for a deeper corrective phase targeting S3.
The levels are remain the same from yesterday analysis.
A++ SETUP 1 - LONG FROM S2 RELOAD BAND (6,790-6,805)
look for an overnight or early NY flush into 6,800 ± 10 points, followed by a strong rejection: wick below S2 on 15m, close back inside the band, plus a higher low on 5m.
Entry zone: 6,800-6,795 (inside S2 once rejection shows).
Hard stop: 6,780 (below the lower edge of S2 and recent wick structure).
TP1: 6,845-6,855 (back through S1 into the middle of the current range).
TP2: 6,870-6,885 (R1 test).
A++ SETUP 2 - SHORT LIQUIDITY SWEEP INTO R1 (6,870-6,885)
during London or NY AM, price spikes through 6,870 into the 6,870-6,885 band, takes out prior highs, but then prints a rejection: 15m candle with an upper wick and close back below about 6,875, plus a lower high on 5m.
Entry zone: 6,875-6,880 after the rejection is confirmed, not on the first blind touch.
Hard stop: 6,895 (above the top of R1; acceptance above there suggests a push toward R2).
TP1: 6,835-6,840 (back into S1).
TP2: 6,800-6,795 (retest of S2).
Key Events and Data to Watch on Tuesday
Tomorrow's U.S. session will be pivotal, focusing on key indicators of manufacturing and construction. The final S&P Global U.S. Manufacturing PMI will be released at 9:45 a.m. ET, followed closely by the ISM Manufacturing Index at 10:00 a.m. ET—both crucial for assessing factory activity and the momentum of economic growth. Concurrently, the Commerce Department will unveil October Construction Spending figures, a vital metric for understanding demand in infrastructure and housing sectors. Additionally, domestic vehicle sales data will be published, providing further insight into consumer strength.
Moreover, the OECD's latest Economic Outlook will present updated global growth projections, which could significantly influence market risk appetite. As markets remain attuned to indicators of decelerating economic activity, any surprises in these reports could lead to notable shifts between support levels (S2) and resistance levels (R1/R2), potentially reinforcing expectations for a rate cut from the Fed in December.
$SPY & $SPX Scenarios — Tuesday, Dec 2, 2025 🔮 AMEX:SPY & SP:SPX Scenarios — Tuesday, Dec 2, 2025 🔮
🌍 Market-Moving Headlines
🎤 Bowman testimony hits at 10 AM — this is the only fixed macro event of the day, and her tone on regulation and economic conditions can nudge yields.
🚗 Auto Sales (Nov) TBA — release time unclear, but this report can move cyclicals if it prints far from expectations. Previous level was 16.4 million annualized.
📊 Key Data and Events (ET)
10 00 AM
• Fed Vice Chair for Supervision Michelle Bowman — Testimony
TBA
• Auto Sales (Nov)
Previous: 16.4 million
Note: Release time is not announced
⚠️ Disclaimer: For educational use only, not financial advice.
📌 #SPY #SPX #stocks #macro #fed #autosales #markets #trading #investing
S&P 500 (ES1!): Bullish! Look For Valid Buys!Welcome back to the Weekly Forex Forecast or the week of Dec. 1-5th.
In this video, we will analyze the following FX market: S&P 500 (ES1!)
The S&P500 rallied last week, closing strong! Look for follow through going into this week.
Go with the overall bullish trend until there is a bearish market structure break.
Enjoy!
May profits be upon you.
Leave any questions or comments in the comment section.
I appreciate any feedback from my viewers!
Like and/or subscribe if you want more accurate analysis.
Thank you so much.
Disclaimer:
I do not provide personal investment advice and I am not a qualified licensed investment advisor.
All information found here, including any ideas, opinions, views, predictions, forecasts, commentaries, suggestions, expressed or implied herein, are for informational, entertainment or educational purposes only and should not be construed as personal investment advice. While the information provided is believed to be accurate, it may include errors or inaccuracies.
I will not and cannot be held liable for any actions you take as a result of anything you read here.
Conduct your own due diligence, or consult a licensed financial advisor or broker before making any and all investment decisions. Any investments, trades, speculations, or decisions made on the basis of any information found on this channel, expressed or implied herein, are committed at your own risk, financial or otherwise.
