$PLTR Basing Analysis: 3-Month Technical OutlookFor the past twelve weeks, NASDAQ:PLTR has been consolidating near its all-time high (ATH). This prolonged basing period has resulted in the formation of a distinctive wedging pattern, commonly known as a Volatility Contraction Pattern (VCP). This pattern, popularized by Mark Minervini, is characterized by decreasing price swings and tightening ranges.
Technical Pattern and Implications
The VCP that has emerged on NASDAQ:PLTR 's chart typically signals a potential continuation in the direction of the prevailing trend. In this instance, the trend leading into the pattern has been upward, suggesting that a breakout to the upside could be the most likely scenario.
Trading Plan
To prepare for a possible breakout, an alert has been set just below the horizontal resistance area. If this alert is triggered, the plan is to initiate a new position in anticipation of further upward movement. While price targets are not usually set, in this case, an estimated gain of approximately 18% is anticipated following a breakout. This projection is based on the depth of the pullback from the ATH.
Risk Management and Disclaimer
Readers are strongly encouraged to conduct their own analysis and to adhere to their personal trading rules. Investing in the stock market always carries risk, and it is essential to make informed decisions with your own capital.
SPDR S&P 500 ETF (SPY)

I could be wrong! Why stocks could go higher.Trading Fam,
It has been a whole year of testing my AI-crafted indicator, and I am learning to trust it more and more as I go. We recently reached my third and final target on the SPY. I sold. Did I sell too early. Possibly. If I was to wait for my indicator, I'd still be in long positions. Let's take a look at what my incredibly accurate indicator is telling us.
✌️Stew

Stock Market New Highs on CPI? Lotto call option? Tomorrow is the CPI report.
Inflation headline number is expected to be 3.1%.
We will likely see a positive reaction tomorrow which should send the S&P500 to new all time highs.
If we gap up into new all time highs be very careful as this usually gets sold into.
We took a lotto call option on NASDAQ:CRML with members.
This is a pure speculative dead cat bounce play.

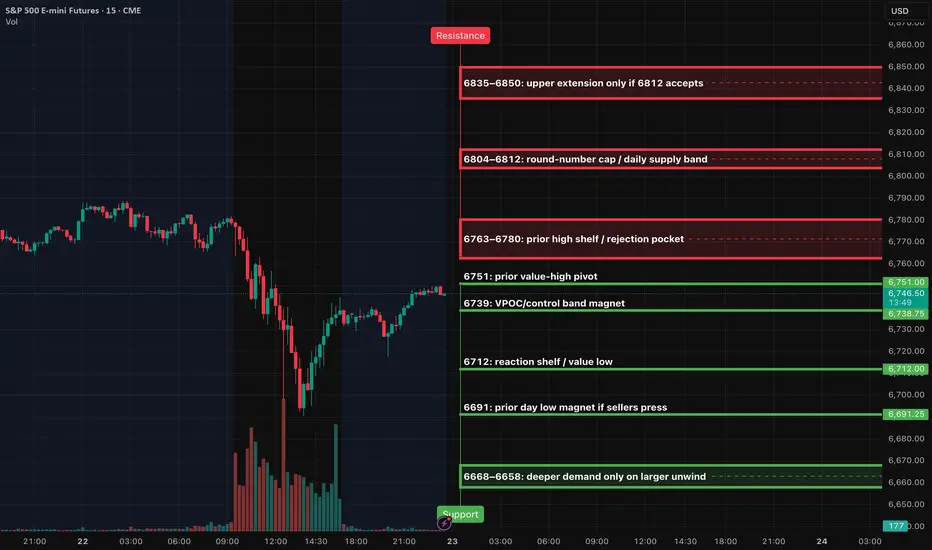
ES (SPX, SPY) Analysis, Key Levels, Setups for Thur (Oct 23)Bias: The market shows a neutral to slightly bullish outlook as long as prices remain above the 6739–6751 control band. A decisive break and sustained trading above 6780 would indicate a shift in momentum to the upside, targeting the levels of 6804 to 6812. Conversely, if we lose support at 6739, we could see a decline toward 6712, with 6691 serving as a key level that may attract selling pressure.
Execution windows: London 02:00–05:00 optional small size. NY AM 09:30–11:00 primary. NY PM 13:30–16:00 primary. Midday is manage-only; avoid initiating.
Setups
Short pop-and-fail at 6773–6780
– Trigger: 15m rejection back inside the band → 5m re-close below ~6773 → first 1m pullback stalls beneath 6773
– Entry: sell the pullback beneath 6773
– Stop: hard SL above the 15m rejection wick by 0.25–0.50
– Targets: TP1 6751, TP2 6739, TP3 6712
– Invalidation: 6780 converts to support on a full-body 15m close
Long breakout continuation above 6780
– Trigger: 15m full-body close beyond 6780 → 5m pullback holds 6777–6780 and re-closes up → 1m higher-low entry
– Entry: buy the hold at 6777–6780
– Stop: hard SL below the 15m trigger wick by 0.25–0.50
– Targets: TP1 6804, TP2 6812, TP3 6835–6850
Long sweep-and-reclaim at 6712 → 6691
– Trigger: quick sweep of 6712 (or flush toward 6691) that immediately reclaims 6712 on 5m → 1m higher-low entry
– Entry: buy first pullback after the reclaim of 6712
– Stop: hard SL below the 15m sweep wick by 0.25–0.50
– Targets: TP1 6739, TP2 6751, TP3 6773–6780
ES (SPX, SPY) Analysis, Key Levels, Setups for Wed (Oct 22)Key catalysts and schedule (ET): The federal shutdown continues, pausing most government statistics. There is no 8:30am tier-1 macro release expected. The energy markets will receive the EIA Weekly Petroleum Status Report at 10:30am. Of particular note, the Fed’s Michael Barr is scheduled to speak during the U.S. day, a potential market-moving event. Earnings reports from AT&T, Thermo Fisher, Boston Scientific, and Vertiv before the open, and IBM after the close, could also sway the index mood.
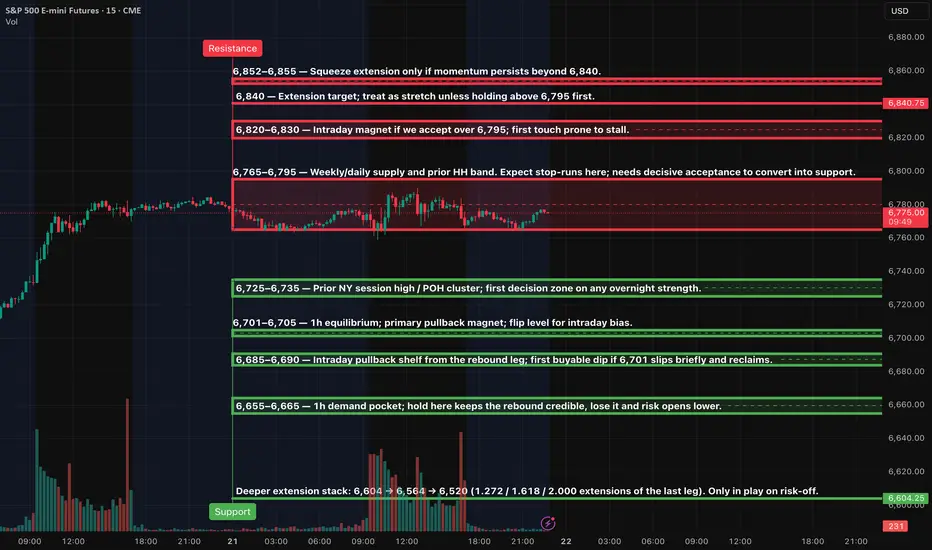
Key zones — resistance: The 6,765–6,795 zone, serving as the weekly/daily supply and prior high-high band, remains a crucial area of focus. It is the first ceiling to consider. The 6,820–6,830 zone becomes an intraday magnet if we manage to hold above 6,795. The 6,840 stretch target is a significant level that requires time above 6,795 first. The 6,852–6,855 zone is a potential squeeze extension, but only if momentum persists beyond 6,840.
Key zones — support: 6,725–6,735 is the prior NY session high / POH pocket and first decision area on any overnight strength that fades; 6,701–6,705 is the 1h equilibrium and flip line for intraday bias; 6,685–6,690 is the intraday pullback shelf and first buyable dip if 6,701 briefly slips and reclaims; 6,655–6,665 is the 1h demand pocket that keeps the rebound credible; 6,604 is the deeper extension stack that only comes into play on risk-off.
Overnight → NY forecast: baseline expectation is a range build under the 6,765–6,795 ceiling with stop-runs into the band and fades back toward 6,735 and 6,705; acceptance and sustained holding above 6,795 turns the tape constructive toward 6,820–6,830, with a paced push to 6,840 and only a momentum extension opening 6,852–6,855; loss of 6,701 during Asia/London that does not quickly reclaim tilts the path toward 6,690 and 6,665 before buyers try again; if 6,665 gives way decisively, risk opens to 6,604 where a larger bounce attempt is favored.
Setups (Level-KZ Protocol, 15m→5m→1m)
Short fade at the 6,765–6,795 band on the first clean test: enter on a 15m close back inside the band and a 5m re-close with a lower-high; place SL above 6,805–6,810; target 6,735 for TP1, 6,705 for TP2, 6,690 for TP3; if TP1 prints, close 70% and set the 30% runner to BE.
Long continuation only after real acceptance above 6,795: wait for a 15m full-body close above, then buy the 5m pullback that holds 6,795–6,800; SL 6,785; target 6,820–6,830 for TP1, 6,840 for TP2, 6,852–6,855 for TP3.
Quick-reclaim bounce at 6,701–6,705: if we sweep 6,701 and instantly reclaim on 1m/5m, buy the reclaim with SL 6,695; target 6,735 for TP1, 6,771–6,780 for TP2, 6,795 test for TP3.
Deeper flush-and-reverse at 6,655–6,665: buy only on confirmation (15m wick-rejection + 5m higher-low); SL 6,649; target 6,690 for TP1, 6,705 for TP2, 6,735 for TP3.
Bear continuation only if 6,701 is lost and holds below: sell the underside retest of 6,701–6,705; SL 6,712; target 6,690 for TP1, 6,665 for TP2, 6,604 extension for TP3 if momentum expands.
Bias and invalidation: The market currently exhibits a ' two-sided bias ', meaning it is neither bullish nor bearish, while we are trapped between 6,705 and 6,795. The tape turns constructive for extensions only after holding above 6,795 for multiple 15m closes. The intraday bias flips lower if we slip and cannot reclaim 6,701 on 15m closes. Invalidate any long if 6,665 breaks and holds; invalidate any short if we base above 6,830 and the first pullback defends 6,820.
Kill-zones and execution plan: Asia (20:00–00:00 ET) is optional and sized down; look for the 6,701 sweep/reclaim; London (02:00–05:00 ET) favors range probes into 6,735 or 6,705; NY AM (09:30–11:00 ET) is primary — fade the first touch of 6,795 if we gap under it, or buy the 6,795 pullback if we gap and hold above; manage lunch as maintenance only (12:00–13:00 ET); NY PM (13:30–16:00 ET) allows a final push toward 6,840 only if 6,820–6,830 converts to a floor.
Risk and management rules (applied to all plays): use a hard stop anchored to the relevant 15m wick ±0.25–0.50; take no partials before TP1; at TP1 close 70% and move the runner to BE; allow no more than two attempts per level per session; time-stop any trade that hasn’t hit TP1 or SL within 45–60 minutes.
S&P 500 (ES1!): Wait For Valid Buy Setups!Welcome back to the Weekly Forex Forecast for the week of Oct. 20-24th.
In this video, we will analyze the following FX market: S&P 500 (ES1!)
The S&P500 is ranging. More neutral than bullish. But Friday's bullish close indicates potential bullish order flow going into this week.
If price can manage to trade above the Monthly Open at 6,725, than buys become valid.
I'm not interested in selling this market, unless I see a sure enough bearish BOS.
Enjoy!
May profits be upon you.
Leave any questions or comments in the comment section.
I appreciate any feedback from my viewers!
Like and/or subscribe if you want more accurate analysis.
Thank you so much!
Disclaimer:
I do not provide personal investment advice and I am not a qualified licensed investment advisor.
All information found here, including any ideas, opinions, views, predictions, forecasts, commentaries, suggestions, expressed or implied herein, are for informational, entertainment or educational purposes only and should not be construed as personal investment advice. While the information provided is believed to be accurate, it may include errors or inaccuracies.
I will not and cannot be held liable for any actions you take as a result of anything you read here.
Conduct your own due diligence, or consult a licensed financial advisor or broker before making any and all investment decisions. Any investments, trades, speculations, or decisions made on the basis of any information found on this channel, expressed or implied herein, are committed at your own risk, financial or otherwise.

SPY FREE SIGNAL|SHORT|
✅SPY is reacting from the all-time-high zone where institutional orders previously accumulated. A short-term retracement is likely as price sweeps liquidity above premium highs before rebalancing to the nearest fair-value gap. Time Frame 2H.
SHORT🔥
✅Like and subscribe to never miss a new idea!✅

S&P 500 Elliott Wave Analysis: Approaching the End of Wave 5I believe the S&P 500 is nearing the end of wave 5, possibly complete already or very soon, based on ES future and SPX charts. The wave 4 low from April 2025 (~5000) should be retested in a 3-wave ABC pullback, targeting late 2026 to early 2027, aligning with Fibonacci time frames. RSI divergence and ending patterns support this. Thoughts?

S&P Stalls, Gold & Silver Reality Check, US vs China WatchGold and Silver finally correcting - and I'm dollar cost averaging into dips
US Indexes (S&P, Nasdaq, Dow, Russell) stalling just off of all-time highs
Sideways is a behavior and it might seem boring, but it's certainly better than
the market rolling over and falling hard for 5-10% corrections (TBD)
AI Narrative remains optimistic
-I like the utilities, energy, and physical goods side of AI over software and hype
Financials and CAPEX spending remains firm
-money continues to flow into this AI buildout
Trump vs China is likely noise and eventual concessions and agreements
are likely the outcome - but the market is waiting for proof for now
US CPI data hitting Friday (first real US news in weeks) - does the market react?
Watch for broadening pattern and fakeouts, but the big tell with this market
pushing for more upside is the massive drop in VIX last week and once again
flirting with all-time highs
Thanks for watching!!!
-Chris

Tuesday, Oct 21st Weekly Forecast UPDATES!Welcome to the Weekly Forecast Updates!
In this video, we will analyze the following markets: DXY, EURUSD, GBPUSD, NASDAQ, S&P500
Enjoy!
May profits be upon you.
Leave any questions or comments in the comment section.
I appreciate any feedback from my viewers!
Like and/or subscribe if you want more accurate analysis.
Thank you so much
Disclaimer:
I do not provide personal investment advice and I am not a qualified licensed investment advisor.
All information found here, including any ideas, opinions, views, predictions, forecasts, commentaries, suggestions, expressed or implied herein, are for informational, entertainment or educational purposes only and should not be construed as personal investment advice. While the information provided is believed to be accurate, it may include errors or inaccuracies.
I will not and cannot be held liable for any actions you take as a result of anything you read here.
Conduct your own due diligence, or consult a licensed financial advisor or broker before making any and all investment decisions. Any investments, trades, speculations, or decisions made on the basis of any information found on this channel, expressed or implied herein, are committed at your own risk, financial or otherwise.

ES (SPX, SPY) Analysis, Key Levels, Setups Tue (Oct 21)Market Update for Traders:
Context:
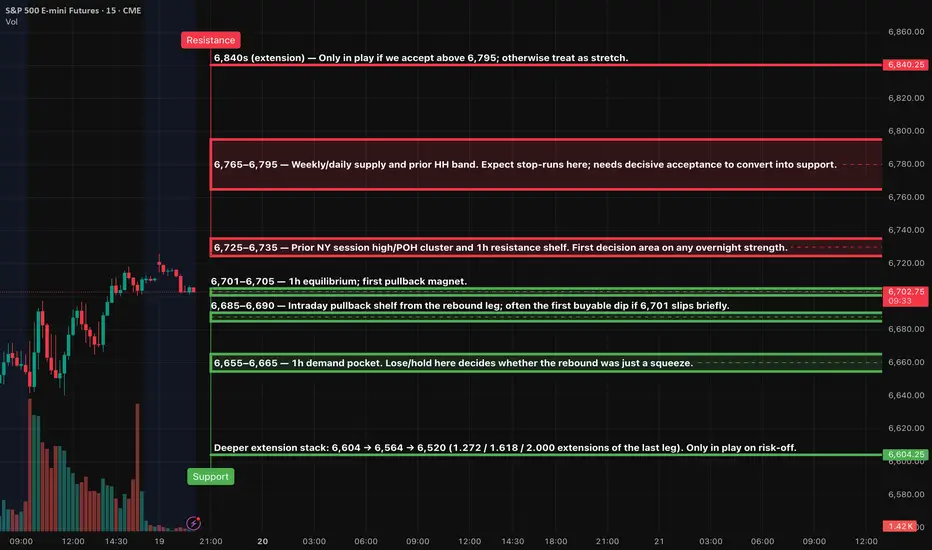
Currently, the price is approaching a key supply zone between 6,765 and 6,795. While we have seen a series of higher highs on the 1-hour chart, the momentum appears to be flattening. Below this supply level, we have identified some significant areas to monitor. The first clean value area on the 1-hour chart is around 6,701 to 6,705, with a visible pullback shelf located between 6,685 and 6,690. There's also a stronger demand zone in the 6,655 to 6,665 range. If we manage to break above the supply cap at 6,795, the next measured extension target is around 6,840, but this should be treated as a stretch unless we see solid acceptance above 6,795.
Key Zones to Watch:
Resistance:
- 6,765–6,795 (this is the current cap)
- Extension potential at 6,840, provided we see firm acceptance above 6,795.
Support:
- Look for the first decision point around 6,725–6,735, which reflects overnight strength.
- 6,701–6,705 is a key equilibrium area.
- The shelf for the first buyable dip lies at 6,685–6,690.
- Further support is found in the demand pocket at 6,655–6,665.
- If we encounter a deeper risk-off scenario, watch for extensions down to 6,604, 6,564, and 6,520, but only if we see a decisive failure in the rebound.
Setups:
Setup 1 — Rejection Short at 6,765–6,795 (A++)
Entry: 6,788–6,793 after a 5m re-close back below 6,795 and a 1m lower-high
Stop (SL): 6,804.50 (above rejection wick/upper edge)
TP1: 6,729–6,733
TP2: 6,701–6,705
TP3: 6,686–6,690
Setup 2 — Acceptance Long above 6,795 (A++)
Entry: 6,796–6,799 on first pullback that holds after decisive 15m acceptance over 6,795
Stop (SL): 6,785.00 (back inside the band)
TP1: 6,822–6,828
TP2: 6,840 stretch
TP3: 6,852–6,855 if squeeze persists
Setup 3 — Quick-Reclaim Long at 6,701 (A+ Bounce)
Entry: 6,702–6,705 only if 6,701 briefly slips and then a 5m candle re-closes back above it
Stop (SL): 6,694.50
TP1: 6,729–6,733
TP2: 6,765–6,775
TP3: 6,788–6,793
Setup 4 — Shelf Long at 6,685–6,690 (A Bounce)
Entry: 6,686–6,689 with a 1m higher-low and 5m hold
Stop (SL): 6,678.00
TP1: 6,701–6,705
TP2: 6,729–6,733
TP3: 6,765–6,775
Setup 5 — Demand-Pocket Long at 6,655–6,665 (A Bounce)
Entry: 6,657–6,663 on stabilization and 1m higher-low
Stop (SL): 6,647.00
TP1: 6,686–6,690
TP2: 6,701–6,705
TP3: 6,729–6,733
Setup 6 — Breakdown Short if 6,701 Turns to Resistance (A+)
Entry: 6,698–6,701 after a 5m close below 6,701 and a retest that fails
Stop (SL): 6,707.50
TP1: 6,686–6,690
TP2: 6,665–6,660
TP3: 6,604–6,564 only if momentum stays risk-off
Management (apply to all)
take the setup only if TP1 ≥ 2.0R using the stated SL. At TP1 close 70% and set the 30% runner to break-even; runner attempts TP2→TP3 if structure supports it. Time-stop 45–60 minutes if neither TP1 nor SL is hit. Primary execution windows: NY AM 09:30–11:00 ET and NY PM 13:30–16:00 ET.

S&P500 - $8.000 is the ultimate target!🎊S&P500 ( TVC:SPX ) continues the bullrun:
🔎Analysis summary:
Over the course of the past couple of months, the S&P500 has been rallying +40%. However, this does not mean that the bullrun is over any time soon. Since the S&P500 perfectly respects the rising channel pattern, a move to the upper trendline is the target.
📝Levels to watch:
$8,000
SwingTraderPhil
SwingTrading.Simplified. | Investing.Simplified. | #LONGTERMVISION

ES (SPX, SPY) Analysis Week-Ahead (Oct 20th - 24th)Market Structure Overview
Price has shown a robust rebound from last week's discount levels, now trading back near the 6,720 area following a swift flush and subsequent V-shaped recovery.
Currently, we remain capped under the supply zone between 6,765 and 6,795, which represents the previous swing-high levels. As long as we trade below this resistance, our primary strategy will be to sell into strength and buy on dips within the established range, rather than pursuing breakouts.
On the hourly chart, key equilibrium is noted around the 6,701 to 6,705 range; this serves as the pivotal point around which price action is currently oscillating.
Setups (Level-KZ style)
Reclaim-and-go long (Tier-1 / Tier-2):
Asia/London: hold above 6,701–6,705 after a shallow dip → in NY AM, take the first 5m re-close + 1m HL toward 6,725–6,735.
Scale/target: TP1 6,725–6,735, runners toward 6,765–6,780 if strength persists. Invalidation: 15m body back below 6,701.
Flush-and-reclaim long (Tier-3 bounce):
• Quick sweep into 6,655–6,665 (or even 6,685–6,690) during London → immediate reclaim → first HL entry.
• Targets: back to 6,701 then 6,725–6,735. Invalidation: 15m close back inside/under the swept zone.
Pop-and-fail short (fade):
• Squeeze into 6,725–6,735 that fails to accept (15m rejection back inside) → take the first 5m LH.
• Targets: 6,701 then 6,685–6,690. Invalidation: 15m body acceptance above 6,735.
Stop-run reversal short:
• Spike into 6,765–6,795 (look for wick/absorption) → 15m rejection → 5m LH entry.
• Targets: 6,735 then 6,701. Invalidation: sustained 15m/30m acceptance above 6,795.
Management:
Anchor hard SL to the relevant 15m wick of the trigger ± a small buffer; require TP1 ≥ 2R to the next major level.
At TP1, trim most and put the runner to BE; max 2 attempts per level per session.
Overnight to Tomorrow NY Forecast
Base Case: Anticipate a range build between 6,685 and 6,735 overnight as the market absorbs the recent rebound. During the NY AM session (09:30–11:00 ET), initial attempts may test the 6,725–6,735 resistance before pulling back towards 6,701, potentially moving within the 6,685–6,690 range. Should buyers maintain support at 6,701 on a 15-minute chart, watch for a late-morning rebound back to the 6,725–6,735 zone, with a potential squeeze toward 6,755–6,780 if we see acceptance above 6,735.
The bias shifts to a bullish trend only with clear acceptance above 6,795, which would indicate multiple strong closes in that area, potentially targeting 6,820 and beyond. On the other hand, a decisive move below 6,655 would trigger a downward extension toward 6,604, 6,564, and 6,520.
Execution windows (ET)
• London: 02:00–05:00 — look for the sweep/reclaim plays.
• NY AM (primary): 09:30–11:00 — best momentum/rotation.
• NY PM: 13:30–16:00 — continuation or mean-revert back into the day’s pivot.
What changes the plan
Acceptance above 6,735 early: favor continuation to 6,765–6,780 rather than fading.
Hard failure at 6,701 with sellers defending on 15m: expect a deeper test into 6,685 → 6,655–6,665.
Elevated macro headlines/data at 08:30/10:00 ET windows can temporarily override levels; let the impulse print, then trade the retest.
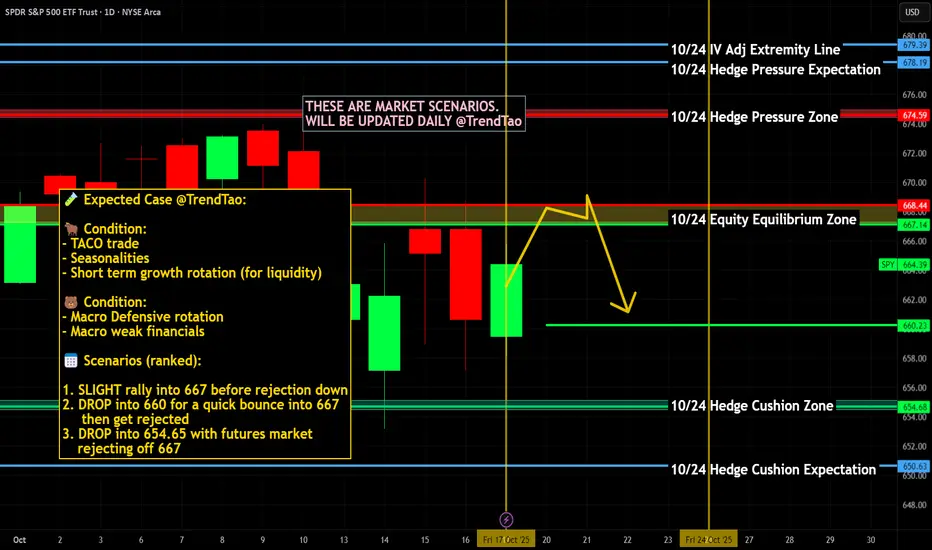
$SPY / $SPX Scenarios — Week of Oct 20 → Oct 24, 2025🔮 AMEX:SPY / SP:SPX Scenarios — Week of Oct 20 → Oct 24, 2025 🔮
🌍 Market-Moving Headlines
🚩 Inflation week: The delayed CPI release on Friday could be the first key data drop since the shutdown began — all eyes on price momentum and Fed expectations.
📉 Jobless Claims live feed: The only consistent macro signal right now — still reporting despite shutdown; any uptick could rattle yields and growth sentiment.
💬 Fed tone matters more: Policymakers continue to speak through the data void; expect market sensitivity to even minor policy hints.
💻 Earnings peak week: Roughly 80+ S&P 500 names report, including several mega-caps — likely to set the tone for AMEX:SPY and $QQQ.
📊 Key Data & Events (ET)
Mon 10/20
⏰ No major scheduled data
Tue 10/21
⏰ No major scheduled data
Wed 10/22
⏰ No major scheduled data
Thu 10/23
⏰ 🚩 8:30 AM — Initial Jobless Claims (Oct 18) — only active weekly macro indicator
⏰ 10:00 AM — Existing Home Sales (Sept) (may be delayed due to shutdown)
Fri 10/24
⏰ 🚩 8:30 AM — Consumer Price Index (CPI & Core CPI, Sept) (delayed release expected)
⚠️ Note:
With most official data frozen, Jobless Claims and CPI carry extra weight. Expect sharp intraday swings on any surprise readings or leaks.
⚠️ Disclaimer: Educational / informational only — not financial advice.
📌 #trading #stockmarket #SPY #SPX #CPI #JoblessClaims #Fed #inflation #bonds #yields #shutdown #earnings #economy #megacaps #datawatch
SANTA RALLY OR BLACK FRIDAY ..... ZOOMThis is a zoom into the 1hour detail up til the predicted November low (dead cat bounce zone)

SANTA RALLY OR BLACK FRIDAY ...... THOUGHTS?This is this weekend's whiteboard projections for the next 6months.
This shows a slight reclaim this week but a continuation of lower highs and lower lows.
Then a drop to the bottom of the narrower channel when China tariffs & rare earth restrictions are reflected in earnings guidance as Mag7 reports Q3 results.
Dead cat bounce into Thanksgiving after the market pullback on guidance.
Then only a Trump tweet can give us a Santa Rally, otherwise the other shoe falls and we get a Black Friday/Monday after Thanksgiving.
Followed by a controlled selloff through Q4/Q1 earnings & poor guidance.
Chart forecasts finding a bottom in April 2026.
Please share your charts/forecasts into April 2026. (I am pretty new to this if you can't tell by my charts)

Stock Market Forecast | TSLA NVDA AAPL AMZN META MSFTStock Market Forecast | CME_MINI:NQ1! CME_MINI:ES1! SP:SPX NASDAQ:NDX
MAG 7 | TSLA NVDA AAPL AMZN META MSFT GOOGL

Mr. Wyckoff Is That You? (Pt II) & Pi Cycle Top Trendline on BTCHey Trading Fam,
As the Donald keeps the market gambling and scrambling, I want to step away from the headlines a bit and take a closer look at what our charts might be suggesting. Admittedly, the bias indicated may be somewhat contrarian at the moment. If you're not into that, this video is probably not for you.
It feels like an echo chamber out there with most analysts. Everyone keeps yelling, "Buy the dip! Buy the dip!" But what about a more cautious approach? Maybe it was time to sell the top and preserve your cash? I don't know. Just throwing it out there.
As many of you are aware, we've reached my third and final target on the SPY. I've been talking about 670-700 on the SPY for a couple of years now. It's been hit, and personally (though I am cautiously still trading publicly), I've exited. My goal is to preserve my cash. Maybe I do this through precious metals? Haven't decided yet. But I am happy with the profit I've made to this point and will probably not test fate too much further.
As for crypto, old Bitcoin usually follows our stock market. And we have tracked the SPY for that part. If the market does, in fact, pull back further, I would expect Bitcoin and all of crypto to follow.
I know, I know. But what about that altcoin season? I don't know guys. That may not actually start until next year. I'm not saying this will be the case for sure. But more and more, it sure is looking that way.
Enjoy the vid,
✌️Stew

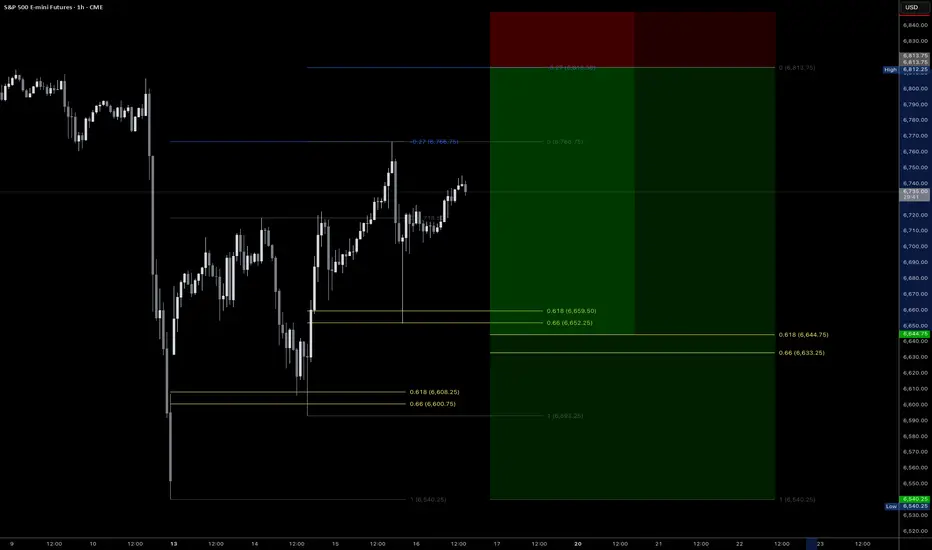
Watch out for 3 drives patternWith the last two retracements to the 0.618 and a perfect touch of the 0.272, we currently have an ideal setup for a potential three drives pattern.
If it hits the final 0.272, it will coincide with CME_MINI:ES1! reaching new all-time highs before reversing for a possible 150-point drop.
Let's see how it evolves.
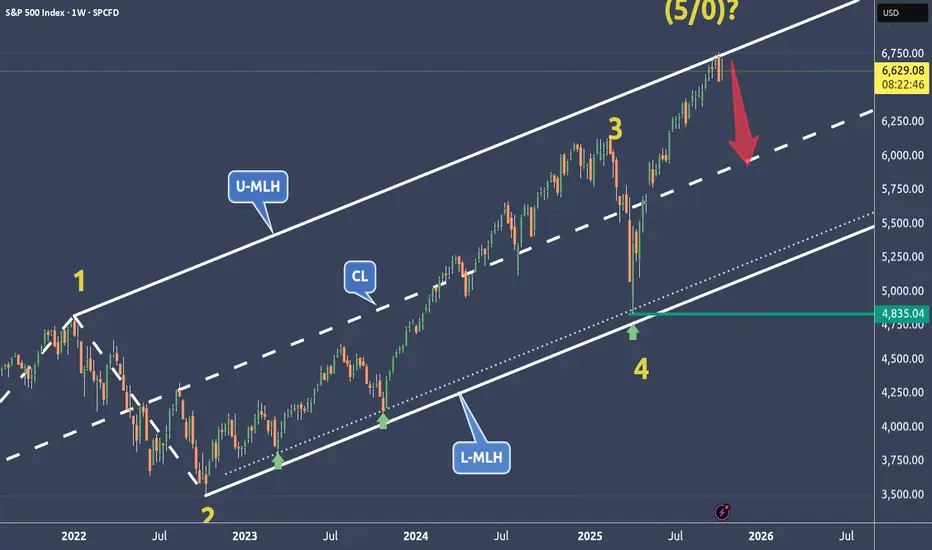
SPX is weakening at a very dangerous price level🔱 SPX is at a very dangerous price level ⚠️
...right at the Upper Median Line Parallel.
💰 If this market turns, the Centerline becomes the next target.
The 0-5 Count is also a good indication when prices start to turn at these extreme levels.
⚠️ Stay sharp — momentum is fading.
I wish you all a relaxing weekend.
ES (SPX, SPY) Analysis, Key Levels, Setups For Fri (Oct 17)MACRO SCHEDULE (ET) — confirmed not impacted by shutdown
• NY AM: No confirmed 8:30 ET U.S. government releases (data blackout continues).
• 16:15 — Fed H.8 (weekly bank data) — after cash close; limited intraday impact.
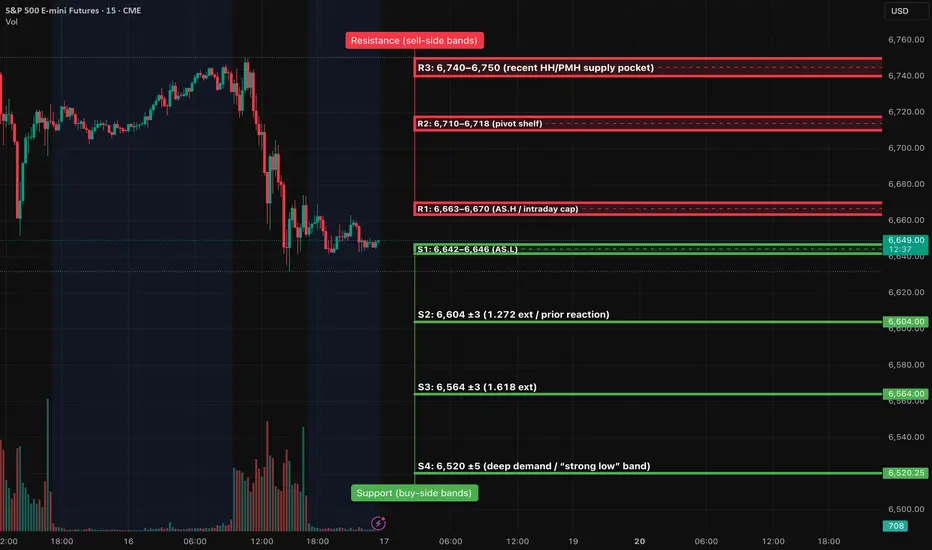
BIAS:
• Short-term momentum is down; price sits in the lower half of this week’s range.
• Expect a liquidity probe lower in London, then a bounce attempt into NY AM if key demand holds.
SETUPS — Level-KZ Protocol (15m→5m→1m)
Tier-1 (A++) — Continuation SHORT from R1/R2
Trigger: 15m rejection back below 6,663–6,670 ➜ 5m re-close below with LH ➜ 1m first pullback fails.
Entry: 6,658–6,662.
SL: Above 15m trigger wick +0.25–0.50.
TP1: 6,604 (≥2.0R gate). TP2: 6,564. TP3: 6,520.
Tier-1 (A++) — Acceptance SHORT below S1
Trigger: 15m full-body close < 6,642 ➜ 5m pullback holds below ➜ 1m LH entry.
Entry: 6,638–6,641.
SL: Above 6,646 +0.25–0.50.
Targets: TP1 6,604; TP2 6,564; TP3 6,520. Management as above.
Tier-2 (A+ Bounce) — Quick-Reclaim LONG at S2
Trigger: Fast sweep below 6,604 with immediate 15m reclaim ➜ 5m hold/re-close above ➜ 1m HL entry.
Entry: 6,605–6,609.
SL: 6,596–6,598 (15m wick low −0.25–0.50).
TP1: 6,663; TP2: 6,690–6,700. Size ¾.
Tier-3 (A Bounce) — Exhaustion LONG at S3
Trigger: Flush into 6,564 ±3 with capitulation wick and 15m momentum pivot ➜ 5m HL ➜ 1m trigger.
SL: Below 6,556–6,558.
TP1: 6,604; TP2: 6,663. Size ½.
INVALIDATION:
• Invalidate long bias if 15m accepts below 6,564 (two 15m bodies or one decisive close ≥1.5pt).
• Invalidate short bias if 15m accepts above 6,718 and holds.
• Max 2 attempts per level per session; stop trading at −2R net or after +3R net.
NEWS / HEADLINE NOTES
With government data paused, price will be more technically driven. Fed headlines can spark brief moves; prioritize level reactions over narrative.
Earnings/gamma flows may add noise near R1 (6,663–6,670) and R2 (6,710–6,718).
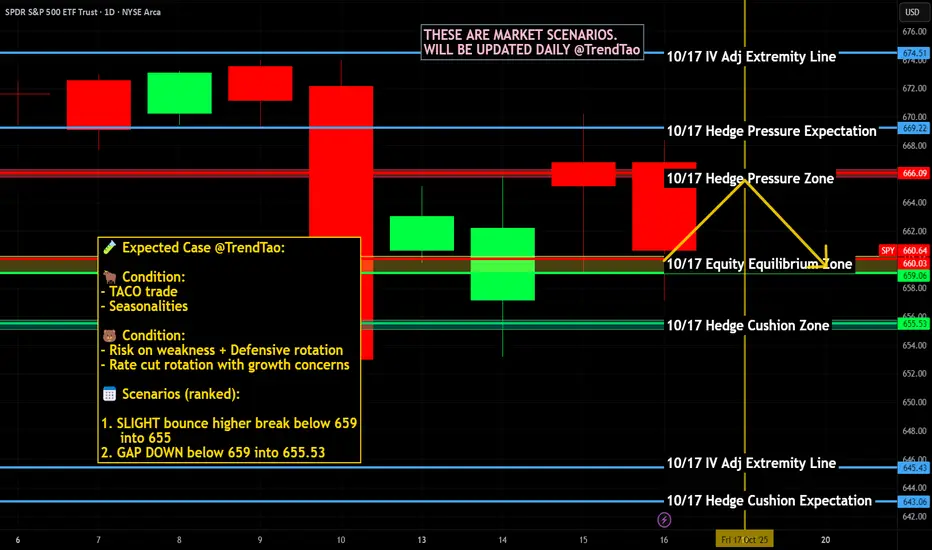
$SPY / $SPX Scenarios — Friday, Oct 17, 2025🔮 AMEX:SPY / SP:SPX Scenarios — Friday, Oct 17, 2025 🔮
🌍 Market-Moving Headlines
🚩 Data blackout risk: Friday was set for key housing and production reports — but the ongoing shutdown means most prints (Housing Starts, Industrial Production, Import Prices) may not be released.
📉 Macro vacuum: With no confirmed data, traders lean on positioning and bond moves to gauge growth sentiment into the weekend.
💬 Earnings carry the weight: Corporate results take the spotlight as macro inputs dry up.
💻 Technical tone: AMEX:SPY and NASDAQ:QQQ watchlist rotation continues — watch volatility pockets if liquidity fades mid-session.
📊 Key Data & Events (ET)
⏰ 8:30 AM — Housing Starts & Building Permits (Sept) — scheduled but may not print
⏰ 8:30 AM — Import Price Index (Sept) — scheduled release
⏰ 9:15 AM — Industrial Production & Capacity Utilization (Sept) — scheduled but may not print
⚠️ Note: Friday wraps a quiet macro week dominated by missing data and Fed commentary. Expect a headline-driven close with limited participation ahead of weekend risk.
⚠️ Disclaimer: Educational / informational only — not financial advice.
📌 #trading #stockmarket #SPY #SPX #housing #IndustrialProduction #ImportPrices #Fed #bonds #economy #shutdown #yields #equities
Regional Banking Crisis 2.0? KRE fell over 6% today due to mounting concerns about sour loans and weakening credit quality across regional banks.
Many regional bank earnings reactions are not supporting positive price action.
Loan Quality Fears: Wall Street is increasingly worried about deteriorating credit conditions in regional banks’ loan portfolios. Reports suggest rising delinquencies and potential defaults, especially in commercial real estate and small business lending.
Jefferies & Zions Drag: Shares of Jefferies and Zions Bancorporation were among the hardest hit, amplifying pressure on the ETF. Zions, in particular, saw double-digit losses amid speculation about its exposure to risky assets.
Tariff-Driven Recession Fears: Broader macro concerns, including recession risks tied to recent tariff policies, are weighing on bank stocks. Tariffs are seen as “unconditionally bad” for financials due to their impact on growth and lending demand.
