WEEKLY MARKET OUTLOOK – STRUCTURE HOLDING, BRKOUT PENDING NIFTy
Nifty closed at 25,471, down 222 points from last week. High 26,009, Low 25,444.
As discussed earlier, I was not convinced by the V-shaped recovery. The market has continued respecting the 26,000–25,200 structure, keeping the broader corrective W-pattern possibility alive.
NIFTY – LEVEL MAP
Short-term range:
👉 26,000 – 25,000
Sustained move above 26,000 changes tone.
Acceptance below 25,000 increases pressure.
The 24,900–25,000 zone can act as an accumulation area for staggered allocation into NiftyBees / MidcapBees, but only if price shows stability — not on panic breakdown.
Next deeper accumulation zone:
👉 24,000 / 23,750
Deployment should remain phased.
IT INDEX – IMPORTANT TEST AHEAD
IT stocks saw sharp pressure on global AI concerns.
Technically, the IT Index may test its Monthly EMA100 (~28,186) — last meaningfully tested in 2020.
If approached, watch for stabilization before deploying capital.
Narratives can overshoot — structure must confirm.
BANK NIFTY – FIB LEVELS WORKING
Weekly close: 60,120
Last week’s key level 60,900 (Fib) acted as resistance again.
Below 60,092:
→ 59,700 / 59,500 / 59,000
Above 60,900:
→ 61,300 / 61,450
Expected range: 61,450 – 58,900
Sustainable Nifty strength requires banking participation.
S&P 500 – INFLECTION ZONE
Closed at 6,836, again failing to sustain above 6,954 (Fib level).
Above 6,954:
→ 7,026 / 7,122 / 7,455
Weekly close below 6,756:
→ 6,568 / 6,000
Volatility compression continues. Expansion likely once range resolves.
FINAL VIEW
Market remains in corrective consolidation.
Avoid chasing rebounds.
Respect 26,000 (Nifty) and 60,900 (Bank Nifty).
Deployment should be staggered, not emotional.
Structure first. Emotion later.
Important Update
After sharing my weekly market views free of cost for nearly two years, I plan to launch a more structured and detailed Premium Weekly Edition soon – with deeper analysis and enhanced insights.
Free updates will continue as usual. More details in the coming weeks.
Spy500

WEEKLY MARKET OUTLOOK – STRUCTURE OVER EXCITEMENTNIFTY 50
Nifty closed the week at 25,693, a strong 868-point recovery from the previous week. The index made a high of 26,241 and a low of 24,679. This sharp upmove was largely driven by positive sentiment around the Indo–US tariff deal announcement, which triggered a classic relief rally.
However, regular readers know my style –
👉 I’m never a fan of V-shaped recoveries.
This week’s bounce looks impressive on the surface, but structurally it still doesn’t inspire full confidence. Sustainable trends are built on proper bases, not straight-line rebounds.
MY PREFERRED APPROACH
Rather than chasing this rally, I would be more comfortable initiating fresh longs if:
Nifty comes down to test 25,000 or 24,600,
Holds those levels firmly,
And starts forming a bullish W-pattern
That kind of setup offers far better risk–reward than buying after a sharp vertical move.
LEVELS TO WATCH NEXT WEEK
I expect Nifty to remain in a range of 26,000 – 25,200.
Above 26,000:
Upside momentum can continue, but 26,200 will be a tough resistance to cross.
Below 25,200:
The bounce loses steam and lower levels may be revisited.
For now, patience remains more important than aggression.
BANK NIFTY – THE OG VOLATILITY KING
Bank Nifty lived up to its reputation once again with wild swings.
From a weekly low of 57,829,
It surged to a high of 61,764,
And finally closed at 60,120, just above the key psychological level of 60,000.
What Next?
If Bank Nifty manages two consecutive daily closes above 60,200, the index can push higher towards:
60,600 → 60,900 (important Fib level) → 61,300
In case of retracement, 58,900 becomes the most critical level to monitor.
Until 60,200 is clearly conquered, moves should be approached cautiously.
S&P 500 – RESILIENT STRUCTURE
The S&P 500 closed at 6,932, almost unchanged from last week despite testing lows near 6,780. This clearly indicates that demand remains strong at lower levels.
Consecutive daily close above 6,970
can open doors towards:
7,026 (important level) → 7,122 (important Fib level)
For investors in the US market, a trailing stop-loss near 6,500 is a sensible level to protect profits.
FINAL THOUGHT
This remains a market where structure matters more than headlines.
Instead of getting carried away by fast moves, focus on levels, confirmations, and disciplined entries.
📢 IMPORTANT UPDATE
After sharing my weekly market views free of cost for nearly two years, I plan to launch a more structured and detailed Premium Weekly Edition soon – with deeper analysis, clearer market framework, and enhanced insights.
Free updates will continue as usual.
More details to follow in the coming weeks.

Distribution of Wyckoff Started in $SPYFrom a Wyckoff theory perspective, I expect a decline in the stock after a period of accumulation. The chart shows the most important signs of weakness in the uptrend. The break of the creek line is a confirmation of a bearish move, at least down to the 652 bottom AMEX:SPY

2026 Price Target for SPY: $790 – Why the S&P 500 Could Soar 15%If you haven`t bought the dip on SPY last year:
Why my Price Target is $790 for SPY? Key Drivers for 2026!
Earnings Growth Acceleration:
Analysts expect S&P 500 EPS to grow 12–15% in 2026 (Goldman Sachs: 12%; FactSet consensus: ~14.9%). This builds on the AI-driven productivity boom and resilient consumer spending. If AI adoption accelerates (as seen in Meta, Nvidia, and Microsoft earnings), we could see 15–18% EPS growth—pushing multiples higher in a low-rate environment.
Fed Policy Tailwinds:
With inflation cooling (core PCE at ~2.8% in November, in line with expectations) and the economy strong (Q3 2025 GDP revised to +4.4%), the Fed is likely to deliver 1–2 more rate cuts in 2026. Lower rates support valuations and boost corporate borrowing/profits—classic bull-market fuel.
Geopolitical & Policy Clarity:
Trump's recent backtrack on aggressive tariffs (U-turn on 10–25% threats to NATO allies and Greenland deal) has eased fears. Combined with potential fiscal stimulus and deregulation, this creates a pro-growth backdrop. Midterm elections could add volatility, but history shows markets often "pump" post-election.
Valuation Expansion Potential:
The forward P/E is ~22x—elevated but justified by AI productivity gains. If earnings beat expectations and rates fall, multiples could stretch to 24–25x (similar to past tech-led cycles), supporting my higher target.
Comparison to Wall Street ConsensusWall Street targets for the S&P 500 end-2026 range widely:
Conservative: Bank of America ~7,100 (3–4% upside)
Average: ~7,269–7,600 (6–11% upside)
Bullish: Oppenheimer 8,100; Deutsche Bank 8,000; Goldman Sachs ~12% total return
My $790 SPY target sits on the bullish side (~15% upside), assuming stronger-than-expected earnings and policy support. It's not moonshot territory (some outliers see 8,000+), but it requires the rally to broaden beyond Big Tech.
Risks to Watch:
Tariff resurgence or trade wars could cap gains.
Inflation reacceleration might delay Fed cuts.
AI spending disappointment → valuation compression.
Volatility spikes around elections or macro data.
Still, the base case remains bullish: resilient economy, AI tailwinds, and supportive policy. SPY at $790 would mark another strong year in this bull run.

Weekly Market Outlook,Nifty, BankNifty,S&P 500Nifty closed the week at 25,694, almost flat vs last week, after making a high of 25,899 and a low of 25,473.
As discussed earlier, once again Nifty respected the broader range of 26,150–25,250, keeping the market in a balance phase.
This week’s candle reflects indecision — such structures often act as compression, and once price accepts beyond the range, moves can turn fast.
🔼 Nifty Upside
If Nifty manages to sustain above 25,811 on a 1-hour close, upside levels to watch:
25,900
26,000
26,150
Acceptance above this zone will be key.
🔽 Nifty Downside
If Nifty sustains below 25,600, downside levels open towards:
25,500
25,400
25,200
📌 Structure Summary
25,600–25,811 → balance zone
Above 25,811 → bullish acceptance
Below 25,600 → downside expansion
For now, broader range remains
👉 26,150 – 25,200, unless any major global trigger changes sentiment.
🏦 BankNifty View
BankNifty closed near an important fib zone around 60,092.
If it gives a consecutive close above 60,150, upside levels:
60,360
60,437 (ATH)
60,500
60,700
60,950
Broader range remains
👉 61,200 – 59,000.
🌎 S&P 500
Weekly candle remains indecisive.
Above 6,986 → 7,026 / 7,122
Below 6,885 → 6,780 / 6,700 / 6,469
⚠️ Final Note
Market remains volatile and range-bound.
In such phases, patience matters more than prediction.
Respect levels — let price decide direction.

NIFTY,BANKNIFTY,S&P 500 – Correction Unfolds, Volatility ReturnNifty closed the week at 25,683, sharply down ~650 points from the previous week. The index formed a high of 26,373 and a low of 25,623, confirming that trending moves have returned after the holiday season—exactly as anticipated.
The previously defined 26,700–25,900 range has been decisively breached, with price taking temporary support near the 25,600 zone.
Technically, Nifty has printed a strong bearish outside bar, engulfing the entire price action of the last 7 weeks—a clear sign of distribution and momentum shift.
25,600 – Acceptance vs Rejection Zone
This level will decide the next swing:
Acceptance above 25,600 (higher lows / stable closes) → scope for a technical pullback
Repeated rejection below 25,600 → continuation of the corrective move
Pullback Scenario (Corrective Bounce)
If Nifty manages to hold above 25,600, a bounce towards:
26,000
26,150
These zones should be treated as supply / short-on-rise areas, not fresh breakout levels.
Downside Risk (Continuation)
If 25,600 fails on a closing basis, next supports lie at:
25,400
25,250
Expected Trading Range (Next Week):
26,150 – 25,250
Bigger Picture – Why Caution Is Warranted
As highlighted in my 27th December post, Nifty was trading at extremely overbought levels on the yearly chart, signaling an impending correction.
What adds to the concern is that the December low has already been broken this month. As long as this remains the case, any bounce should be treated as corrective, not a trend reversal.
This phase resembles a healthy corrective reset after momentum excess, not a structural bear market—yet volatility will stay elevated.
Investor Strategy – Build the Shopping List
Corrections create opportunities.
This is the right time to track fundamentally strong stocks and names where smart money (FII & DII) is steadily increasing exposure.
During recent scans, I’ve identified multiple stocks trading near:
Monthly EMA 200
Weekly WEMA 200
These zones often act as high-probability accumulation areas.
I’ve started building my shopping list—have you?
BANK NIFTY – RELATIVE WEAKNESS EMERGES
Bank Nifty, the most volatile index of the Indian market, failed to sustain above the crucial 60,092 Fibonacci level and closed at 59,251, down nearly 900 points for the week.
This relative underperformance is a warning sign—sustainable Nifty recoveries need bank participation.
Downside Levels:
Daily close below 59,000 →
DEMA 100 at 57,865
DEMA 200 at 56,250
Upside Cap:
Near-term upside remains capped at 60,200–60,300
S&P 500 – ATH CONTINUES, TRAIL PROFITS STRICTLY
The S&P 500 closed at a fresh all-time high of 6,966, with momentum pointing towards the key Fibonacci level of 7,026.
Risk Management for US Market Participants:
Trailing stop-loss:
Consecutive daily close below 6,826, OR
A confirmed close + follow-through below DEMA 100 (6,687)
This helps avoid single-day whipsaws near moving averages.
Bonus Tip for Nifty Traders
Trail existing short positions
26,000 remains a strong supply zone and can be used to initiate fresh shorts on pullbacks

Commodities vs SP500Comparing commodities index vs SP500, it's at its lowest level since 1980.
It's time for a strong rebound ?

NIFTY,BANK NIFTY, S&P 500 – ATH Close, Key Fibonacci Tests Nifty closed at a fresh all-time high of 26,328, up 286 points from last week. The index made a high of 26,340 and a low of 25,878. Despite the strong close, Nifty continues to trade within my broader 26,400–25,700 range, indicating strength with selective supply overhead.
An ATH close confirms positive momentum, but price is still hovering just below the important Fibonacci resistance at 26,492, making this level a decisive acceptance zone.
On the daily timeframe, structure remains bullish, suggesting this is a trend-resumption phase rather than a euphoric blow-off top.
Upside Scenario (Bullish Acceptance)
If Nifty sustains above 26,492 (Fib level) with consecutive closes:
Upside opens towards 26,700
Expected Trading Range (Next Week):
26,700 – 25,900
False Breakout Risk:
A brief move above 26,492 without follow-through for 2 sessions can turn into a bull trap, potentially pulling price back towards 25,900 / VWAP / short-term averages.
Downside Scenario (Momentum Breakdown)
A consecutive daily close below 25,900, especially with RSI slipping below 50 or weakening market breadth, can drag Nifty towards:
25,570
25,400
With the holiday season now over, traders should be prepared for stronger trending moves and faster momentum expansion.
BANK NIFTY – LEADERSHIP INTACT, VOLATILITY AHEAD
Bank Nifty delivered a record weekly close above the key Fibonacci level of 60,092, reinforcing bullish leadership.
Upside Continuation:
If Bank Nifty sustains above 60,100:
Targets: 60,500 → 60,700 → 60,975 (important Fib level)
Expected Range:
61,000 – 59,300
The 60,500–60,700 zone may act as a momentum pause / time correction area before any further extension.
A breakout or breakdown beyond 61,000 or 59,300 can trigger sharp, high-volatility moves—position sizing and trailing stops are crucial.
S&P 500 – TECHNICALS ABOVE HEADLINES
The S&P 500 closed at 6,858, down 71 points week-on-week. While geopolitical headlines may increase volatility, price structure remains the primary guide.
The index remains bullish as long as it holds above DEMA 100, currently near 6,661.
Trading Plan:
Every dip towards DEMA 100 remains a buying opportunity
Above 6,945: Upside targets at
7,026 (important Fibonacci level)
7,122 (major Fibonacci extension)
Risk Management:
Consecutive daily close below DEMA 100 + follow-through can pull the index towards DEMA 200 near 6,416
For positional investors, DEMA 100 should act as a trailing stop-loss
Alternatively, a daily close below 6,800 is a clear cue to protect profits
Market Regime Summary
Current market structure suggests trend continuation with controlled risk, not a runaway top.
Strategy: Buy strength, avoid chasing failed breakouts, and trail profits aggressively.

Happy New Year S&P 500: Why I am BULLISH on Stocks for 2026.Hello There,
in the recent year, the S&P 500 has formed historical volatilities to the upside and downside while still sustaining the underlying trend. Several important factors drove the major price moves seen in the past year. Considering these fundamentals, I have detected important fundamental and technical signs that should be considered when preparing potential market participation for 2026.
In 2025, the major price moves that were recorded in the price actions resulted from crucial fiscal decisions. The main decline right at the beginning of the year due to tariff increases resulted in a drop of over -20% for the index. While this seemed to be a doomsday scenario for the whole market and a potential setup of a year-long bear market, the markets could quickly recover again and form several new highs.
The major price move that resulted from the market recovery gave the implication that the bull market won't be over so far, as prices reached far beyond the previous all-time high already. What is important here is that this price move was also supported by increased bullish volume, making it a fundamentally strong price action that is also likely to continue within 2026.
FUNDAMENTAL PERSPECTIVE
There are also several fundamental signs that are main implications for my consideration of a huge bull market continuation in 2026. These factors determine the underlying bullishness of the market from an economic perspective, supporting also the technical factors seen in my chart. There I am pointing out the most determining fundamental factors to consider here.
___________________________________________
Sustained GDP Growth and All-Time-High Demand
___________________________________________
Considering the important macroeconomic dynamics of the underlying fundamentals. The year 2025 has shown great increases within the U.S. GDP, continuing with the main uptrend of GDP growth. This has been supported by subsequent interest rate decreases. It is important to note here that the U.S. volume share of the S&P 500 accounts for almost 72% of the total volume of the index, making the U.S. volume entering from the economy the most important factor of price growth.
Also, the expectations of interest rate drops as well as inflation declines create a main bullish environment, which is offering an underlying bullishness from a fundamental perspective. With decreasing inflationary pressures, the interest rates are also likely to decrease, creating a dynamic that is supporting further investments into the index. Considering the forecasts, this will create a bullish dynamic, especially in Q2 and Q3, when the forecasted expectations turn out in reality.
____________________________
Nominal Interest Rate Decreases
____________________________
The decreasing nominal interest rates are a strong sign of the market turning more and more bullish. In the past year, the FED lowered the interest rates subsequently to lower levels. Creating a strong demand for money and investments in the market. These drivers were also particularly important for the price action holding to the upside and not declining more after the major drop at the beginning of the year.
It is highly likely that interest rates will decline further in 2026, creating further bullish underlying fundamental factors, increasing money demand and investment. This adds to the overall bullish expectations and considerations of forecasts for 2026. It will also be an interesting indication to follow for Q1 and Q2 and see how the FED considers further rate declines.
___________________________________________
An Bullish Sentiment Determined by the VIX Index
___________________________________________
This is an indicator especially important for the S&P 500 Index. It measures the market expectations of volatility derived from options prices. A low VIX index signals a bullish sentiment with a high risk tolerance, and firms are likely to invest more. A high VIX index signals a bearish sentiment with a high risk aversion, and the firms are not likely to invest more than necessary.
Throughout the year of 2025, the index was, the vast majority of the time, below the 15 threshold. With an average VIX of 15, this is a very bullish base that has built up in the year 2025. Especially in Q3 and Q4 of 2025, the index kept several times below the 15 threshold. This dynamic signals firms and investors willingness to invest more in the market and get ready for further bullish moves in 2026.
TECHNICAL PERSPECTIVE
Major Historical Ascending Trend Channel
As seen in my chart, the S&P 500 index is still trading within this huge and sustained uptrend channel. Within this channel, the index already bounced several times in this massively important and crucial lower bullish accumulation zone, especially followed by many famous investors pointing out supporting facts about the bullish dynamics. This channel is not yet broken, and the index already had the ability to visit the middle line of the channel, making it highly likely that the index will also bounce till the upper boundary of the channel again.
Bollinger Bands Tightening and Breakout Expectations
The Bollinger Bands indication is very interesting to consider. Because this constellation is now actually tightening above the middle line of the historical accelerating channel. Also, the index is bouncing above the middle line of the Bollinger Bands. As the bands tighten, they get ready for a major breakout and expansion of the bands towards the upside. What is also important here is that they follow the overall uptrend and EMA structure. An upthrust within this Bollinger Band dynamic is very likely to occur.
Substantial and Sustained Fibonacci Extensions
The index is still trading within a major Fibonacci extension. With the major waves 1 and 2 already completed. Now the index moves forward with expanding the wave 3 towards the upside. Within this dynamic, it is very interesting to see that the first 1.618 Fibonacci extension level of the first wave has already been reached. After this level is reached, the next target is the next higher Fibonacci level of 2.618. As the uptrend is still going on and the Fibonacci extension is holding, this is the next reasonable target. The target also matches with the huge ascending uptrend.
Strong Volume Supporting Bounces in the Channel
The bounces from the lower boundary of the uptrend channel were severely supported by major volume spikes. This is very important in an uptrend; the volume spikes have to correspondingly support the uptrend dynamics. The spikes were always conducted when a major bottom and the following uptrend bounce had been formed. As the substantial volume is holding on, it will be an important driver for further bullish price action throughout the year. Therefore, especially if volume should increase in the next term, it will offer additional support.
EMA-Support and Overall Trend Dynamics
The whole uptrend is still holding above the whole main EMA structure. Also greatly to consider here is that the EMA bounce occurred in March 2023, as also the market was able to recover from the inherent dynamic. The trend is still holding above the EMAs, and if a pullback should occur, the EMAs will be strong supports, likely holding the trend to the upside. Therefore, there are two possible scenarios that are most likely. The first is the uptrend just goes on, and the second is a pullback into support zones happens from where a stabilizing bullish price action can establish the further bullish uptrend.
CONCLUSION AND PROJECTIONS
Taking all of these important considerations into account, Q1 will be very decisive. Especially in price action, Q1 will set up how the rest of the year will move forward in price action. Therefore, there are two main scenarios that should be highly necessarily considered. The first is the uptrend dynamic as it currently established just goes on till the upper target zones are reached. The second is the price action firstly pulling back into the support zones determined by EMA, the Bollinger Bands, the bullish accumulation channel, and the volume profile. Then it will also be important how the macroeconomic indications pointed out will behave. If the expected forecasts show up as mentioned, it will highly likely be a major boost for the bullish price action. In any case, it will be highly determining and interesting to see the S&P 500 index evolve.
With this being said, it is great to see an increased support.
We will watch out for the important market evolutions.
Thank you very much for watching!

SPY - Gann Square of Nine Chart DailySome price and time projections using june to dec solstice time period via gann square of nine method and included some year long favorite angle levels.
925 and 724 price levels correlates to 1.618 fib extensions.
Support at 684.51; 651; 622; 607; 604; 594; 593; 548; 485.
Resistance at 688.29; 733; 782/789; 852; 896; 925.

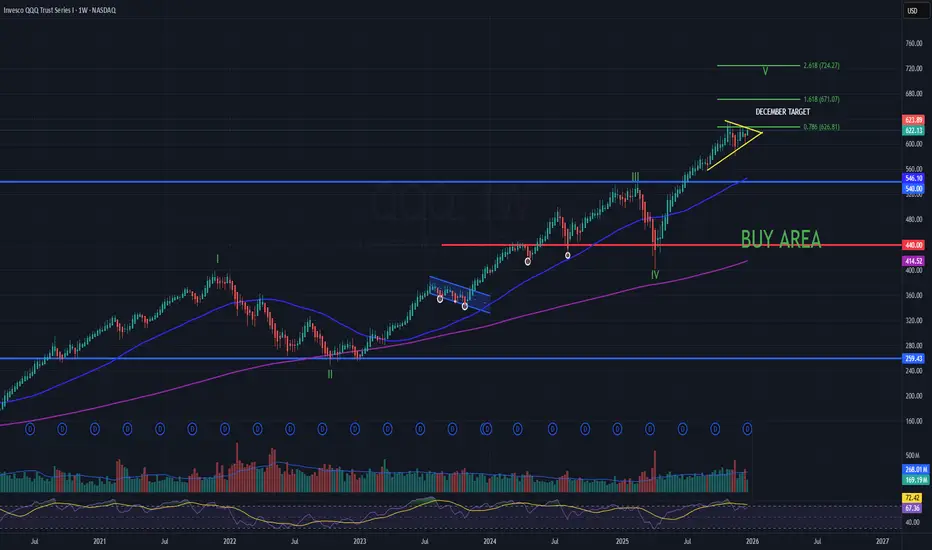
QQQ – Weekly Structure OverviewThesis
Weekly uptrend intact. Price is extended; next decision is breakout vs. consolidation near highs. We are next to the end of the long term bull trend.
Context
200WMA is rising and aligns with major support near 440 (long-term mean reversion / reset zone).
What I see
- Prior stress phases reverted toward the 200WMA (2022 and early 2025).
- Current structure is a rising consolidation near highs (compression).
What matters now
- Continuation remains favored while price holds above key trend support ($600 on chart).
- A clean weekly expansion above the consolidation keeps upside structure intact.
Buy / Accumulation zone
- Long-term accumulation zone: $440 area (200WMA + horizontal support confluence).
Targets
- Extension reference: 2.618 Fib $720s (measured upside within current structure).
Weekly Market Outlook – Nifty, BankNifty & S&P500 AnalysisNifty 50 wrapped up the week at 26042, gaining +76 points from last week’s close after hitting a high of 26236 and low of 26008. As highlighted earlier, the index continues to trade within my broader zone of 26500–25400, showing no decisive breakout yet. This week’s Gravestone Doji candle formation signals buyer exhaustion and potential weakness, with price closing near the weekly lows — never a great sign for bullish momentum.
With FII participation still muted due to holiday season and India VIX resting at a calm 9.15, volatility may stay compressed, suggesting range-bound or slow movement in the coming week unless major triggers appear.
Nifty Weekly Range Expectation: 26400–25700
A breakout beyond this range may bring sharp moves (“fireworks”) in either direction.
For upside continuation, Nifty must close above 26200 for two consecutive sessions, which could open targets toward 26277 / 26325 / 26400.
BankNifty Outlook
BankNifty ended at 59011, down just -50 points, but importantly closed near the weekly low, hinting at possible sell pressure ahead. If weakness persists, we may see tests of key supports:
Support Levels: 58700 / 58300 / 57600
Break of these zones can drag Nifty along with it.
For bulls to reclaim control, we need a sustained close above 59300, which may drive a move toward 59755 / 60000.
Expected Range: 59900–58200
Global Cue – S&P 500 Breaks Out to New All-Time Highs
S&P500 delivered a powerful move this week, breaking above the 6882 resistance and closing at an all-time high of 6930. The chart structure suggests a march toward the next Fibonacci level at 7026. However — monthly timeframe RSI is nearing the overbought zone, which historically calls for caution, trailing stop-losses, or partial profit booking for US equity investors.
Historical Reminder for Long-Term Investors
Nifty’s yearly RSI previously hit 91 only once before — Jan 2008.
Within months, the market corrected over 60% from the highs.
Today again, RSI on yearly frame is heating up. Coincidence or caution?
History doesn’t repeat, but it often rhymes.
Key levels to watch in 2026 based on price behaviour around yearly candle:
🔻 Break below December low → a deeper correction could unfold
🔼 Break above December high → Nifty may climb toward 27824/29156 before any major decline
Markets reward those who prepare – not predict.
Final Take
Nifty & BankNifty locked in range → wait for break + confirmation
Volatility low = breakout moves may be strong when they come
S&P500 bullish but nearing overbought territory
Keep risk management tight, trail profits & prepare for both outcomes
Is history about to repeat?
We’ll know soon — until then, stay alert, stay hedged, and stay disciplined.

SPY - Potential Head & Shoulders And now we have this exhaustion pattern again. I went back and foruth on this yesterday. But in the final minutes a bought shorts again. The right shoulder can consolidate for a few days and the H&S can still be invalidated but I have this on my bucket list. I can´t sit on the sidelines on this one. If it happens, it will be legendary. With first strong support at 605

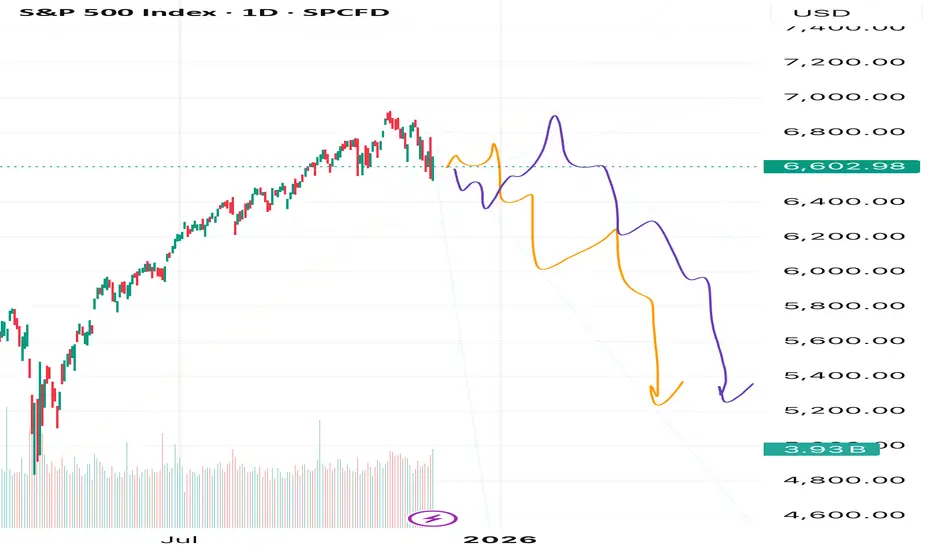
A Historic Shift in the S&P 500 Is BeginningFriends, in my view, the unstoppable rally in the S&P 500 has finally come to an end. The market has completed a massive five-wave structure with an extended fifth wave — and now we’re witnessing a historic moment as an exceptionally large correction begins.
As always, I’m watching two possible scenarios: the orange path and the purple path. But despite their differences, both point to the same outcome — my target at 5200. And that’s only the first target out of several.
Make sure to follow and subscribe, so you don’t miss the upcoming updates and deeper breakdowns.
This is just my personal market outlook — not financial advice. More updates coming soon.
Nifty, BankNifty & S&P500 Weekly Outlook Nifty closed the week at 25910, posting a strong 418-point gain. Once the index sustained above 25600, it delivered a clean 400-point rally toward 26000, pulled back briefly, and regained strength to close near the highs.
Overall Bias: Mildly Bullish
As long as Nifty holds above 25600, the structure remains constructive.
However, expect volatility near 26000–26400.
📌 Key Levels for Next Week
Support: 25600 / 25400
Resistance: 26050 / 26400
Nifty is likely to stay within 25400–26400 . A breakout on either side can trigger sharp directional moves.
Bullish sector themes: PSU Banks, Private Banks, Metals, Auto — ideal zones for swing traders.
BankNifty Update
BankNifty reclaimed 57900, extended a smooth upside move, hit all three bullish targets, and closed at a fresh all-time high of 58517.
If it sustains above 58615, upside zones open toward:
59267
60087 (Key Fibonacci level)
Continued strength here can act as a strong tailwind for Nifty’s next leg up.
S&P 500 Weekly View
S&P 500 closed flat at 6734, but the weekly structure still favors a bullish W-pattern.
Key Breakout Levels
Above 6869: Targets 6959 → 7000 → 7122
Below 6631: Trend weakens, downside opens toward 6350 / 6225
The index is at a decision point — a breakout or breakdown will set the tone globally.
Final Take
Markets are at crucial levels, and next week will decide who takes control — Bulls or Bears.
Which level do you think breaks first — 26400 or 25400?

Intraday Range Expansion and Potential Repricing on the SPXFollowing a clean sweep of Friday’s high, price delivered a strong displacement to the downside, breaking short-term structure and rebalancing inefficiencies left behind. The subsequent rebound towards the daily open suggests a retracement into a premium area, potentially setting up for continuation lower if rejection holds around that zone.
If buyers fail to sustain price above the daily open, the market could aim for a full range fill back toward the previous low or discount zones below, maintaining the current bearish intraday order flow.
Potential Range Rebalance After Bullish Exhaustion on SP500Based on Candle Range Theory , the recent large bullish range has been followed by a series of smaller bearish candles, showing reduced momentum and potential exhaustion from buyers. Price is currently retracing into the lower range of the previous expansion, indicating that liquidity may be resting below.
If price fails to reclaim the upper range of the previous bullish candle, we could see continuation to the downside as the market seeks equilibrium within or below that expansion range. However, a strong rejection from the lower boundary could confirm range preservation and set up another bullish leg.
In short : the market’s next move depends on whether this retracement turns into a liquidity grab or a deeper correction beneath the prior candle range.

Weekly Market Outlook | Nifty, BankNifty & S&P 500 AnalysisNifty closed the week at 25,795, up 86 points from last week’s close — marking another week of resilience within my projected range of 26,200–25,250.
This week’s candle looks weak and indecisive, forming near the all-time high zone — a potential signal of short-term fatigue. A break below 25,718 could trigger selling pressure toward support zones at 25,450 / 25,350 / 25,300.
However, as long as 25,300 holds, the broader structure remains healthy.
On the flip side, if Nifty sustains above 25,900, bulls may once again attempt to test the all-time high resistance at 26,277.
👉 Expected range for next week: 26,250 – 25,350.
BankNifty Update:
BankNifty delivered a record-breaking all-time high close at 57,699!
If it slips below 57,482, it could correct toward 57,000 / 56,750, which may also drag Nifty slightly lower.
But a sustained move above 57,900 could fuel another rally toward 58,577 (ATH), providing crucial support for Nifty’s next breakout attempt.
S&P 500 (US Markets):
The S&P 500 once again posted a new all-time high weekly close at 6,791, perfectly following last week’s outlook where it cleared 6,715 and achieved both upside targets 6,760 / 6,780.
Next key levels to watch:
Above 6,780 → potential move to 6,930 / 6,959 (important Fibonacci zone)
Below 6,750 → watch for pullback toward 6,689 / 6,666 / 6,650
Investors in US equities can now trail their stop-loss near 6,580 and keep adjusting to protect profits as the trend extends.
🎯 Summary:
Nifty range: 26,250–25,350
BankNifty: All-time high close, watch 57,900 breakout
S&P 500: Bullish momentum intact, eyes on 6,930–6,959
Markets are at crucial inflection levels — next week could decide whether we see fresh breakouts or short-term consolidation.

S&P500 - $8.000 is the ultimate target!🎊S&P500 ( TVC:SPX ) continues the bullrun:
🔎Analysis summary:
Over the course of the past couple of months, the S&P500 has been rallying +40%. However, this does not mean that the bullrun is over any time soon. Since the S&P500 perfectly respects the rising channel pattern, a move to the upper trendline is the target.
📝Levels to watch:
$8,000
SwingTraderPhil
SwingTrading.Simplified. | Investing.Simplified. | #LONGTERMVISION

Weekly Market Wrap: Nifty Eyes All-Time HighsNifty closed the week at 25,709, gaining 400 points from the previous week’s close — marking another strong performance! It made a high of 25,781 and a low of 25,060.
As I highlighted last week, Nifty was expected to trade within the 25,700–24,850 range — and while it briefly broke out by 80 points, it closed right back within the range, showing controlled optimism.
Technical Outlook:
The monthly charts of both Nifty and Bank Nifty are now showing signs of forming a bullish W-pattern, which typically indicates trend reversal and strength. If Nifty manages to sustain above 25,900, we could see it rally towards its all-time high of 26,277, followed by the important Fibonacci level of 26,492.
On the downside, a pullback towards 25,450–25,500 could offer a great buy-on-dips opportunity for fresh long positions.
Next Week’s Range Expectation:
With a holiday-shortened week ahead (holiday on Wednesday and only a 1-hour trading session on Tuesday), expect Nifty to remain range-bound between 26,200–25,250. A breakout beyond these levels could spark some serious fireworks!
Big Picture View:
I continue to remain optimistic about India’s growth story. Over the coming years, I expect:
Nifty to reach 44,000+
Sensex to touch 1,44,000+
Of course, there will be healthy pullbacks and corrections along the way — offering smart investors a chance to accumulate at better valuations.
💡 Investment Ideas:
To participate in India’s long-term growth journey, consider systematic investments in:
NiftyBees, MidcapBees, SmallCapBees & GoldBees
Also, keep an eye on the Banking, Auto, and Infrastructure sectors — all showing strong bullish setups for the next few weeks.
Global Markets – S&P 500 Update:
The S&P 500 closed at 6,664, up nearly 110 points for the week, forming an inside candle on the weekly chart.
A move above 6,715 can push it towards 6,760 / 6,780 / 6,930 / 6,959 (key resistance levels).
On the downside, 6,555 and 6,384 are crucial supports — as long as 6,384 holds, it remains a buy-on-dips market for me.
Wishing everyone a very Happy & Prosperous Diwali!
May this festival of lights bring you wealth, wisdom, and winning trades!

Warning Signs Flashing: SPY May Plunge After Earnings SeasonAfter the recent rollercoaster in equities and crypto, markets are entering a critical period: earnings season. While the initial rebound after last Friday’s selloff has restored some optimism, the broader picture suggests potential downside for SPY in the weeks ahead.
Earnings Season: A Stress Test for Stocks
The third-quarter earnings season kicks off with major banks and tech companies reporting this week. Expectations are high: analysts project around 8% EPS growth for S&P 500 constituents.
However, several factors indicate that this season could reveal underlying weaknesses:
High expectations and valuation pressure – Companies that fail to meet earnings or guidance could see outsized declines, creating ripple effects across the index.
Sectoral stress – Technology, finance, and industrials are exposed to higher input costs, slowing consumer demand, and margin compression. Misses in these sectors often drive SPY lower more than average.
Macro headwinds – High interest rates, slowing GDP growth, and trade tensions with China could exacerbate negative reactions.
Historically, SPY tends to be vulnerable after earnings seasons that reveal cracks in corporate performance, especially when macro uncertainty is elevated.
Geopolitical and Macroeconomic Pressures
Trade tensions: The U.S.-China conflict over rare earth metals and tariffs adds uncertainty to corporate supply chains. Even if earnings beat expectations, investor sentiment can remain fragile.
Recession risk: Economists from J.P. Morgan and S&P Global highlight a 30–40% chance of a U.S. recession by year-end 2025. Weak economic indicators can amplify post-earnings selloffs.
Volatility spikes: The VIX has started creeping higher after last week’s recovery, signaling that investors are hedging against downside risks. Historically, spikes in VIX correlate with short-term SPY declines.
Conclusion: Post-Earnings Risk for SPY
Traders and investors should watch for:
Missed earnings or cautious guidance from major banks and tech companies.
Rising VIX and fear-driven flows into protective options.
Breaks of critical technical support levels in SPY.
In this environment, positioning for a modest correction or increased volatility in SPY could be prudent until the earnings season clears and market sentiment stabilizes.
Weekly Market Outlook | Nifty · BankNifty · S&P 500Nifty closed 25,285 (+390 pts) after making 25,330 / 24,881 — once again perfectly respecting my range of 25,300–24,500! 💪
As expected, BankNifty confirmed its W-pattern breakout, jumping 2% — strength clearly visible in the PSU bank pack.
Next week focus
• Above 25,450 → breakout toward 25,700+
• Below 25,130 → selling pressure till 25,000 / 24,850
Range for the week: 25,700–24,850
Shorters, stay patient — only if BankNifty cracks 55,700 does weakness confirm. Till then, it’s buy-on-dips for me.
Global cue: Trump’s proposed 100% China tariff shook US & crypto markets — watch its spillover effect on sentiment.
S&P 500 closed 6,552 (-160 pts). Holding above 6,360 = buy-on-dips;
Above 6,625 → uptrend resumes.
Below 6,360 → correction toward 6,225 / 6,142 / 6,100.
Exciting week ahead for both momentum traders & option sellers!

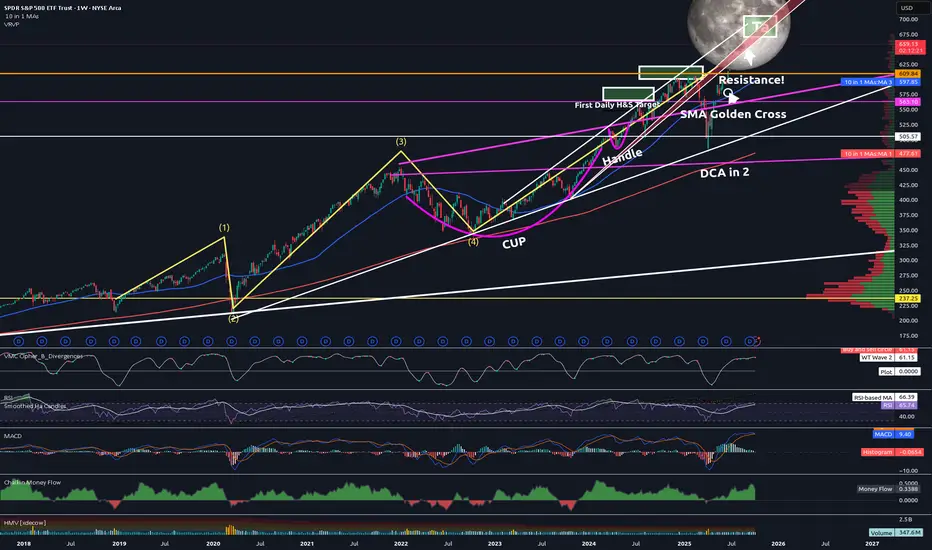
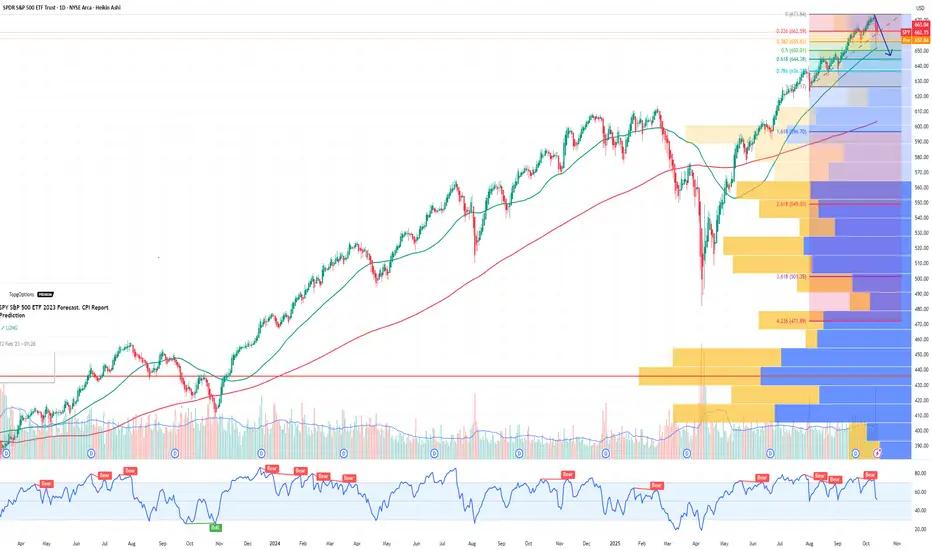
SPY Reaches 2-year Final Target #3 (670) and DropsTrading Fam,
I promised a video update this week. However, due to unforeseen issues with my streaming app, I have opted for a static post instead. Apologies but I'll go through updates on our chart, explaining where we are, and where we might be headed next.
We'll start here with the weekly. I want you to focus in on the yellow Elliot Wave pattern. All along I have stated that I am no Elliot Wave expert. However, I seem to have gotten it right this time ...at least so far.
The first wave starts around Dec. of 2018. We dipped harshly during COVID and that completed our wave (2). The third wave is often long and extended and we hit our top in Jan. 2022. Wave (4) then gave us our dip and the start of our Cup and Handle seen in pink. I don't know much but I do know wave (5) is often equal or greater than (3). I started looking for a final target for wave (5). My Cup and Handle soon offered that target to me.
So now let's zoom into the daily:
You can see Target #1 was nearly hit. You'll remember I sold here due to nearly touching that white uptrend. I waited for the dip back into support (RED) and re-entered focusing in on Target #2 which also coincided with price hitting that white trendline and being rejected. We bounced on that red support again and double-topped. This time we broke through our red support and came all the way down to another support which I expected to hold (white). It did. I then knew we were on our way to Target #3. But I've stated all along that I did not think we'd break back above that previous red support which now has become massive resistance. So far, I have been right. The Cup and Handle pattern also gave me that 670-700 target. Nailed that as well.
Could we go higher? Absolutely. That's what blow-off tops do. They often surprise the market with one final wild ride. Everyone piles in out of FOMO. And I have expected a final price of up to $700 SPY all along. Will this happen? Remains to be seen. But my experience has taught me that we are near the top. And since, I am satisfied with a price of $670 being that this is the beginning of my third and final target box, I pulled most of my personal money out a few days ago. My main goal now is to avoid greed and preserve capital. That is what I will do until the market tells me otherwise.
I want to take one final look at our monthly chart:
See that thick white trendline that starts in 2009? That is the beginning of our secular bull market. This next part is going to sound insane but that is often the case when you read what I write, we could technically drop all the way down to SPY 300, over 55% from where we are right now, and STILL be in a bull market! Can you imagine how many traders will start to scream that the world is ending? And yet, technically the market will remain bullish. Crazy to think about, but definitely worth noting.
✌️Stew