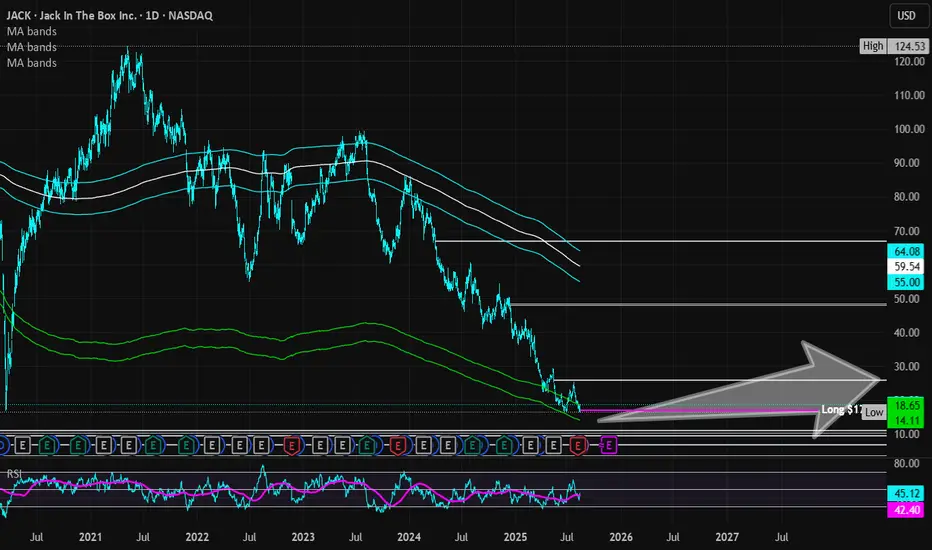
Jack in the Box | JACK | Long at $17.00**This is a reentry after cashing out of the original trade with gains. Basic writeup and technical analysis still apply which was originally written here:
Jack in the Box NASDAQ:JACK reentered my "crash" simple moving average zone. While there is a high chance the price may ride the lines down even further, there is currently a double bottom. A company like NASDAQ:JACK will benefit from interest rate cuts due to its significant debt, but it is a very risky trade. There are better companies out there.
However, with an 18 million float and 27% short interest, this could get very interesting as rates are cut. It's a gamble that hinges highly on company turnaround ("Jack on Track" plan) and the possible sale of Del Taco. Thus, at $17.00, NASDAQ:JACK is in a personal buy zone.
Targets into 2028:
$22.00 (+29.4%)
$26.00 (+53.0%)
Squeeze
IVP YOLO TO THE MOON MEME STOCKVolume picked this stock up, and it's at a good retracement point where the price dropped and should likely see a return as people close short positions. Which means you could see a huge increase in price in a short time due to volume and indicators.
I marked the numbers that seem like a good sell zone.
1200% is no joke.
If you've never been in a scenario where you trade a stock that can go up 1200 percent in a day or two, then you should understand that there is a lot of fast up and down movements. Meaning, don't be afraid to buy and sell a couple times as indicators show overvalued.
These types of stocks drop as fast as they rise.
The right person with enough money could spike the price higher, technically as high as a few dollars, but don't expect that probability.
Anyway, I think I caught this one early, and the buy is now.
Thanks for following!!
If you end up rich from this trade, don't forget to send me a little donation, I'll gladly accept.
If you end up poor from this trade, uh... it's a long term hold.

Prebreakout Buildup at a 4-Year Resistance: IPCA LaboratoriesTL;DR: The High-Conviction "Pre-Breakout Buildup & Squeeze" Setup
IPCA Labs is currently edging towards the apex of a year-long pennant consolidation at a major 4-year resistance level. With both NIFTY and NIFTY Pharma indices looking bullishly poised, the odds favor bullish breakout in IPCA soon.
Step 1: The "Forest to the Trees" Filter (Tailwinds)
The Forest (Nifty 50): The broad market is structurally robust, coiling near record highs and positioned for a possible continuation breakout.
The Trees (Nifty Pharma Index): The NIFTY Pharma index also looks good, positioned for a possible bullish breakout.
Conclusion: Macro and sector tailwinds are firmly in place to support individual pharma breakouts.
Step 2: Big Picture (Stan Weinstein Stage Analysis)
The 4-Year Ceiling: The stock has been capped by a major horizontal resistance at ₹1380 since 2021.
The Buildup Phase: An initial breakout attempt in late 2024 failed to sustain, leading to a year-long pennant-shaped continuation pattern. This oscillation has allowed the stock to absorb the multi-year overhead supply.
The Stage: Having spent significant time basing and now coiling at range highs, IPCA is primed for a transition into a decisive Stage 2 Advance.
Step 3: Execution Structure (Prebreakout PA Analysis)
The Buildup: The last 12 months show a tightening "pennant" structure right at the key ₹1380 level - a classic sign of institutional absorption.
Momentum Signal: November 2025 saw a strong bullish monthly bar breaking above the 20-Month EMA and the resistance level on high volume.
The Prebreakout Squeeze: December 2025 is closing as a tight doji above the breakout level. This narrow-spread candle above the EMA/resistance is a "squeeze" that creates tension - and could resolve in an explosive move if bulls can push beyond the year-long pattern's boundary.
Step 4: Fundamental Engine (The Notebook)
Operational Turnaround: Q2 FY2026 saw robust profit growth of 23.13% YoY (₹282.57 Cr) and record quarterly revenue.
Margin Expansion: Standalone EBITDA margins surged to 25.46%, a 257 bps improvement reflecting enhanced operational efficiency.
API Surge: The API business is a major growth driver, with sales increasing 28% to ₹408 Cr in the most recent quarter.
Valuation Gap: Currently trading at a P/B of ~4.9x. While higher than some peers, its ROA of ~7.3% and ROE of ~12.8% are trending upward as operational leverage kicks in.
Financial Health: Maintains a very low debt-to-equity ratio of ~0.19 with an interest coverage ratio of 34.9x.
Possible Entries:
Aggressive: Within the current "squeeze" zone (₹1380–₹1470), as close to the 20-Month, or 20-Week EMA as possible.
Important note for this entry - check how the monthly closes (in 2 days from now). If it closes somewhat like it looks now (a tight doji), then this entry would have decent odds.
Conservative: On a decisive weekly close above the pennant's upper boundary.
Invalidation of the setup: Bearish break & close below the pennant, or below the 20-month EMA (or 20-week EMA if following on weekly)
Disclaimer: This analysis is for educational purposes only and does not constitute financial advice. Market investments are subject to risk; please consult a SEBI-registered advisor before trading.

CMCT EASY PEASEE LEMON SQUEEZEEI have used a combination of EMA 9, EMA 21, Squeeze Indicator and ATR indicator to map the squeeze points in recent price action in order to make some observations.

SHIFTING TO BULLISH EXPOSURE: THE SQUEEZE IS NOW IN PLAYOver the past few days, I’ve been closely analyzing the critical 4184–4193 zone, initially watching for exhaustion signals to position for a potential downside move.
However, the market has spoken clearly.
What just happened is exactly the opposite:
a clean, technical, textbook short-squeeze.
⸻
🔥 What exactly happened?
✔ Price reacted violently to the upside right inside the zone previously marked as “LOOK FOR ENTRY” (the white zone).
✔ The breakout of 4184–4193 occurred with:
• strong increasing volume,
• decisive large candles,
• MACD aligned on 5–15–30m,
• RSI pushing upward with no bearish divergences.
✔ The previous structure showed a perfect compression, a classic setup before a squeeze triggers.
✔ And most importantly: price entered an area of low volume, which typically fuels fast expansions.
All of this confirms that sellers were trapped under the breakout and are now fueling the upside by getting stopped out.
⸻
🔄 Shift of focus: now positioned for bullish continuation
Given the evidence, I’m adapting the plan:
➡️ 1. I’m now exposed to the bullish scenario
I’m keeping my long positions as long as:
• momentum remains strong,
• volume continues to support the breakout,
• and price does not lose 4184 with force.
My management targets are:
• 4205–4210 (first resistance),
• 4220–4225 (1.618 extension),
• 4244 (major higher high, main target if the breakout sustains).
I will close partials or tighten stops if I see clear signs of exhaustion using volume, candle behavior, or MACD in these zones.
⸻
🔍 2. Still monitoring the bearish scenario
Even though the structure now favors bullish extension, I’m still paying attention to:
• a clean rejection around 4192–4205,
• bearish divergences on 5–15m,
• a failed breakout retest,
• heavy rejection candles with volume on 1m,
• or a MACD bearish cross on 5–15m after hitting key fib levels.
🔻 If that happens, it could be the beginning of the deeper pullback we expected before the squeeze triggered.
⸻
📌 My immediate plan
To confirm continuation, I will look for:
• A retest of the higher high or the 4184–4192 zone,
• Rejection or acceptance around fib retracement levels on 5m/15m,
• MACD cross as confirmation depending on direction,
• Renewed buying volume for continuation.
⸻
🧠 Conclusion
The market did exactly what we anticipated as a possible scenario:
trigger a squeeze right above the critical zone.
Now the bias is clearly bullish, but I remain cautious in case of a failed breakout or exhaustion.
At this stage, the key is to read real-time flow instead of locking onto a single idea, and continue adapting to how price structures itself.

BITCOIN - PRESSURE BUILDING - SHORT SQUEEZE INCOMING?Traders,
Bitcoin might be preparing a short squeeze. Let’s walk through the flow, structure, math, and correlations step-by-step so you understand what is happening and why it matters.
1. What Happened
Bitcoin dumped from 96k → 80.6k last week. Price then bounced and is now trading around 87k.
Under the surface:
Stablecoin-Margined Futures (USDT-M)
Since 27 Oct:
OI increased from 225k → 280k contracts
That’s +55k contracts (~24% increase)
CVD went down, not up
Meaning:
These new positions were mostly shorts
The market added leveraged short exposure during the dump
Interpretation:
USDT-M traders attacked the move lower aggressively. Increasing OI + dropping CVD = new sellers dominating, not buyers.
Coin-Margined Futures (BTC-M)
Since 27 Oct:
OI and CVD both dropped from 7.41B → 5.90B
BTC-M is usually “higher conviction” demand
A drop in BTC-M CVD means
Longs closing
Capitulation
Reduced bullish positioning
Interpretation:
Native BTC longs stepped aside. Short-term leverage traders pressed the downside.
Spot + Futures CVD (27 Oct → 21 Nov)
Spot CVD ↓
Futures CVD ↓
Price ↓
All making lower lows and lower highs
This was a clean, correlated downtrend.
2. The First Major Shift: Spot CVD Divergence
Since 21 November:
Spot CVD:
Higher highs
Higher lows
Rising together with price
Indicates real demand stepping in
Stablecoin Futures (USDT-M):
Still making lower lows
Still pressing shorts
Still fighting the spot buyers
This is the key:
Spot = real money
Futures = leveraged speculation
Rising spot CVD vs falling futures CVD = absorption pattern
Meaning:
Strong hands buy
Weak shorts keep selling
Price rises anyway
The pressure builds
Shorts eventually run out
The squeeze begins
This is one of the cleanest pre-squeeze structures you can get.
3. The Math: Fibonacci Rotation Logic
Let’s break down the structure.
(A → B → C Structure)
A = 116k (27 Oct)
B = 98.710
C = 107.403 (retracement)
The retrace sits at 0.5.
The reciprocal extension is 2.0
The 2.0 extension lands exactly at the 21 Nov wick (~81k)
This is a perfect harmonic rotation.
(X → Z → A Extension)
X = 06 Oct high
Z = 18 Oct low
A = 27 Oct high
Fibonacci extension from X → Z → A:
1.618 extension = 80.544
It matches the 2.0 from the ABC structure
It matches the 0.886 retracement on the HTF
Three independent mathematical signals hitting the same level. This is extremely rare and confirms the 81k zone as a rotation completion.
4. Structure Break
Since the 10 Nov low:
4H is making higher highs & higher lows
The descending trendline from 11 Nov is broken
Trend shifted from controlled downtrend → early reversal
Structure now favors continuation upwards as long as higher lows hold
Interpretation:
Sellers who relied on the trendline no longer have control.
4.5 Intermarket Correlation: Why Bitcoin Dumped When ES Dumped
Another important factor:
Bitcoin dumped because ES dumped.
From 12 Nov → 21 Nov:
S&P500 (ES)
Dropped from 6900 → 6525
–5.43% correction
Bitcoin:
Dropped from 107k → 80.5k
–24.77% correction
BTC acted as a ~4.5× levered version of ES.
BTC acted as a ~4.5× levered version of ES.
Correlation Data:
Rolling BTC/ES correlation increased from 0.38 → 0.74
Meaning BTC traded almost in sync with equities during the selloff
Why?
Risk-Off Mechanics
When ES sells off:
Equity funds de-risk
Macro algos rotate out of high beta
Volatility spikes
Systematic funds reduce exposure
Crypto is treated as “high beta tech”
BTC amplifies the move by a factor of 3–5×
Bitcoin didn’t dump because crypto was weak — It dumped because macro markets were risk-off.
Why this matters now
ES has stabilized
BTC stopped following ES lower
Spot demand started rising
BTC/ES correlation is dropping again (from 0.78 → ~0.55)
USDT-M shorts didn’t adjust
This is exactly when short squeezes start on BTC:
Macro stabilizes
Crypto regains independence
Shorts remain positioned for risk-off
Spot buyers take control
Price accelerates upward
This is a classic intermarket correlation unwind.
5. USDT Dominance (USDT.D) Confirms Risk Rotation
USDT dominance has turned down, which means:
Traders are deploying capital
Less stablecoin sitting idle
More risk-on appetite
Historically aligns with BTC beginning new legs up after HTF rotations
When USDT.D falls at the same time spot CVD rises, the market is shifting capital into crypto.
6. Targets: 118.5k → 124k
These are the next liquidity magnets.
Target #1: 118.5k
Confluences with:
1.141 extension of the 11 Nov → 12 Nov move
First major liquidity pool
First real “decision point” for the market
Target #2: 124k
Confluences with:
A weak high that will be swept
1.618 extension of the same 11→12 Nov move
Natural squeeze exhaustion zone
Perfect location for a Swing Fail Pattern
Rotation Logic
Shallow retraces → larger extensions (1.618 → 2.0)
Deep retraces → smaller extensions (1.272 → 1.414)
BTC currently fits the shallow retrace profile → favors strong extension
7. Other Pivot Points
Marked on the chart:
Minor LVNs
Minor-imbalances
CME Gaps
Expect reaction at each point.
8. Invalidation & Bearish Pathway
My invalidation is clear:
Trading below 80k invalidates the squeeze setup.
Below 80k, the absorption breaks.
If 80k is lost, the downside extension levels become:
74k
70k
64k
These levels are:
The natural downside extension pathways from the 11 Nov → 21 Nov swing
They form the mirrored rotation of the bullish structure
Final View
We dumped because macro went risk-off
Bitcoin amplified the ES selloff
Shorts loaded heavily into the move
Spot buyers stepped in first
A clean absorption pattern formed
Mathematical rotation completed at ~81k
Structure flipped
Risk metrics like USDT.D turned down
Correlation with ES is now unwinding
If Bitcoin continues to hold above 80k and spot keeps leading, the squeeze toward 118.5k → 124k becomes the most likely path.
Abbreviation List
BTC – Bitcoin
ES – S&P500 E-Mini Futures
OI – Open Interest
CVD – Cumulative Volume Delta
USDT-M – Stablecoin-Margined Futures
BTC-M – Coin-Margined Futures
HTF – Higher Timeframe
LVN – Low Volume Node
AVWAP – Anchored Volume-Weighted Average Price
PRZ – Potential Reversal Zone
SFP – Swing Fail Pattern
Fib – Fibonacci
CTA – Commodity Trading Advisor (systematic trend-following funds)
VIX – Volatility Index
Beta – Sensitivity of an asset’s movement relative to a benchmark
Risk-Off – Market environment where investors reduce exposure to risky assets
Risk-On – Market environment where investors increase exposure to risky assets
-----
If you enjoy this type of deep, data-driven breakdown—spot vs futures, CVD flow, intermarket correlation, and rotation math—drop a like and leave a comment. It helps me see whether these higher-level analyses bring value, and it motivates me to keep sharing them for free.

POLKADOT – LONG SETUP - LOADING SHORT SQUEEZE POTENTIALTraders,
$Polkadot is close to forming a high probability long setup, but it is not confirmed yet.
Here is the compact breakdown.
WHY DOT IS SETTING UP
Since 08 November price has been grinding down
Spot CVD, Coin Margined CVD and Stablecoin Margined CVD all fell with price which confirms real sell pressure
On 21 November the lows were swept
Today price tapped 2.220, the pivot level, and reacted
But we are still trading below 2.250, which means the squeeze setup is not active yet
Why the sweep matters
On Bybit around 915k Coin Margined short contracts opened into the low.
Coin Margined shorts use DOT as collateral which means when DOT rises they take a double hit.
The short loses value and their collateral also loses value.
This makes them far easier to liquidate once price reverses.
But price must reclaim the key level to trigger this effect.
THE KEY LEVELS
2.220 = the pivot
This is where price reacted
This is the 1.113 extension of the 04 November to 08 November move
This marks the completion of the downside rotation
2.250 = the trigger
This is the level price must reclaim and trade above
Above 2.250 shorts begin to go underwater
Above 2.250 the squeeze becomes active
Until $Polkadot trades above 2.250 the setup remains unconfirmed.
GAMEPLAN
Wait for two 30 minute candle closes above 2.250
This confirms the reclaim and activates the long setup
Look for a retest of the 2.240 to 2.250 zone
If buyers defend that retest it is the clean entry
As long as DOT stays below 2.250 this is only a potential setup
Falling back under 2.200 weakens the idea and requires reassessment
TARGETS IF CONFIRMED
If $Polkadot reclaims 2.250 the upside targets are:
3.675
3.877
4.063
4.327
Each level is a point to reassess momentum and structure.
FINAL VIEW
DOT swept the lows and trapped a large block of Coin Margined shorts.
The pivot at 2.220 has been touched, but the real trigger is 2.250.
Only once price reclaims and trades above 2.250 does the squeeze structure become active.
Until then it remains a potential high probability setup that requires confirmation.
Until the candles speak again,
ThetaNomad
-----------
If this helped you read the flow, drop a like and a comment
None of this is financial advice

BTC FED Week Map - Daily WrapNo trades for the second day: BTC stayed inside the 87–89k chop zone and the weekly roadmap is unchanged.
Key levels into the FED:
• 90k – squeeze line; post-FED acceptance above opens room toward 92–93k.
• 85.3k – breakdown line; clean loss + failed reclaim points toward 82–81k.
• 87–89k – intraday no-trade box until the dust settles.
Flat into the event. Map, not signal.
If you find this intraday map useful, hit 👍 and follow for updates.
Share your alternative levels or invalidation ideas in the comments — I’m here for discussion, not signals.

ETHEREUM | THE MATH IS COMPLETE | SHORT SQUEEZE LOADING?Traders,
ETH is setting up for a potential big short squeeze that can rip price up hard. Let me walk you through the math, the order flow and the volume profile that are all pointing in the same direction.
1. The Fib math: 0.5 retrace into 2.0 extension
At point A ETH printed the last impulsive wave up before the dump. After point B the market sold off and then retraced exactly to the 0.5 retracement at point C.
Why 0.5 rotates into 2.0 from a math perspective :
A 0.5 retracement means price has pulled back 50 percent of the prior leg.
-> If AB is 1000 points, a 0.5 retrace gives a 500 point pullback.
In my Fibonacci Rotation table, 0.5 is paired with 2.0 because they are exact reciprocals.
-> 1 divided by 0.5 equals 2.
So when the market respects the 0.5 retrace, the natural projection is the 2.0 extension in the opposite direction.
-> You are effectively rotating the same structure: halve in the pullback, double in the extension.
On this chart that 2.0 extension lands right into the $2880 to $2890 area. From C that 0.5 retrace is not random. It is the anchor that mathematically rotates into the 2.0 target and defines the first major squeeze zone above.
2. HTF Fibonacci extension confluence
From there we step out to the higher timeframe structure.
We take a Fibonacci Extension and draw it:
From the highest point on the chart (X)
Down to the first big swing low (Y)
Then up to the next swing high (Z)
This measures the high to low structure and then projects extensions of that full swing.
On that HTF extension, the 1.618 level sits right in the same area as the 2.0 from the 0.5 rotation.
Why the 1.618 and 2.0 together are strong confluence :
1.618 is the classic golden ratio extension.
-> A lot of systems, harmonics and algos respond around 1.272 and 1.618.
2.0 is the clean reciprocal extension of the 0.5 retrace from the internal leg.
-> These two levels are calculated from two different swings.
One comes from the internal retracement structure.
-> The other comes from the higher timeframe swing.
When independent measurements give almost the same price area, that zone is not made up. It is where different groups of traders and different models will naturally cluster orders, targets and stops.
So $2880 to $2890 is a real Fib confluence, not a guess. It is a logical first destination for a short squeeze and it sits exactly inside the current FVG.
3. Fixed Range Volume Profile and the LVN at $2880
Now we bring in volume.
When we draw a Fixed Range Volume Profile from the swing low of 9 April to the swing high of 24 August, we see a very clean Low Volume Node (LVN) at roughly $2880. That LVN sits inside the same Fair Value Gap that price is currently exactly trading in.
What this actually means :
A Low Volume Node is an area where historically the market did not trade much.
-> Very few contracts changed hands there.
-> The auction basically skipped through that price zone.
In an auction model, high volume areas are where the market is comfortable.
-> Price spends time there, value is accepted, big rotations happen.
Low volume areas are the opposite.
The market rejected that area before.
-> Price moved through it quickly because either buyers or sellers completely dominated and there was no real back and forth.
So when price comes back down into an LVN inside an FVG like this, it tells me:
Price has moved back into an old inefficiency where previously there was no interest in building value.
If buyers are absorbing there (which we see from spot metrics), then the LVN can act as a springboard.
Either price slices straight through the LVN to the next high volume area.
Or price tags it, rejects sharply and uses it as the launch zone for the next leg.
In this case the LVN at $2880 is aligned with:
The 2.0 extension from the 0.5 rotation
The HTF 1.618 extension zone
The current FVG
That is a triple confluence of math, volume and inefficiency. Price did not randomly land here.
4. Spot A/D: hidden bullish accumulation
Now we go under the candles and look at order flow.
First is the A/D (Accumulation / Distribution) indicator, applied on spot and mainly on the 4H and higher.
Why A/D on spot and why on 4H plus :
Spot represents real ETH being bought and sold.
-> No funding games, less synthetic noise.
-> It shows where true demand is stepping in.
Futures can be distorted by hedging, arbing and leverage rotation.
On low timeframes there is a lot of noise from scalpers and short term spoofing.
-> 4H and higher smooth out that noise and reveal the bigger players.
What we see now:
On the spot A/D line both highs and lows have been trending higher.
Price, in the same window, is trending lower.
So price is making lower lows, A/D is making higher lows and higher highs.
This means:
On down moves, there is more volume being absorbed by buyers than being pushed by sellers.
Sellers are getting absorbed.
Smart money is accumulating spot while the chart still looks bearish to the average viewer.
That is textbook hidden bullish accumulation.
5. CVD and OI: shorts are loading into that accumulation
Now it gets even more interesting when we bring in CVD and OI.
5.1 Aggregated Spot CVD vs price
On 13 November:
Aggregated Spot CVD sat around -31.61k.
From that point it started trending up, forming higher highs and higher lows.
Today it is around 100.91k.
Change in Spot CVD:
100.91k minus -31.61k = +132.52k
So net buying on spot increased by about 132.5k units while:
Price moved from roughly $3150 down to about $2988
That is a drop of 162 dollars
162 divided by 3150 is about 5.1 percent
So we have:
A big positive flip in net spot demand
Only a small net drop in price
If bears were truly in control, that amount of spot absorption would not allow price to stay this close. You would see a much heavier breakdown earlier in the move. Instead buyers have quietly soaked up the selling and then pushed net CVD positive while price is only down around 5 percent.
This fits perfectly with the bullish accumulation narrative.
5.2 Futures CVD and OI
On the futures side:
Aggregated Stablecoin Margined Futures CVD dropped from about -408k to about -1.34M.
-> Roughly -932k more net selling.
Aggregated Coin Margined Contracts CVD dropped from about -88M to about -807M.
-> Roughly -719M more net selling.
At the same time:
Stablecoin Margined OI increased from 4.39M to 4.88M.
-> Increase of about 0.49M which is around 11 percent.
Coin Margined OI increased from 1.81B to 1.91B.
-> Increase of about 0.10B which is around 5.5 percent.
So futures traders are:
Aggressively hitting into the bid
Increasing net short pressure (CVD more negative)
Keeping positions open and even adding more (OI going up)
All of this while:
Spot is quietly buying
Spot CVD is strongly positive
Price is sitting in a triple confluence zone around $2880 inside an LVN and FVG
A simple way to think about it:
Spot is the strong hand slowly loading.
Futures is the weak hand aggressively shorting into that demand.
Price is held in a relatively tight range compared to the amount of futures selling.
Once that selling slows or some catalyst hits, all of those shorts are fuel. They will have to cover into a thin LVN zone, through a Fib confluence and into areas where there was previously low participation. That is exactly how you get fast vertical moves.
6. USDT.D confluence
Now, when looking at the USDT.D chart on the HTF, we can see that it has rejected from the 0.886 retracement, broke structure and is now respecting a descending trendline, while RSI is showing heavy bearish divergence. This means that even though USDT.D tried to push higher, each push had less and less momentum behind it, and buyers of dominance are getting weaker. For crypto, that is important, because a topping and rolling over USDT.D often signals capital rotating out of stablecoins back into risk assets. In confluence with everything discussed before, this adds another layer to the thesis. Spot is accumulating, futures are overcrowded on the short side, ETH is sitting in a strong Fib and volume confluence zone, and at the same time USDT.D is showing signs of distribution and potential downside. If USDT.D continues to bleed down from this 0.886 rejection, it structurally supports a scenario where ETH squeezes higher into the targets discussed.
7. Targets and the bigger picture
Based on this structure and the order flow, the upside targets I am watching are:
$3800
$4400
And if crypto gets proper momentum, a final Swing Fail Pattern around $5100
The logic behind these levels:
$3800 and $4400 are not random numbers. They line up with higher timeframe Fib extensions and prior structural pivots and volume distribution levels. Think of them as natural waypoints where bigger players will take profit, hedge or reposition.
$5100 is where I can see a classic SFP scenario:
We push into a new high.
Late buyers chase the breakout.
Existing shorts get squeezed.
Then once liquidity above the prior highs is taken, a sharp reversal becomes very likely.
So my roadmap is:
First we reclaim and rotate out of this $2880 confluence zone. Then $3800 and $4400 become realistic magnets. If the whole crypto complex catches momentum, $5100 as an SFP high is very much on the table.
Invalidation:
Invalidation for this specific bullish accumulation and squeeze thesis comes only if ETH starts trading below $2470. As long as we hold above that level, every dump is still in quiet bullish accumulation territory for me, unless order flow starts telling another story.
7. Conclusion
Fib structure points to $2880 as a key confluence level.
Fixed Range Volume Profile confirms this with a clean LVN inside an FVG.
Spot A/D and Spot CVD are showing bullish accumulation while price grinds down.
Futures CVD and OI show shorts loading into that spot absorption.
Upside roadmap: 3800, then $4400, with a possible SFP (Swing Fail Pattern) around $5100 if the trend extends.
Invalidation only if ETH starts trading below $2470. Until that happens, every dump for me stays in quiet bullish accumulation territory, unless order flow flips.
USDT.D confluence.
Same as always. This is not financial advice. Trade your own plan, size your own risk. I am just laying out the math, volume and order flow that I see behind this potential short squeeze on ETH.
Markets do not whisper without reason. When math, volume and flow all hum the same melody, I prefer to listen before the crowd hears the drop.
-------
If this spoke to the part of you that loves clean math and dirty squeezes, drop a like, leave a comment, and bookmark it. When the candles start to sprint, you will want to remember where the story was already written.
- ThetaNomad

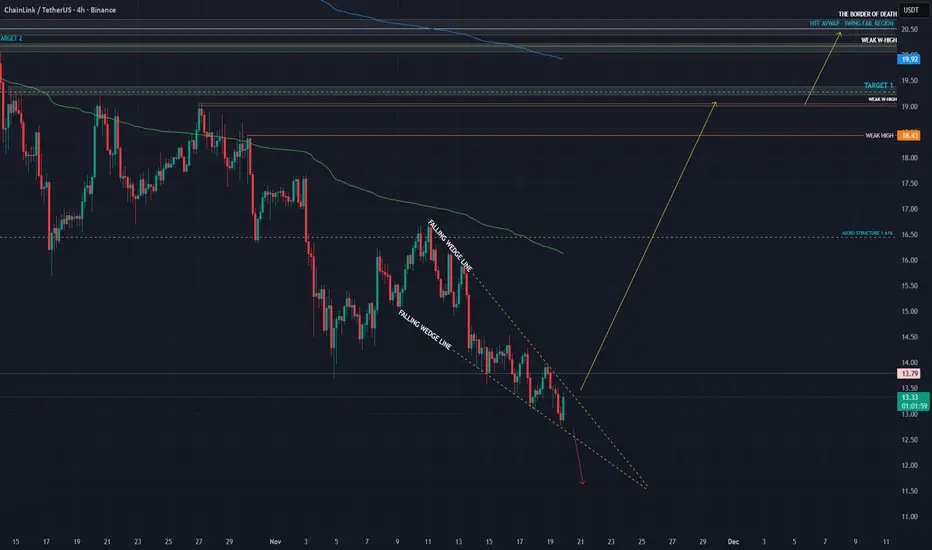
CHAINLINK - LOADING A SUPER SWEEP UP! - Traders,
In my last $CHAINLINK analysis
I wrote out two scenario’s.
Scenario 1 did not play out. Scenario 2 was simple: a dump into the next 1.618 extension, and from there the hunt for a fresh long setup begins. That 1.618 was at 12.90$
And here we are.
Pixel perfect.
So are we wrong? This is why having your levels outlined and being patient matters more than anything. When one path closes, structure reveals another. The chart always speaks.
But only those who wait can hear it.
What we are looking at
$CHAINLINK dumped straight into the 12 to 13 dollar zone.
This zone is not random. It is technically one of the most important pockets on the chart.
Let’s break down why.
Mathematical Levels – The Spot Chart
To avoid distortion caused by the 10 October liquidation wick, we start with clean mathematical levels on the spot chart.
At 12.886 we have the high timeframe 0.886 Fibonacci retracement. This is the deep retrace zone where momentum often shifts. Price tends to exhaust here because 0.886 represents the final Fibonacci rotation before structural invalidation. It is where the last sellers usually throw in everything they have.
At the same time, this level lines up with the 1.618 extension of the first structure after the 10 October crash. The initial high to low is marked with a yellow arrow in your chart.
This means one thing:
The downside auction has mathematically completed.
Both the retracement leg and the extension leg have landed in the same pocket.
This is real confluence.
The HTF AVWAP Confluence
Chart:
On 06 August 2024, LINK printed a new significant low.
This low kicked off a bullish wave with strong volume behind it.
That wave marked the beginning of a long uptrend, which means the AVWAP anchored to this low carries real weight.
Now here is the fascinating part:
The lower band of the anchored AVWAP aligns perfectly with:
The HTF 0.886 retracement
The 1.618 extension
The current price zone
The mathematical exhaustion pocket
This is not normal.
This is precision level confluence.
What this means
When AVWAP, Fibonacci, and wave extensions align, it signals that institutional cost basis, market memory, and auction math are all pointing to the same zone as fair value.
This is where smart money steps in.
Falling Wedge – The Technical Cherry
The final ingredient:
LINK has printed a clean, textbook falling wedge.
A falling wedge is a bullish reversal pattern where momentum compresses and the final sellers run out of strength. It represents exhaustion, not continuation.
Combine that with AVWAP, Fibonacci, and mathematical symmetry, and you have a powerful structural reversal setup.
Order Flow Confirmation
The order flow confirm the technical story:
Spot CVD has been trending down, but price is no longer following with the same intensity.
Stablecoin and coin margined CVDs are still pushing lower, but again, price is resisting the pressure.
Open Interest increased into the lows. New shorts opened into exhaustion.
Funding remains small and neutral.
Price is holding the key zone.
This is absorption. When shorts push and price refuses to break, the market is loading a spring.
Conclusion
The 12 to 13 dollar range is not random noise.
It is a high timeframe confluence zone made of:
The 0.886 Fibonacci retracement
The 1.618 extension completion
The lower AVWAP band from the August trend origin
A falling wedge structure
Order flow absorption
New shorts entering into weakness
LINK is setting up for a powerful sweep if this zone holds.
Targets.
$19.30
$20.50
$38.00 if we move higher.
Breaking out of the wedge pattern invalidates the idea.
--------
The chart is whispering again. Patience turns whispers into signals.
--------
If you like this kind of analysis, drop a like and leave a comment. Everything here is shared for free so more people can cut through the noise and finally see what is actually happening under the surface. No hopium. No fear. Just real data, real structure, and real order flow.
The goal is simple. To help traders stop guessing and start understanding what the market is actually saying.
Stay sharp.
Stay objective.
And remember… the chart whispers long before it speaks.
- ThetaNomad
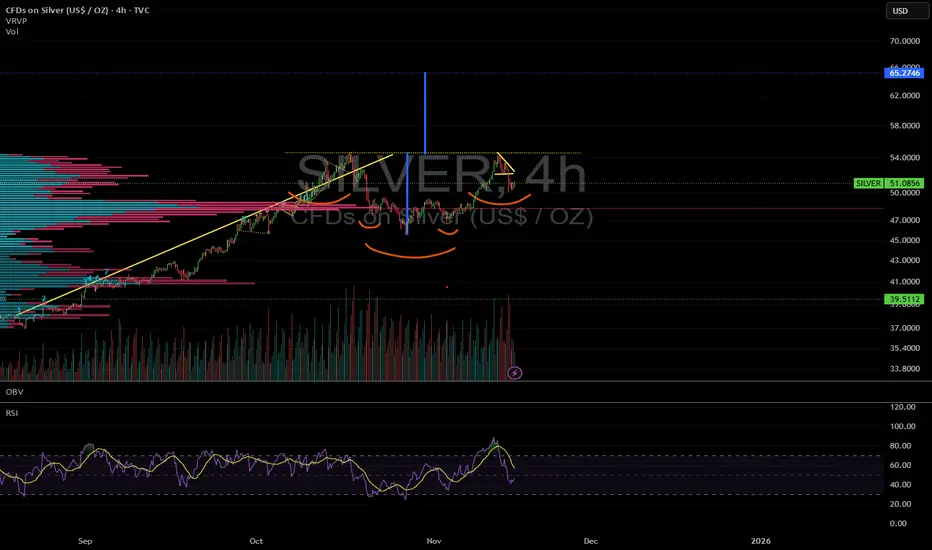
SILVER TO 65 $ ?Silver is undergoing a consolidation in the 47 to 54 $ range recently.
There is an inverse Head and Shoulders pattern forming right now.
The implied price objective of 65 $
At a time where many (even smart) invesors are waiting for a dip down to 40 (and even 30) $ could that be the surprise that hot assets offer in a raging bull market ?
The pattern is there ! Will it play out ?
I am positioned.
BITCOIN | LONG BIAS | POTENTIAL REVERSAL AND KEY LEVELS TO WATCHTraders,
Bitcoin is now sitting inside a large falling wedge structure on the daily chart. Wedges of this type often form during trend exhaustion and can precede significant reversals when the lower boundary is reached. This pattern sets the stage for everything that follows in this analysis.
Below is the full breakdown of why I believe Bitcoin is positioned for a potential reaction and where the most important levels are located.
Recap of the Previous Bitcoin Analysis
In the previous IG:BITCOIN analysis
I mentioned two scenarios. Scenario one outlined the following sequence:
• Price pushes into 107k to 108k
• That move sweeps the weak high and taps the AVWAP anchor
• If spot CVD slows or perps shift into net selling, a rejection becomes likely
• That rejection sends price back toward the mid range and possibly into 101k to 102k
• Continuation into the higher timeframe LVN at 98k becomes possible
Every single step unfolded almost perfectly.
Current State of Bitcoin
Bitcoin is now sitting directly on the lower band of the AVWAP anchored from 7 April 2025.
What this means
AVWAP stands for Anchored Volume Weighted Average Price. It calculates the average position of market participants beginning from the chosen anchor point. The April low marked a major shift in trend structure. When price reaches the lower band of an AVWAP anchored to such a significant low, it often acts as dynamic support. This is because it reflects the average entry of early cycle buyers.
If price holds and begins reclaiming from this area, it signals that the strongest hands are defending their positions. If it fails, the market risks a deeper flush into lower demand clusters.
Value Zone Analysis with Fixed Range Volume Profile
To determine whether Bitcoin is inside a significant value region, we use a Fixed Range Volume Profile (FRVP). The range is anchored from the April low to the October high.
Zooming into the profile on the left, price has now re-entered the core value area of this entire swing. The red horizontal line marks the Point of Control, which is the level with the highest traded volume in the entire range. The current low sits almost exactly on this level.
Pixel perfect confluence.
Why this matters
When price returns to the value area after a distribution phase, two possible outcomes appear:
1. Reversal
Buyers defend value and price rotates back toward high volume nodes above.
2. Continuation breakdown
Price accepts below value, meaning even previous buyers are unwilling to re accumulate here. This opens the door to the next low volume pocket and lower demand zones.
Right now, the reaction at this level is critical because we have perfect alignment between the lower AVWAP band and the FRVP Point of Control.
Mathematical Levels and Fibonacci Structure
Now we collect the mathematical evidence. We are sitting at a core AVWAP level and a core FRVP level. Now we check if the market is stretched mathematically.
Bitcoin at the 1.618 Extension
On the four hour spot chart, I apply a Trend Based Fibonacci Extension from A to B and project it from C.
The placement rule
Ask yourself:
What was the last meaningful swing high that ended the previous trend and started the current reversal?
That swing becomes A to B. The first corrective lower high after that becomes C.
Using this structure, Bitcoin has now extended perfectly into the 1.618 level. The 1.618 Fibonacci extension is historically associated with exhaustion. Sharp downlegs often pause, take liquidity, or reverse at this point.
TOTAL at the 2.0 Extension
To confirm that this move is not isolated to Bitcoin, we check the CRYPTOCAP:TOTAL crypto market.
TOTAL reflects the entire crypto market and shows equilibrium conditions.
When Bitcoin and TOTAL stretch at the same time, reaction probability increases.
Start with a retracement from A to B:
Price nearly hit the fifty percent mark but not entirely. Then reverse the tool from B to A. Doing so reveals the extension levels below. Price is now sitting exactly at the 2.0 extension.
Why the 50 percent connects to the 2.0
If a move retraces halfway, the remaining distance becomes the basis of the flipped extension. Doubling that distance gives the 2.0 level.
Because TOTAL did not fully reach the fifty percent retracement, there is a small missing portion. To visualise this, I draw a box between the actual retracement and the fifty percent level. Then I duplicate the box under the 2.0 extension.
The duplicated box lands perfectly on the current low, showing mathematical symmetry.
Additional Mathematical Check
I also check the structure that began after the 10 October crash.
By extending from B to A, the downside projections appear. Price tagged the 1.618 level perfectly.
Full symmetry
Bitcoin at the 1.618
TOTAL at the 2.0
Internal structure at the 1.618
When all three align, the move has reached market wide symmetry. These zones commonly produce strong reactions or reversals.
Summary so far
We now have confluence in four categories:
• AVWAP support
• FRVP Point of Control support
• Fibonacci extensions on BTC and TOTAL
• Mathematical symmetry across multiple swings
Next, we check the internal fuel of the move: order flow.
Order Flow Analysis
Spot CVD Divergence
On both the one hour and thirty minute charts, Spot CVD continues making lower lows while price holds steady. This means aggressive sellers are pushing market sell but price refuses to break down. This can only occur when passive limit buyers absorb the flow.
This is hidden absorption.
Coin Margined Futures CVD
Coin margined CVD shows the same pattern: lower lows while price stays flat.
This indicates aggressive shorting with no continuation.
Why coin margined matters
Coin margined futures use BTC as collateral. When price declines, the collateral loses value. When price rises, shorts lose even more because both their collateral and their position move against them. Coin margined shorts get squeezed harder and faster.
Open Interest
• Stablecoin margined OI: holding steady. Traders continue to open or maintain positions during sell pressure.
• Coin margined OI: compressed during the dump and is now flat. This means shorts are sitting in the market and can be forced out.
Summary
Price stable
CVD falling
OI steady
This is absorption combined with short build-up.
This often leads to a sharp reversal when price begins to lift.
Volume Analysis
Chart:
Accumulation and Distribution (A D Indicator)
The A D indicator shows whether volume flows into candles or out of them.
On the one hour chart, the A/D is trending up while price stays flat. This means buyers are stepping in during down-wicks and absorbing sell pressure. Price is not showing this strength yet, which is typical for accumulation phases.
On Balance Volume (OBV)
OBV measures directional volume flow.
On the last wick down, OBV actually moved up.
This means buyers absorbed the move rather than sellers pushing price down.
This is the classic bullish volume divergence after a liquidity sweep. Both Spot and Perps Confirm
These divergences appear on both spot and perpetual futures. Spot confirmation is the strongest form of validation because it represents real buying without leverage distortion.
The combination of A/D rising, OBV diverging, Spot CVD falling, and Futures CVD falling strongly supports that the sell pressure is being absorbed.
What Happens Next
Based on everything above, I expect Bitcoin to start by taking the weak local high at 99,862. Weak highs form when the wick structure is sloppy and no real sellers defended the level. On fine tick data, this high looks even weaker.
Taking that high breaks the current local structure and potentially triggers a short squeeze. If Bitcoin begins closing four hour candles above 106,200, the next important level is 108,500.
Main Thesis
Bitcoin pushes into the first target zone and performs a Swing Failure Pattern around 115,700. With strong momentum, the move could extend into the 17,300 to 18,000 region.
Invalidation and Downside
If Bitcoin loses support and spends meaningful time below 93,000, the next major support is 84,617. This is the next Point of Control from the AVWAP auction and an extremely important level to watch.
All relevant levels are marked on the charts.
Trade safe and manage risk.
From the depths of the sands,
ThetaNomad
-------------------
If you like my analysis, give it a like and leave a comment so more people can see real analysis without the noise.

Full Reset before Full SendWhy March 2025 Could See New Highs
What's Happening Right Now?
Everyone is freaking out right now, but this is actually creating one of the best buying opportunities we've seen. Bitcoin is trading around $95,600 after dropping about 24% from its peak of $126,000 in October.
The Fear & Greed Index is at 10 (Extreme Fear) – and you know what they say? Be greedy when others are fearful. But, also, be patient and set limits.
The thing is, most people don't understand the economics behind Bitcoin or how liquidity actually works in crypto markets. We're playing a completely different game than stocks here.
The Real Cost to Mine Bitcoin (And Why It Matters)
Here's where it gets interesting. The big mining operations are producing Bitcoin for around $26,000-$28,000 per coin, while less efficient miners saw costs spike to $114,842 in October 2025... That's a massive range, and it tells you everything about where the floor is.
After the April 2024 halving, it now takes 854,400 kilowatt-hours to mine just one Bitcoin – that's about 81 years of electricity for an average home, just for one coin. That's a fun fact.
No smart miner is going to sell at a loss when they're paying that much for electricity and equipment (GPUs, etc). They'll just hold and wait. This creates natural supply constraints.
The Liquidity Trap
Right now, the market is in what I call a liquidity trap. As Bitcoin crashed from $126K down to where we are now, all the leveraged traders got wiped out. We saw $870 million in Bitcoin ETF outflows in a single day – that's both panic selling and intelligent, planned shorting, not fundamental weakness.
Here's what most people are missing: if Bitcoin drops to around $75K, it's going to unlock massive amounts of liquidity – I'm talking hundreds of millions, possibly billions of dollars that's currently locked up in long positions (Futures).
When those long get liquidated, the shorts will likely reverse their positions, that money floods back into the market and creates a supply shock. Basic economics: limited supply + sudden demand increase = price explosion.
Price Targets & When to Buy
I think we'll see $89K very soon – possibly this week between Monday and Wednesday (November 17-19, 2025). But here's my recommended strategy instead of trying to catch the exact bottom:
First Buy: $89K
Put in about 30% of what you're planning to invest. This is still a good entry even though it's not the absolute bottom.
Second Buy: $80K
Another 35% here. This is where things get really interesting from a risk/reward perspective.
Third Buy: $75K
The final 35%. This is the sweet spot where all that trapped liquidity gets released. Remember, demand increases as the price drops, and miners won't sell below cost. That's your supply shock waiting to happen.
What About MicroStrategy?
MSTR has crashed about 40% and is now trading at only 1.06 times its Bitcoin holdings, down from 2.7 times. The stock is around $200-$237 now, way down from its November 2024 high of $543.
My prediction: MSTR will probably hit the $140-$150 range, maybe even drop to $100-$120 (which is where it found strong support from March to September 2024). If we do see those lower prices, I'm going all-in on
MSTX
shares, not
MSTR
– the 2x leverage structure is better.
The Macro Picture
Fed rate cut expectations dropped from 90% to about 40%, which is why everything's selling off. But this is temporary sentiment, not permanent damage. The infrastructure is still being built, institutions are still coming in, and the fundamentals haven't changed.
Bottom Line
Be patient. Wait for the dips. Bitcoin will likely hit $89K this week, and from there we could see further drops to $80K and $75K. Each level is a buying opportunity. By March 2025, I expect we'll be making new all-time highs.
The key is understanding that crypto operates on different rules than stocks. Liquidity and supply dynamics matter more than anything else right now.
Good luck,
Terrapins

BITCOIN – LEVELS TO WATCHTraders,
We dumped. Now we are in a controlled recovery. The question is not only “are we going up” but “where will the market make its real decision.” Right now the chart is giving us two very clean checkpoints.
1. What happened
We lost the weekly open and sold off.
Spot was selling too, so the dump was real.
After the low, spot started buying again and price reclaimed above the big wick. That looks like a failed attempt lower.
Markets left a really weak low behind at ~99k. I am convinced we will sweep this low somewhere in the coming weeks.
Funding is negative while price is moving up. Shorts are still in the market. This is how squeezes start.
2. First decision zone: 107.300 to 108.000
This area is important because several things come together.
107.300 is a weak high. It stopped at a clean level without strong rejection. That often means liquidity is still sitting above it.
The AVWAP anchored from 7 April is there. Price is below it for the first time since that move. When price comes back into an AVWAP from below the market often reacts because old buyers meet new sellers.
We also have an LVN just below. That tells us the market did not trade much there before. Price likes to test that kind of gap.
So 107k to 108k is our first place to watch the data. If spot keeps pushing and perps do not start selling we can break it. If CVD stalls there it can be a take profit zone.
3. Accumulation and Distribution
On both the 1 hour and 4 hour spot charts the Accumulation/Distribution line tells an important story.
Price made a clear new low after the dump.
The A/D line did not make a new low. It actually started to turn up.
That is what traders call a bullish divergence. Price is still falling but the money flow is already improving.
In simple words. While candles were going down someone was quietly buying.
That means the bounce we see now is not just short covering or a random spike. It was prepared by real spot demand.
Futures can show a similar thing but spot is the cleaner signal because it is not influenced by funding, leverage or hedges.
When real buyers step in while shorts are still in the market it often creates the right conditions for a squeeze.
4. OBV check
On the 4h OBV you can see it popping up from the base after the dump. OBV going up while price is moving up means volume is supporting the move. This agrees with the spot A/D story. It is better when price and OBV move together than when price moves alone.
5. Scenario 1
Price pushes into 107k to 108k.
That sweep takes the weak high and tags the AVWAP.
If at that point spot CVD slows down or perps start to sell we can reject.
A rejection there can send price back into the mid zone and even lower towards 101k to 102k and in extension back to the HTF LVN near 98k.
This is the simple “first resistance holds” idea.
6. Scenario 2
This is the one I am leaning toward.
Price breaks and holds above 108k.
Shorts do not get their reaction.
Spot keeps supporting and funding stays negative to flat.
Then the market has room to go for the next real liquidity pool which is 117k to 118k.
7. Why 117k to 118k matters
On the liquidity heatmap there is clear resting liquidity higher up. Price often travels to those areas because that is where orders are.
The golden pocket of the previous move sits in this same zone. Many traders watch this fib area so reactions there are common.
Several AVWAP bands from earlier dates are meeting around 117k to 118k. When AVWAPs from different anchors cluster together it creates a stronger level because different groups of traders all care about that price.
Between the current price and that zone there are imbalances and LVNs. That means the market moved quickly there before and did not build volume. These thin areas often get filled on the next push.
8. How to read it in real time
Above 108k and spot CVD still rising means squeeze is on.
Above 108k and funding still negative means shorts are paying to stay wrong.
Lose 108k again after a sweep and see CVD roll over means scenario 1 is playing.
Price can just dump down without getting more liquidity. But looking unlikely based on the data right now.
So if Bitcoin can break and hold above 108k there is not much in the way until 117k to 118k.
Final view
We dumped on real flow.
We are recovering with spot support.
We have a clear first test at 107k to 108k.
Break and hold and the magnet becomes 117k to 118k because of liquidity, golden pocket, AVWAP confluence and imbalance.
TLDR;
Bitcoin sold off hard, but the data says the low was bought. Spot A/D started rising while price was still making new lows, funding turned negative and price reclaimed above the wick, which tells us real buyers stepped in while shorts stayed in their positions. Now price is climbing back toward 107k to 108k where a weak high and the April AVWAP are waiting, so that is the first place the market can decide if this recovery is just a bounce or the start of a squeeze. If buyers keep showing up there and we push through, the path above is thin and the next real pocket of liquidity, AVWAP confluence, imbalance and even the golden pocket of the earlier move all sit together around 117k to 118k. That is why this recovery matters. It is not just candles going up. It is positioning, spot flow and liquidity all lining up.
If you enjoy this type of analysis or find it helpful, leave a like or drop a comment. I don’t ask for anything in return — I share this to help traders understand what’s really happening behind the charts. It also helps me see if people actually read and value these breakdowns, so if it helped you, let me know below.

LINK LONG — FROM MATH TO MARKET STRUCTURE: An Extensive AnalysisTraders,
In my latest BINANCE:LINKUSDT analysis I started my thesis with " I BELIEVE THE CRYPTO MARKET IS SETTING UP FOR A BIG, BIG, BIG DUMP! NOT JUST LINK! "
It wasn’t coincidence that I wrote those words in caps lock. The market was whispering louder than usual: not in price, but in data. Every metric pulsed in rhythm, like the heartbeat of a system about to release its tension. The numbers weren’t random; they were poetry in motion, quietly syncing toward one inevitable point. Sometimes, data doesn’t just inform — it sings. And when it does, your fingertips start typing before your mind even realizes what the melody means.
Now we’re back — same chart, same logic, but a different side of the market.
I’m going to analyze it the same way I did before — step by step, math-backed, structure-based, and logic-driven.
Only this time, it’s even more extensive.
For free. For nothing. So that you, the people who actually care to learn, can start to see how markets truly work. How they breathe, trap, rotate, rebalance — and how every candle hides intent.
I believe the BINANCE:LINKUSDT dump might be over — for now, at least — and that the market is slowly starting to build upward momentum. This post is not a quick “looks bullish” statement. It’s a structured walkthrough from mathematical foundation to market structure, liquidity, and order flow, showing why the $20–$21 region might become the next key target before a rotation lower.
Let’s go step by step.
Step 1 – Is There a Mathematical Reason to Say the Current Auction Might Be Finished?
By “auction,” I mean the move from a clear swing high to a clear swing low where sellers were in control. Markets move in auctions — from high to low, then pull back, then extend again. To determine whether a sell auction is finished, we measure how far it has retraced and extended.
After the 10 Oct liquidation event, price printed a clean new high — more valid than the liquidation spike. That’s point A (~20.15). From there, it sold off to point B (~15.70).
So our first auction is:
A → B | Direction: Down
Step 2 – Measuring the Retrace
Since the move was downward, I drew a Fibonacci retracement from A to B (high → low). nThat gives us retracement levels above price on TradingView.
Price retraced almost perfectly to the 0.786 level (~19.23) — not shallow (0.382 or 0.5), not extreme (0.886), but deep enough to classify as a “normal” yet decisive retrace.
That means sellers regained control after a 0.786 pullback, a key ratio in the Fibonacci family.
Step 3 – What Does a 0.786 Retrace Usually Lead To?
Here’s where the Fibonacci logic becomes meaningful. The 0.786 level is derived from the square root of the golden ratio inverse: √(1/φ). Its natural mirror on the other side of price is √(φ), or 1.272.
That’s why 0.786 retraces often project toward 1.272 extensions — the two are mathematically linked. Beyond that, the next probable extensions are 1.414 and 1.618.
So, for a 0.786 retrace, the Fibonacci extension ladder is:
Primary: 1.272
Intermediate: 1.414
Extended: 1.618
Step 4 – Did BINANCE:LINKUSDT Reach One of These Fibonacci Targets?
To check that, we reverse the Fibonacci — draw it from B to A (low → high). That prints the extension levels below the swing low.
Price hit the 1.414 extension almost perfectly before structure began shifting:
Lower lows stopped forming
Higher lows began to appear
Small higher highs emerged on lower timeframes
That’s a structural sign the sellers exhausted their leg — a textbook confirmation that the 1.414 zone completed the auction.
Step 5 – Confirming the Auction
The A → B auction retraced to 0.786, extended to 1.414, and then reversed in structure. This matches the Fibonacci expectation for a completed wave.
If the retrace had been 0.886 instead, we’d likely expect continuation to 1.618 — but since it was 0.786, the 1.414 tap followed by reversal fits perfectly.
✅ 0.786 retrace → 1.272 / 1.414 / 1.618 extension
✅ 1.414 tapped → structure reversed
We can reasonably call this auction finished.
Step 6 – Confluence from the Smaller ABC Swing
After the main leg, the market made a small rally and a lower high — point C. Using the Fibonacci Extension tool (A → B → C), we project this smaller swing.
Interestingly, the ABC projection lands exactly on the same 1.414 zone as the larger A → B measurement. That’s two independent Fibonacci constructions converging on the same price.
From a math perspective, this isn’t coincidence — both patterns use the same ratio family.
It’s proportion — the geometry folding back onto itself.
Nature’s Geometry on a Price Chart
This is where Fibonacci goes beyond numbers. The same proportions that define growth patterns in seashells, tree branches, sunflowers, hurricanes, and galaxies are present in the market’s structure.
Two distinct swings produce the same 1.414 target.That’s natural proportion — mathematical harmony showing up in price behaviour.
It’s not random. It’s geometry repeating itself.
Part 2 – The Structural Context: Liquidity and Value
We’ve identified our Potential Reversal Zone (PRZ) using Fibonacci confluence. Now let’s look inside the structure and the market’s underlying “memory.”
We’ll answer three questions:
Where does liquidity sit — which levels might the market hunt next?
What is the order flow showing — is there absorption or continuation?
What do the next extensions project mathematically?
1. Liquidity via TPO (Market Profile)
TPO (Time Price Opportunity) shows how much time price spent at each level. Clusters = acceptance and value. Gaps = imbalance and rejection.
Around $19.00, during TPO periods G, H, N, and O, price built acceptance but didn’t explore higher. That created a weak high — a level that often acts as a magnet for future liquidity hunts.
Another, slightly weaker high sits near $20.00, which is still unfinished.
And as James Bond said, “I never leave loose ends.” Neither does the market.
2. Anchored VWAP Confluence
Anchoring VWAP from the major swing high shows the blue AVWAP aligning almost perfectly with that $20.00 region. That gives strong confluence between volume-weighted value, liquidity, and structure.
3. Low Volume Nodes (LVNs) and Imbalance
Using the Fixed Range Volume Profile (FRVP) from A → B reveals clear low-volume zones — “air pockets” where price moved too fast to build volume.
Between $20.00 and $20.50, there’s a notable LVN, meaning price skipped over it during the selloff.Such zones often act as magnets — the market tends to revisit them to rebalance unfinished business.
Now we have three layers of confluence:
Weak high at $19.00–$20.00
Anchored VWAP aligning with $20.00
LVN pocket at $20.00–$20.50
That defines a clear liquidity and target zone.
Structure and Confluence Summary
PRZ established through Fibonacci symmetry
Structure showing higher lows and early accumulation
Confluence cluster between $20.00 and $20.50, combining:
Weak highs
Low-volume node
Anchored VWAP
Market Profile imbalance
The setup aligns across math, volume, and structure.
Part 4 – Order Flow: What Lies Beneath the Candles
From the outside, price action looks calm — clean candles, defined Fibonacci levels, and structure that seems perfectly balanced. But the real story is hidden underneath, inside the Order Flow.
Every candle represents a battle — between aggression and absorption, buyers and sellers, liquidity and imbalance. Understanding who is winning that battle tells us whether a move is genuine strength or a trap waiting to unwind.
Order Flow allows us to look beneath the surface and see where transactions are actually happening — where volume clusters, where buyers are absorbed, and where sellers are defending. It’s the market’s heartbeat.
The Current Picture
Here’s what we see right now on BINANCE:LINKUSDT :
CVD (Cumulative Volume Delta) — across both spot and futures (stablecoin- and coin-margined contracts) — is making lower highs, showing persistent sell aggression.
Yet price itself is not breaking down. Instead, it’s holding steady and even forming higher lows.
Meanwhile, the A/D (Accumulation/Distribution) line is rising, indicating that despite heavy selling pressure, buyers continue to absorb and accumulate.
That means one thing:
aggressive sellers are being absorbed by large passive buyers quietly taking the other side.
Recognizing the Setup
Let’s break down the pattern:
CVD ↓ → sustained sell aggression
OI ↑ → new short positions entering the market
Price ↔ or ↑ slightly → absorption and accumulation taking place
When these three align:
It often signals a short trap forming.
Sellers feel in control because CVD shows selling dominance.
In reality, their aggression is being absorbed by larger passive buyers.
Once that liquidity runs out and buyers stop absorbing, shorts are trapped.
Those trapped shorts must cover — triggering a fast, aggressive short squeeze upward.
Also: CVD on Stablecoin Margined Contracts remains flat while Stablecoin Margined Open Interest rises — showing aggressive shorting being absorbed by larger buyers. Price stability suggests accumulation, not weakness. Since OI stays high, those shorts are still in the game, meaning their positions haven’t been closed yet. If price starts to move up, they’ll be forced to cover — setting up the conditions for a short squeeze.
Absorption in Context
Absorption isn’t random — it’s the footprint of strong hands quietly taking in sell pressure without letting price break down. While most see weakness, they’re actually witnessing controlled accumulation.
Here, price holds steady as CVD trends flat and OI stays high — meaning aggressive shorts are still in the game, being absorbed by larger buyers. Every new short adds fuel to the spring.
When that pressure releases, it doesn’t drift — it snaps. Shorts are forced to cover, triggering a sharp, emotional squeeze toward the next liquidity zone around $20–$20.50, where Fibonacci confluence and a weak high align.
This is where microstructure meets the macro picture — absorption building the base for a violent move higher.
Part 5 – Fibonacci Extension Confirmation
To justify the $20–$21 target mathematically, we apply one more Fibonacci extension —
from the last swing low to the recent high, projected forward.
The 1.618 extension aligns almost perfectly around $20.00, adding strong mathematical confluence to our previously defined liquidity and structure zone.
That makes $20.00–$20.50 a textbook target cluster — a Fibonacci, liquidity, and volume alignment.
Final Outlook – The Path Ahead
Based on all the combined data:
Fibonacci structure shows completion and new expansion potential
Market Profile and VWAP reveal unfinished business around $20–$20.50
Order Flow confirms absorption and hidden accumulation
The 1.618 Fibonacci projection reinforces this level as a natural mathematical destination
I believe the market will squeeze upward toward $20–$21, taking out the weak high and the LVN pocket — and once that liquidity is collected, rotate back down to restore balance.
The setup is mathematically justified, structurally valid, and order-flow supported — a complete picture of how Fibonacci geometry, structure, and liquidity align to reveal where the next phase of this auction may unfold.
If price slips lower instead, the key level to watch is $12.90 — the latest 1.618 extension from the initial wave we measured earlier. That remains the deep liquidity and structural boundary where balance could be restored.
Last words.
Everything we have mapped — Fibonacci structure, confluence, liquidity, and absorption — means nothing without the psychology behind it. The market is not just math and candles; it is a mirror of collective emotion. Every trapped short, every breakout chase, every hesitation is human behaviour written in numbers.
When confidence is at its peak, risk is usually greatest.
When fear dominates, opportunity hides in plain sight.
That is why sentiment often reaches its extreme just before reversals. Most traders only see what is already visible, not what is quietly building beneath the surface.
So next time you scroll through social media or read the news about what everyone expects, remind yourself of this:
When everyone sees the same breakout, the trade was over hours ago.
And the markets whisper long before they speak.
From the depths of the sands,
ThetaNomad
------------------------------------
If you enjoy this kind of analysis, leave a like and drop a comment. I don’t ask for anything — I just want to help more people learn to look behind the charts, to see the story that price and volume quietly write together.

A SetupWhat qualifies as an A+ setup (Big Three)
Compression: A valid Big Three squeeze on your chosen timeframe.
Signal: Big Three Buy Signal present.
Trend filter: Price above the moving averages.
Multi-timeframe game plan
Anchor (bigger picture): Daily / 3-day squeezes to define backdrop & runway.
Trigger (trade timeframe): 2-Hour (or 30-min/15-min/5-min) A+ squeezes for entries.
Bias maintenance: Hold only while the price stays above the trailing stop and the structure stays bullish.
Pre-flight checklist (grade it fast)
Squeeze present on your entry timeframe (2h / 30m / 15m / 5m).
EMA stacked in order (no exceptions for A+).
Trend/structure: Uptrend or at least neutral turning up.
Bigger picture alignment: Daily / 3-day not fighting you; momentum not deeply negative.
Nearby “fuel” (levels): Key MAs (e.g., daily 50), pre-break accumulation, gamma call walls, and recent highs.
Entry & management (simple and consistent)
Entry trigger options
First break out of the squeeze range with structure and signal intact.
Or pullback-to-hold above trailing stop/MA inside the squeeze; buy the next higher low → higher high sequence.
Initial risk
Stop: just below the trailing stop or last pivot low inside the squeeze.
Positioning: size so a stop hit ≈ 0.5R of daily risk (or less).
Profit taking
Tier 1: prior swing high / measured move from squeeze range.
Tier 2: roadmap targets (recent highs, round numbers, and gamma walls).
Trail partial with trailing stop; roll or trim if momentum cools.
What cancels A+ mid-trade
Lose the buy signal and close below the trailing stop, 8 EMA.
Momentum rollover on your entry TF while higher TFs aren’t supportive.
Repeated failed reclaims of the squeeze top.
Plan
A+ vs “Almost A+” (how to decide)
A+ now = All four: Squeeze + Buy Signal + Above trailing stop.
Almost A+. Missing momentum.
Action: Stalk on lower TFs (5m/15m) for earlier entries, but only size up when the main TF prints full A+.
Execution guardrails (to keep your edge)
Don’t force entries before the squeeze/score/signal align—let it become A+.
If you take a starter on a lower TF, earn the add-on higher-TF confirmation.
Respect gaps: lock tiers into gap pushes from active squeezes.
Keep a daily max loss; after 2R down or 2 invalid setups, flatten and reset.
Screener:
www.tradingview.com
BITCOIN – LONG - 105K SWEEP BEFORE WE LEAPTraders,
In my latest analysis I said that Bitcoin will reach 117.000-117.500 before a bigger dump. Price didn't reach those levels yet, and dumped instantly instead.
However, the main thesis still stands: price is likely to reach that zone (117.000-117.500) before a larger reversal down. But before that, I expect a short squeeze beginning at $105.000.
Why I Expect a Squeeze
During the Asia session, new leveraged short exposure was built. Open Interest (OI) increased while Net Shorts rose, showing that traders were adding fresh short positions.
Around 107,000–107,500, both Spot CVD and Coin-Margined CVD are showing bullish divergence. Sellers are active, but price is holding, which indicates absorption.
Stablecoin-Margined CVD in the same range shows exhaustion, suggesting selling pressure is fading.
At New York open, OI continued to rise together with Net Longs, meaning aggressive longs are now fading into the short exposure created during Asia.
What This Means
Historically, the London and New York sessions tend to sweep Asia’s positioning. When Asia builds short exposure, the later sessions often push price higher to liquidate those shorts. This often results in a short squeeze, which aligns with what we may be seeing now.
Determining the Next Move Down
Before deciding if price extends lower first, we must identify the variables of probability (VOP) — the “magnets” that increase the likelihood of a lower sweep.
1. Weak Thursday Low
There is a weak low that has not been properly tested. In TPO (Time Price Opportunity) terms, a weak low forms when price finds temporary support without strong buying response. Such levels often get revisited.
2. Unswept Sunday 19 Oct Low
There is also an unswept Sunday low from 19 October. Sunday lows are often swept because weekend liquidity is thin and order books are shallow. When liquidity returns during the week, those inefficient areas tend to get filled.
Imbalances and Volume Gaps Below
Next we look for gaps, imbalances, or LVNs (Low Volume Nodes) — areas where trading activity was limited or one-sided. These zones often attract price because markets seek balance.
Many traders identify “fair value gaps” by looking at candles, but that only shows part of the picture. To locate the real inefficiency, we need to look inside the candles using order flow or a Fixed Range Volume Profile (FRVP) to find the exact levels of bid-ask imbalance.
Volume Profile and Fibonacci Confluence
Drawing the Fixed Range Volume Profile from the impulse move below the Sunday 19 Oct low shows a clear imbalance at 105,070.
Checking confluences:
The 0.786 Fibonacci retracement (low to high) aligns exactly with 105,070
The 0.886 retracement (higher low to high) also aligns exactly with 105,070
Fibonacci extensions (1.113 and 1.272) both target around 105,000
The 0.618 extension also lands near 105,000
Thesis Summary
Based on all data and confluence:
Price likely dips to sweep the weak 30 Oct low and the 19 Oct Sunday low
Target zone: LVN / imbalance near 105,000
Expect a liquidity grab that traps late shorts and shakes out weak longs
After that, expect a reversal toward 117,000–117,500, where the next major liquidity pool lies
Why a Lower Sweep Is Expected
The Asia session built significant short exposure
There is an inefficiency and low-volume magnet around 105k
Weak lows provide clear liquidity targets
Once those areas are cleared, market structure favors a strong reversal upward
In summary:
Bitcoin is likely to make one more sweep toward the 105,000 zone to clear liquidity before expanding upward into the 117,000–117,500 area, where a larger reversal setup is likely to form. Of course, price can always move up or down without perfectly respecting these levels — the market does not owe us precision. These levels simply represent the highest-probability areas based on current data and confluence.

SOLANA - SHORT - THE WICK AND THE WHISPERTraders,
This is how I see SOL.
1. The level I care about
For me the key area is 205 to 207. Call it VAH, call it range high, call it supply. It is the place where price got stuffed before and where a lot of trapped memory lives.
What I expect is simple.
Wick it. Slip it. Fade it.
In other words I am looking for SOL to run into that 205 to 207 pocket, spike through it, clean the liquidity resting above those highs, and then fail to hold. That failure after the wick is the trigger for me. That is where I want to be heavy.
If SOL trades above that range high and then instantly falls back inside, that is a swing fail pattern at the high of the range. That is the same story I am hunting on BTC at 117.5k. Liquidity first, conviction second.
2. The downside path
If the wick and slip happens, my downside path is not small. My next meaningful target sits all the way down at 150 to 155. That zone is not just a guess.
It is where the last real demand block sat before we impulsed higher.
It is also where liquidity was never fully re balanced after the violent breakout.
Call it unfinished business. Call it imbalance that still needs to close.
The market eventually comes back to drink from the well it skipped.
3. Now we look under the hood
Price has pushed up into 200 again, yes. But the flow behind the move tells a different story than the candles.
Spot CVD
Spot CVD is bleeding down hard. Real buyers paying cash are not supporting this move. Spot is distributing into strength, not accumulating under it.
Stablecoin margined CVD
Stablecoin perp flow is also down. That means most of the USDT perp side is either taking profit into this move or outright selling into it. They are not chasing it. They are leaning against it.
Coin margined CVD
This is the biggest one. Coin margined CVD is aggressively down. That tells me coin collateral traders are smashing into the bid, basically leaning short into this push.
So ask yourself. If spot is selling, and perp flow is selling, and coin margined flow is selling, then why is SOL still pressing up
4. Open Interest is the answer
Stablecoin OI is grinding up.
Coin margined OI is going vertical.
That means positions are being added at the top, not closed. New size is entering into this level.
When coin margined OI spikes like that while coin margined CVD is negative, the usual read is this. People are opening fresh short exposure using SOL itself as collateral, hitting the bid all the way up, and still not getting the breakdown.
They are trying to fade the move. The move refuses to die. That is short fuel.
This is why SOL can still squeeze into 205 to 207. Shorts are stepping in early, and if you squeeze them one more time you get the wick.
But here is the catch. After the wick and slip, once that last round of shorts is blown and once fresh late longs FOMO in above VAH, there is nothing under price.
Spot buyers did not build a floor.
Perps did not build a floor.
The whole thing is hollow.
That is how you get air pockets.
5. How I am trading this
I am not here to wave a bull flag or scream bear. I am not interested in labels.
I am here to execute around the level.
My plan is to stalk shorts on a failed breakout of that 205 to 207 key. I do not need to nail the exact top tick. I want to see the wick into VAH, and then the rejection back inside the range. That is my trigger to build size.
Will I hold it all the way to 150 No blind loyalty. But that is where I believe the next true re balance sits, and that is the map I am working with.
If SOL breaks through 207, accepts above, and starts building structure above VAH, then this idea is invalid. I step aside. No ego. Survival first.
6. Summary
SOL is approaching a thin ceiling where liquidity sits. I believe we get a final run of that high near 205 to 207, a wick and slip, and then rotation lower. The flow supports that view.
Spot is not bidding.
Perps are selling into the move.
Open Interest is exploding at the highs.
That is the recipe for a squeeze candle into resistance, followed by a rug.
My destination if this plays out is 150 to 155, the next pool of imbalance where the market still owes a visit.
The chart is loud, but the flow is louder.
The candles brag.
The data whispers.
I listen to the whisper.

BITCOIN – THE LAST DANCE AT THE BORDER OF DEATHTraders,
I believe Bitcoin is potentially setting up for a swing fail pattern around 117.500.
A swing fail pattern, very simply, is when price runs the previous high, takes out the liquidity sitting above it, and then fails to hold above that level. In other words, it clears the stops, shows strength for a moment, and then turns. It is the market taking a breath before it bites.
Here is how I see it and why I am positioned for shorts, not longs.
1. Structure into 117.500
The zone around 117.000 to 117.500 is, for me, the kill zone.
Why?
There is a clean previous high that has not been taken yet
There is visible imbalance from the last fast drop sitting in that band
We have London morning wick liquidity above us that I believe price still wants to clean
The math and harmonics I am running line up in the same area
When I say the math lines up I am talking about measured extensions and harmonics off the leg that started around 103k to 104k and impulsed higher. My 1.618 extension clusters around 116.7 to 117.5. The 1.272 and 1.414 levels already got respected on the way up. This last one is usually where you get the overextension and the last grab. On top of this, the 1.618 extension confluences with the HTF Golden Pocket.
We also sit right on top of what I call the border of death. Above 117.500 I do not want to see Bitcoin hold. If it does hold and build acceptance up there then this entire idea is invalidated and I will adapt. I am not married to bias. I am married to data.
2. Order flow and participation
Let us talk about what is behind this move, not just what it looks like.
Spot CVD is still depressed compared to the beginning of the run. That means real buyers paying cash are not the ones driving price higher. This is not a classic spot accumulation bid. This is not strong hands owning the level.
Stablecoin margined CVD and coin margined CVD both curled up into the most recent leg. So who is lifting price It is perps. Not investors, not patient buyers, just leverage.
Open Interest is also telling us a story.
Stablecoin margined OI is grinding back up into the highs.
Coin margined OI is starting to climb again.
That means people are adding new exposure on the way up. They are not just covering shorts anymore, they are now chasing longs into the high. This is where positioning gets fragile. The crowd thinks we are going to keep going. I start thinking about harvesting that belief.
The floor under us is not built by conviction. It is built by leverage.
We have seen this before. The desert looks quiet before the sandstorm picks up.
3. What I am expecting
I am expecting a sweep of the high into roughly 117.500.
Clean the liquidity. Fill the imbalance. Tap the last little pocket of inefficiency that is still sitting there. Show strength on the surface.
Then reject.
That rejection is the tell for me. If we push above the high and then snap back below it on force, that confirms the swing fail for me.
From there I am looking for rotation much lower.
4. The target zone if this plays out
If this plays out the way I think it can, I am looking toward 98k.
This is not a random number. That is basically the next meaningful pocket of imbalance below. That is the next unfair area that never got re tested. Price likes to rebalance. The market eventually revisits the places it skipped when it was moving too fast. We call it inefficiency but it is really just unfinished business.
Will it instantly teleport there No. This is a path idea, not a straight line prediction. But 98k is where I think equilibrium lives if this whole run unwinds.
5. Risk management and positioning
Because of this view I have adjusted.
My earlier thesis from October 16 is, in my eyes, no longer valid in its original form. Never say never, but I am not trading that idea anymore.
I have closed all long positions. I am no longer here to squeeze the upside. I am here to stalk shorts.
Does that mean I am instantly full size short here No.
I am not interested in guessing tops. I am interested in letting the market reach for the level I want, and only then taking the trade with data behind it.
If Bitcoin breaks through 117.500 and starts holding acceptance above that level, I will back off this idea. No ego. No stubbornness. I am here to survive. Survival is the only way you ever get to mastery.
6. Summary
I believe Bitcoin is setting up for a classic swing fail pattern at around 117.500. I think price will hunt that liquidity, stop out shorts, convince late longs they are right, and then turn. I think the next meaningful re balance sits much lower, around 98k.
This is not guaranteed. Nothing in trading is guaranteed. Trading is probability, not fantasy.
But right now the flow, the harmonics, the imbalance, the extensions, and the psychology of the crowd all rhyme in the same place.
And when the market whispers in the same tone across different tools, I listen. I am ThetaNomad.

$SOL - LONG - ABOUT TO POP?Analysis:
Following up on my Oct 14th BTC note — “Wait for arbitrage to balance spot markets” — we’re now nearing that blue box. As BTC approaches equilibrium, I’m eyeing CRYPTOCAP:SOL for a clean long setup.
Here’s why 👇
AVWAP Confluence Zone:
We’ve got the lower band of a HTF auction colliding with the VWAP line from another HTF auction — strong mean reversion and liquidity overlap. (Didn’t draw them out to keep the chart clean.)
Fibonacci Confluence:
A completed AB=CD right at 175.0, perfectly inside the HTF golden pocket (0.618). That’s a key structural retrace aligning with measured move completion.
Bullish Harmonic (4H):
A textbook bull harmonic forming — early signs of reversal pressure building.
No position yet. Waiting for SOL (CME) to close the gap at ~174.7 — that’s my trigger to go long.
🎯 Target: 223 — with a possible sweep of the 229–230 zone where shorts are stacked. Expecting a short squeeze flush through that region.
Seeing solid order flow confluence across the board.
Will update this post as things unfold.

BITCOIN - PUMP BEFORE THE DUMP?Traders,
Last time I talked about arbitrage inefficiencies between spot and perps. I expected a dip first, then a corrective move up. That view still stands — but I also expected a sweep up before the bigger move down.
In my earlier notes I called for a sweep to clean the Sunday low, followed by a move back toward 120–122k with a short squeeze.
That scenario is now in play.
I planned to long near 109.350, after the sweep, and only if the data aligned with my thesis.
What I projected vs what happened
Sweep the Sunday lows, then squeeze up.
Wait for the sweep and only enter if the data confirms around 109.550. Entered 109.550 once multiple signals lined up.
Why I entered at 109.550
Stablecoin-margined CVD
First pass: Stablecoin Margined CVD made a lower low while price made a higher low → hidden bullish divergence. Aggressive sellers were getting absorbed by resting bids.
Second pass: Stablecoin Margined CVD made a higher low while price made a lower low → selling pressure fading, buyers absorbing again.
Coin-margined CVD
Coin Margined CVD kept making lower lows while price refused to follow → another hidden bull div. Shorts were leaning in, but passive buying held firm.
Spot CVD
Lower lows on CVD while price held flat or slightly higher → trapped aggressive sellers, absorbed by steady passive spot buyers.
On Binance Perp Order Flow we could also see a regular bullish divergence into a smaller hidden bull div at the sweep — a clean reversal setup.
Open Interest read
Here’s where many traders miss the nuance. There are two main perp types on Binance and most major exchanges:
Coin-margined contracts: collateralized with the underlying asset (e.g., BTC). Profits and losses are settled in BTC. Stablecoin-margined contracts: collateralized with a stable asset (e.g., USDT or USDC). Profits and losses are settled in dollars.
This matters because the behavior and risk exposure of traders differ between the two:
When coin-margined OI goes down, it usually means BTC-collateral traders are closing positions or getting liquidated. They’re forced to sell BTC to cover margin, which can create short-term downside pressure.
When stablecoin-margined OI goes up at the same time, it often means new traders are entering positions with USDT collateral. That capital rotation usually signals fresh directional bets, often late shorts piling in after a move down.
So when price stops making new lows while stablecoin OI keeps climbing, it’s a clear sign the market is loading up on shorts, but without continuation. That mismatch is short-squeeze fuel. Combine that with the CVD divergences above and it paints a strong case for a move back into overhead liquidity.
Supplementary edge
1H RSI bullish divergence: RSI makes higher lows while price makes lower lows → loss of downside momentum, suggesting sellers are tiring.
USDC.D and USDT.D bearish divergences: Stablecoin dominance charts make higher highs while RSI trends lower → stablecoin demand weakening. When that happens, capital tends to rotate back into BTC and risk assets, reinforcing the long bias.
Broke above daily VWAP
Together, these add extra confluence to the squeeze setup.
Plan, target, invalidation
Target: 122 area (blue box).
At target: watching for rising price with fading delta, sell imbalances near highs, and absorption signals — that’s where I’ll start hunting shorts and let the market cool off. Invalidation: acceptance back below the Sunday sweep low with expanding negative delta and rising OI on the breakdown. That would kill the squeeze thesis.
Summary:
A clean sweep → multi-CVD bullish divergences → absorption → rising OI imbalance → RSI & VWAP confluence. All aligning for a controlled short squeeze toward 122k, before the market potentially resumes its broader corrective path.
Does this mean we 100% go up? No. Markets don’t promise: they whisper. You listen, you align, and you risk what you can afford to be wrong about.

BITCOIN – WAIT FOR ARBITRAGE TO BALANCE SPOT MARKETSTraders,
What a week it’s been. A lot of people got rekt, and I hope you were on the right side of the move. If not, it’s fine: this is how markets reset. I’ve been getting a lot of questions about what comes next, so here’s my current view.
The Situation
Binance/USDT wicked down to 102,000
Binance/USD wicked to 107,485.59
Coinbase/USD wicked to 107,000
That’s roughly a $5,000 difference, or about 5%, which is huge for major spot markets.
Under normal conditions, spreads between top venues like Coinbase and Binance are usually below 1% (Bitwise, 2019 SEC Study on Real Bitcoin Trading Volume - for the nerds interested ;)).
Why It Matters
Both Binance and Coinbase printed round-number lows (102k and 107k).
Round-number lows are considered “bad lows” because they attract clustered stop-loss orders and create obvious liquidity pools underneath.
Studies on market microstructure (e.g., Osler 2003; Kamps & Klein 2018) confirm that price clustering at round numbers is a real behavioral bias in FX and crypto markets.
Real market bottoms are messy, chaotic, and rarely form at clean, even levels.
These “perfect” lows often get revisited or swept later as the market clears liquidity and finds true balance.
How the Flush Works in Spot Markets
Even though spot markets don’t have leverage liquidations, they still experience stop cascades and panic selling.
When price breaks below a clean low, it triggers stops, sending a surge of sell orders into thin liquidity.
Market makers step in to absorb those orders and rebuild liquidity from a more stable base.
This is what traders call a spot flush — the market removing weak hands and resetting liquidity.
Conceptually, it’s the same as a liquidation flush in futures, just without forced margin calls.
What Arbitrage Does
Arbitrage keeps prices between exchanges in check.
When Bitcoin trades cheaper on Binance than on Coinbase, arbitrage traders buy on Binance and sell on Coinbase.
This pushes the cheap venue’s price up and the expensive one down until they align.
Makarov & Schoar (2020, NBER) showed that cross-exchange price deviations in Bitcoin are temporary and mean-reverting, driven by arbitrage capital restoring equilibrium.
Kaiko research (2021–2023) also found that USD and USDT pairs often decouple during stress events, especially when stablecoin liquidity or banking rails get disrupted, and later realign once volatility settles.
That’s exactly what we’re seeing now: a temporary dislocation that arbitrage will eventually close.
What I Expect
Binance already swept liquidity down to 102k.
Coinbase still has a clean 107k low that hasn’t been tested.
To rebalance both exchanges, I expect Coinbase to trade within 1% of the Binance 102k low, meaning roughly 103k–104k.
That would bring both markets back into alignment and complete a proper spot flush.
This isn’t a guaranteed move, but it’s a logical rebalancing target supported by historical arbitrage behavior.
What Could Happen Before That
We could still see Bitcoin move back toward 118k–120k before a potential drop.
After major liquidation events, markets often retrace sharply as liquidity rebuilds and shorts get squeezed.
A move higher doesn’t invalidate the idea of a later sweep; it could just be part of the natural reset phase before the market finds true equilibrium.
What I’m Watching
The spread between Coinbase/USD and Binance/USDT narrowing from around 5% to about 1%.
Coinbase breaking below 107k and testing the 104–102k zone.
A liquidity sweep followed by a strong reclaim and visible buy volume.
If we move up first, I’ll watch price behavior around 118k–120k for signs of exhaustion.
My Plan (Not Financial Advice)
I’m staying patient and letting the market mechanics reset.
If Coinbase trades into the 103k–102k zone, that’s my “let’s see what’s going on now” trigger.
That doesn’t mean I’ll instantly go long — it means I’ll start watching the data:
Volume and delta (are buyers stepping in?)
Strength of reclaim (is the recovery fast and decisive?)
Order book depth (is liquidity returning?)
What is Open Interest doing?
Do we see absorption? Or maybe a continuation pattern even?
Only if those metrics confirm strength will I consider entering.If not, I’ll stay flat and wait for the next confirmation.
So, TLDR;
Both Binance and Coinbase printed clean, round-number lows that are likely to be swept again. Arbitrage will eventually bring the spot markets back into balance, which should pull Coinbase closer to Binance’s 102k low. We might even see a push toward 120k first as liquidity resets. Either way, patience is key: let arbitrage, liquidity, and order flow do their job before taking any position.
And remember: Patience in trading isn’t about doing nothing, it’s about waiting for the odds to align in your favor. Chasing every move might feed the ego, but patience compounds the account. The market always rewards the trader who can sit still when everyone else is reacting.
Trade safe!

$LINK – PREPARING FOR A BIG DUMP – SQUEEZE TRAIN LOADING Traders,
I BELIEVE THE CRYPTO MARKET IS SETTING UP FOR A BIG, BIG, BIG DUMP!, NOT JUST LINK!
Last time, we nailed the BIST:LINK short from $24.55 — it hit Target 1 and Target 2 (the two boxes below) pixel perfect.
From $20.00 we expected a retrace back up toward the $23.00 region, before a potential dump to $17.00.
That scenario may now be unfolding.
Let’s break it down:
CVD & Market Participation – Bearish Divergence Building
Aggregated CVD Spot → still relatively flat → tells us there’s no real spot demand or accumulation. Spot buyers are not fueling this push.
Aggregated CVD Futures (Stablecoin-margined) → moving aggressively higher → lots of leveraged traders chasing the move up.
Aggregated CVD Futures (Coin-margined) → also moving aggressively higher → even riskier longs, since collateral is crypto itself (double downside risk if LINK sells off).
👉 Why this is a bearish divergence:
Price is being pushed higher only by aggressive leveraged longs, while spot (the foundation of demand) is not confirming. This creates a fragile rally that can easily unwind into a long squeeze.
Order Flow – Signs of Absorption
On Binance & Bybit perps, we see aggressive buyers stepping in (CVD making higher highs).
But price is not moving higher accordingly.
This is a classic absorption signal: passive limit sellers are absorbing the buying pressure, preparing for reversal.
Market Context – Entering the PRZ ($23–24)
HTF VAL (Value Area Low) at this region.
LTF VAL aligns perfectly here too.
Single Prints (TPO profile) → thinly traded zones where price moved quickly in the past, often acting as magnets and reversal points.
Imbalances stacking at these levels, showing inefficiency that can flip.
AVWAP Confluence → multiple anchored VWAPs cluster in this zone, creating strong resistance.
All of this builds a confluence-heavy Potential Reversal Zone (PRZ) at $23–24.
My Take
We are entering a Reversal Zone packed with:
No real spot demand,
Leveraged longs chasing,
Absorption in order flow,
Strong technical confluence (VALs, TPO singles, Imbalances, AVWAP).
⚠️ This is the perfect fuel for a long squeeze dump back toward $17.00.
Trade safe, manage risk. Adios 🚀🔪
