Stellar (XLM): Proper Break of Structure (BoS) | Bullish We had a clean breakout on the XLM coin where the price did form the Break of Structure, and now we are aiming for that resistance zone near $0.50.
Even that zone is not the final stop for us; we look for that major target zone (which is major resistance on a bigger timeframe) to be reached!
Swallow Academy
STELLAR

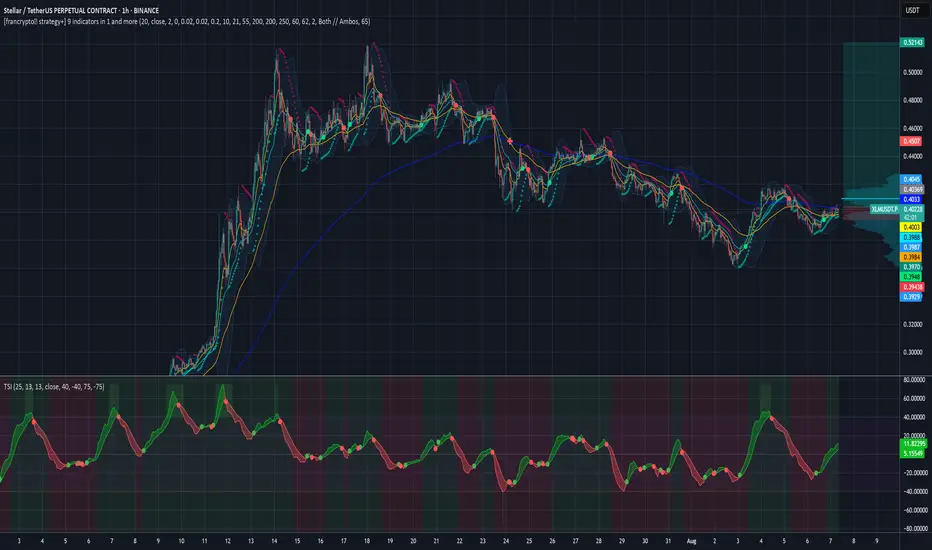
Bullish on XLMUSDTStellar / XLM turns bullish again, retracement is over. We have an EMA cross, we have passed an high volume node and now we try to move above EMA200. As soon as we manage to stay above we will head for the targets around 0.46$ and 0.52$.
For more trade ideas check and insights check our profile.
Disclamer: only entertaining purpose, no financial advice - trading is risky.
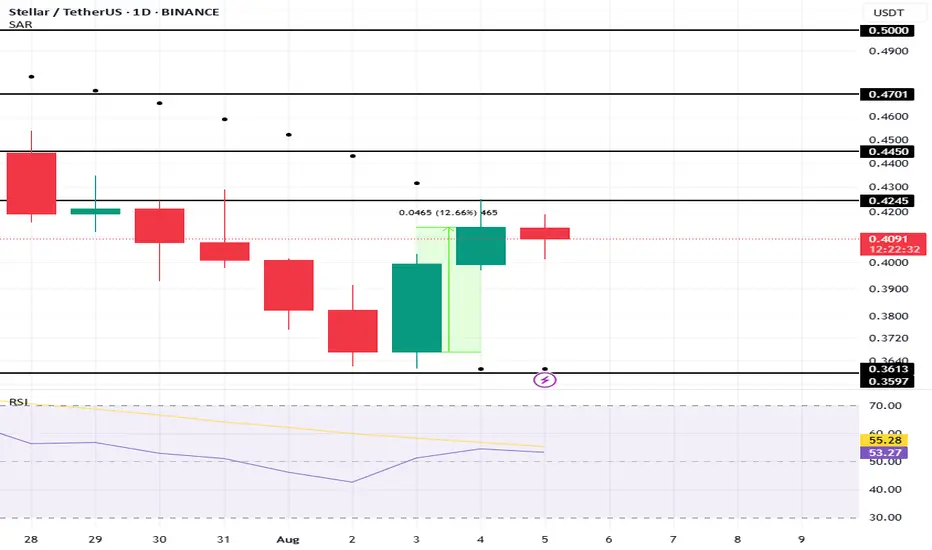
Stellar (XML) Price Ends 2-Week Downtrend As Inflows SpikeBINANCE:XLMUSDT price is currently trading at $0.41 1, just under the resistance level of $0.424. Breaking this resistance will be key for XLM to recover the recent losses and continue its upward trajectory. The Parabolic SAR moving below the candlesticks after two weeks signals that the downtrend is coming to an end.
Ethereum’s technical indicators also suggest a return to bullish momentum. The Relative Strength Index (RSI) has moved back into the positive zone, above the neutral 50.0 mark, after briefly dipping into bearish territory. This reversal from the prior downtrend shows that BINANCE:XLMUSDT is regaining strength.
The RSI indicates that investor sentiment is improving . The brief period of bearishness was likely caused by broader market uncertainty and skepticism. However, with the RSI back in the positive range, the likelihood of further price increases has increased.
If Stellar can flip $0.424 into support , it could pave the way for a rise past $0.445 and possibly reach $0.470 . This would allow BINANCE:XLMUSDT to recover a significant portion of the losses it sustained over the past two weeks and continue its uptrend.
However, if broader market conditions fail to remain bullish and investor sentiment turns negative, BINANCE:XLMUSDT could face a decline. A failure to maintain support at $0.424 could lead XLM to drop to $0.393 , with further bearish momentum pushing the price to $0.359, invalidating the bullish outlook.
Stellar (XLM) Shoot Up 11%, Aims To Cross This Barrier
BINANCE:XLMUSDT price has increased by 11% over the last 24 hours , positioning it among the top-performing altcoins. Trading at $0.4077 , the altcoin remains under the resistance of $0.4245. This indicates potential for a breakout if broader market conditions stay favorable and support the bullish trend.
The 50-day exponential moving average (EMA) provides strong support, signaling that the broader market momentum is bullish. This support could propel BINANCE:XLMUSDT towards $0.4450 , with further gains potentially pushing it to $0.4701, confirming the continuation of its positive trajectory in the market if conditions remain favorable.
However, if market conditions worsen , especially with the upcoming August 7 announcements, XLM might fail to breach $0.4245 . In this case, the price could fall to $0.3597 , and losing this support would invalidate the bullish outlook for BINANCE:XLMUSDT , signaling potential downside risks in the coming days.

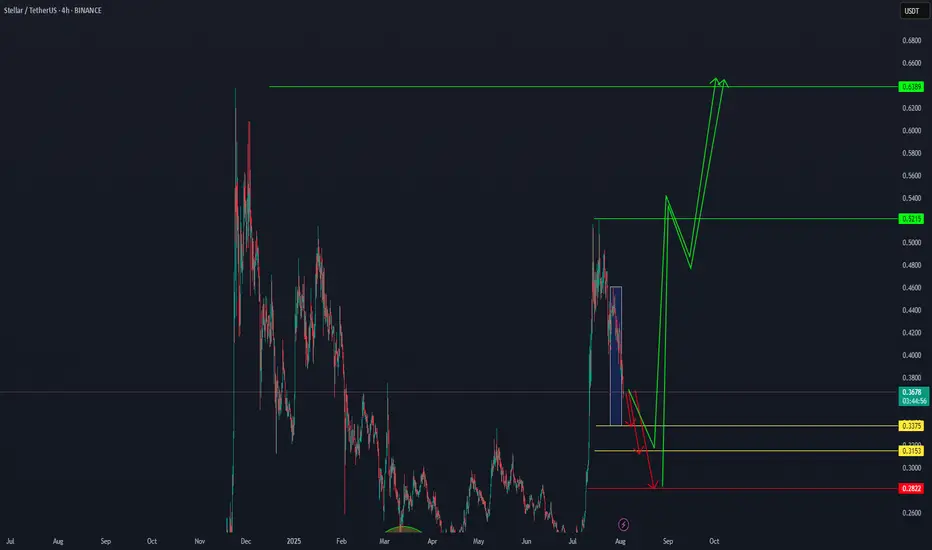
"Stellar XLM will definitely reach 0.6389."" Stellar (XLM) is expected to begin its upward move from the price zones of 0.3375, 0.3153, and 0.2822, heading toward the confirmed targets of 0.5215 and then 0.6389.
While the exact starting point may vary slightly, the targets at 0.5215 and 0.6389 are considered certain." BINANCE:XRPUSDT
XLM To $0.74I'm looking for XLM to continue to the downside followed by a move up. I will place a buy at the 50% fib level or in between the 50% and 61.8.

STELLAR LUMENS - DOLLAR COST AVERAGE FOR LONG TERM GAINSSTELLAR LUMENS (XLM) has taken off late 2024 from under .10 cents and now trading at .40 cents for a 400% Gain in 6 months so far, and there is much more upside to come potentially. It hit all time highs around .50 cents and now the token seems to want to test those highs in the near term 2025, we can easily see XLM approach $1.00 towards 2026 for a 100% gain and even higher longer term. Overall, XLM moves with XRP and we all know XRP is a blue chip project, it has all the funds and institutional backing, and so does XLM.
Both projects share a common creator in Jed McCaleb, however they have different focuses. Ripple, and its native token XRP, was initially designed to facilitate cross-border payments for financial institutions. Stellar, on the other hand, focuses on financial inclusion and aims to provide accessible financial services for individuals, including remittances and access to banking services.
CAN WE SAY BULLISH?! TO THE MOON!!!
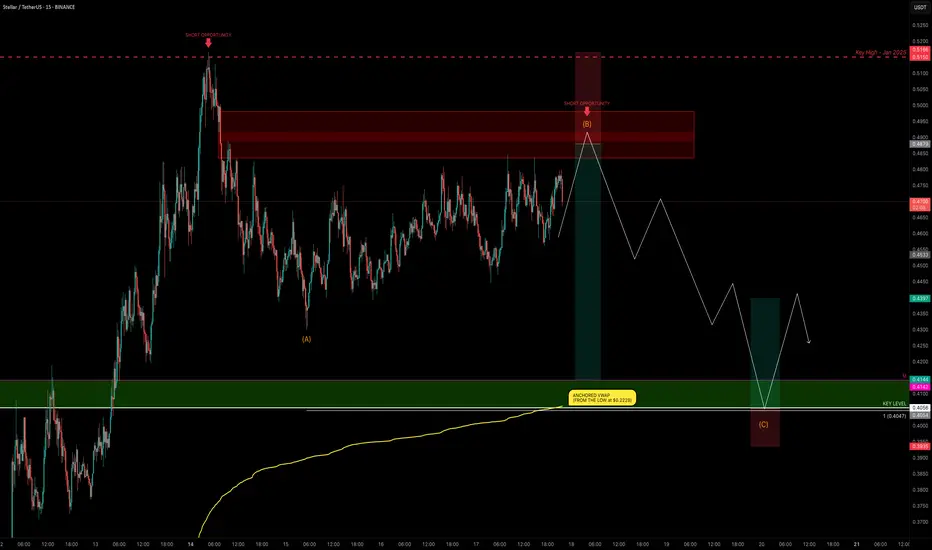
XLM Explodes +132% — Is the Party Over or Just Starting?XLM has been one of the top movers, sweeping the January 2025 swing high at $0.515 before stalling and moving sideways for the past 4 days.
Is XLM gearing up for another push toward the highs, or is a correction imminent?
Let’s dive into the details.
🧩 Market Structure & Fractal Pattern
XLM skyrocketed +132% in just 13 days, mirroring the explosive move seen back in November 2024.
If we apply the November fractal, the current price action suggests we could be setting up for an ABC corrective move.
📉 Key Levels & Confluences
FVG Zone: ~$0.49–$0.50 — likely to be swept before any major move down.
Monthly Support: $0.4142
Key Level / Liquidity Pool: $0.4056 — likely cluster of stop-losses.
Anchored VWAP (from $0.2228 start of trend): currently near $0.4056, adding strong confluence.
1.0 Trend-Based Fib Extension (ABC projection): If price pushes to ~$0.49 to complete wave B, the projected 1.0 TBFE for wave C lands right on the $0.4056 key level + VWAP, creating a perfect confluence zone.
➡️ Conclusion: The $0.4142–$0.4056 zone is a critical support and liquidity area with multiple confluences lining up.
Trade Setups
🔴 Short Setup:
Entry zone: $0.48–$0.50 (ladder in)
Stop-loss: Above $0.5166 (prior high)
Take-profit: $0.4142–$0.4056 zone
R:R ≈ 1:3
🟢 Long Setup:
Entry zone: $0.4142–$0.4056 (preferably near VWAP)
Stop-loss: Below $0.395
Take-profit: $0.44
⚡ Final Thoughts
Watch for a potential final push toward $0.49–$0.50 before a corrective wave unfolds.
The confluence at the $0.4142–$0.4056 zone — including monthly/weekly levels, VWAP, liquidity pool, and the 1.0 TBFE target — makes it a key area for decision-making.
Stay patient and wait for confirmation at these levels. Will post an update as things unfold!
_________________________________
💬 If you found this helpful, drop a like and comment!
Want breakdowns of other charts? Leave your requests below.
Stellar Sitting Mid-Range — Patience Before the Pop?XLM has been stuck in a defined range, with both the top and bottom holding multiple times. Stoch RSI is resetting, and price is nearing the midpoint again. Breakouts from ranges like this often come when traders get bored — stay alert.

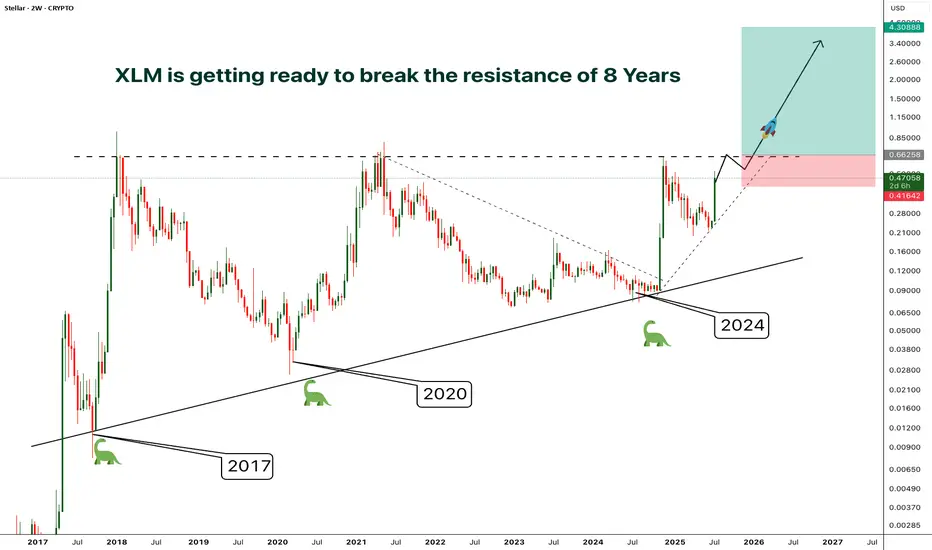
XLM - Resistance/Consolidation of 8 Years- Finally after 8 years of consolidation and getting rejected by the resistance at the same level around 0.65, XLM is preparing to break out from the almost decade old resistance
- A clear breakout from this resistance will phenomenal
- The price surge after the breakout will be unlike anything you've ever seen.
- I'm planning to enter after a confirmed breakout, entry before the breakout will be risky in case if the price gets rejected again.
Entry Price: Candle closeAbove 0.65
Stop Loss: Below 0.41
TP1: 0.88574
TP2: 1.21012
TP3: 1.92545
TP4: 2.68849
TP5: 4.27772
Don't forget to keep stoploss
Cheers
GreenCrypto
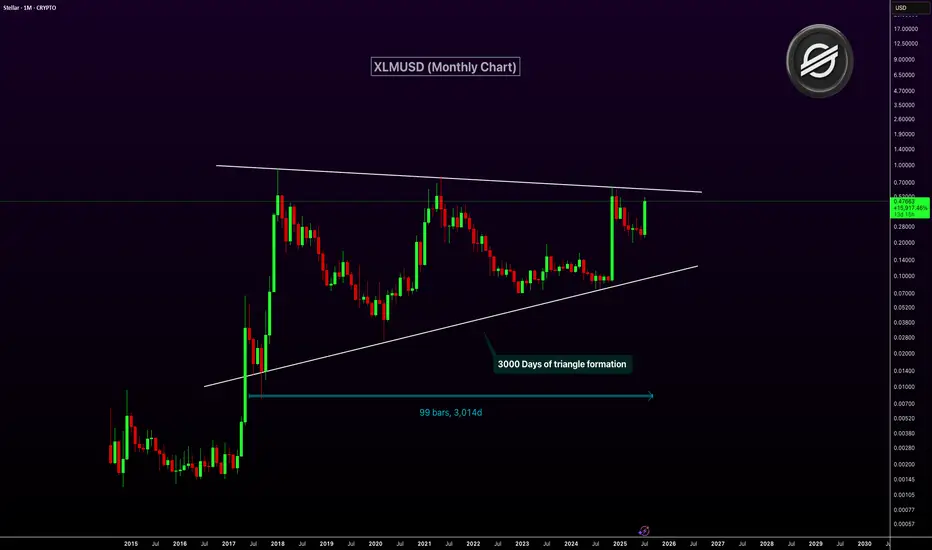
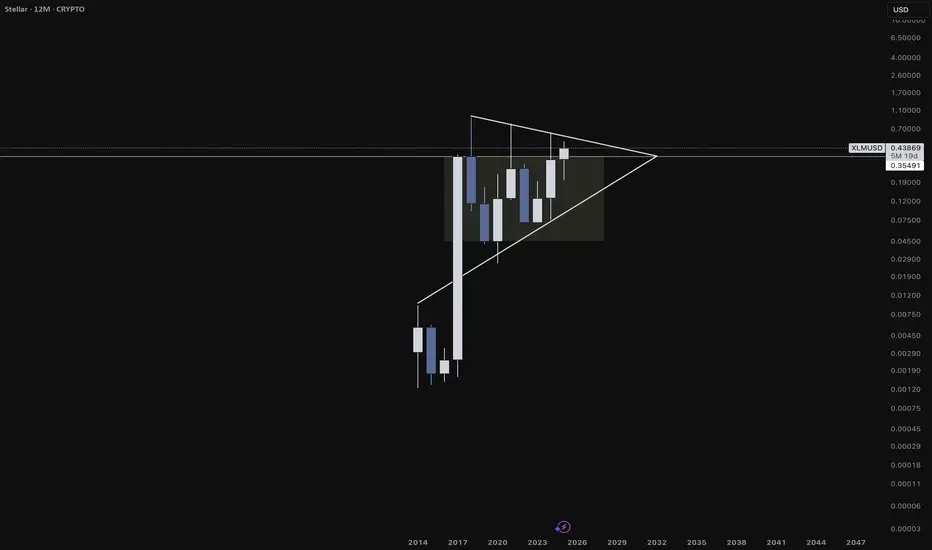
XLMUSD Nearing Breakout After 3,000-Day Triangle FormationXLM has been consolidating inside a massive symmetrical triangle for over 3,000 days. This long-term pattern on the monthly chart dates back to 2017. The price is now approaching the upper resistance trendline of the triangle. A breakout from this structure could ignite a major bullish rally.
The current monthly candle shows strong momentum with over 100% gains. A confirmed breakout above resistance could mark the start of a macro uptrend. This triangle is one of the most significant technical setups in XLM’s history.
Target 1: $1.00
Target 2: $2.50
Target 3: $5.00
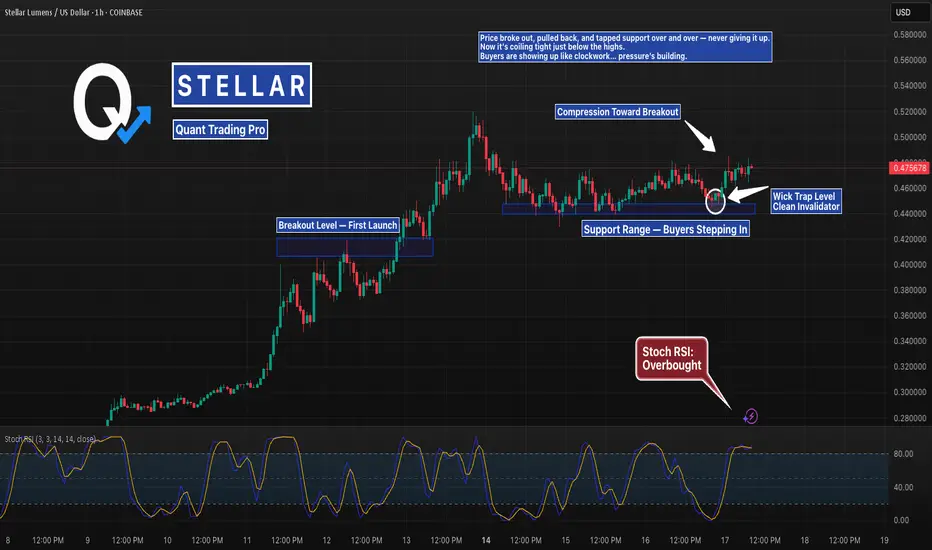
XLM Coiling at the Highs After Holding Support PerfectlyStellar broke out, then printed the cleanest support range you’ll find.
Wicks into demand, fast rejections, and now it’s compressing just under resistance.
If it breaks from here, there’s room to stretch.
But don’t forget — the longer it coils, the harder it snaps.
#XLM #StellarLumens #XLMUSD #SupportAndResistance #BreakoutSetup #CryptoCharts #TradingView #QuantTradingPro #BacktestEverything
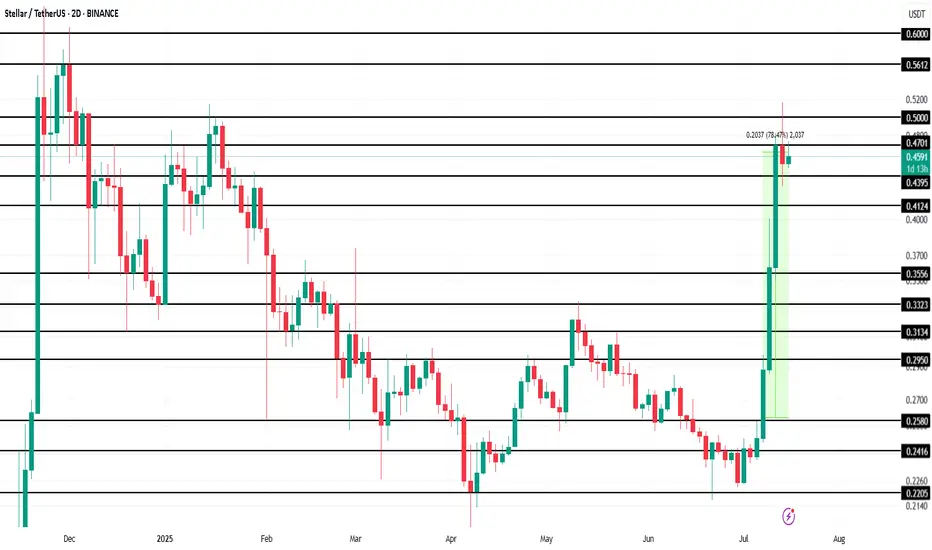
Stellar (XLM) Makes History Amid 78% Price Surge This WeekBINANCE:XLMUSDT is currently trading at $0.46, up 78.5% over the past week . However, the altcoin faces resistance at $0.47, a level it has struggled to breach in recent days. The ability to break this resistance is crucial for continued growth, as it will determine whether XLM can push higher.
BINANCE:XLMUSDT futures market activity has also surged, with Futures Open Interest hitting an all-time high of $520 million in the last 24 hours. This indicates that traders are increasingly interested in the asset's derivatives, which are capitalizing on its rise.
Given the strong sentiment from futures traders and the technical indicators, it is likely that BINANCE:XLMUSDT will push past the $0.47 resistance and target $0.50 in the coming days . A successful breakthrough could lead XLM toward its next target at $0.56, marking an eight-month high. This would signify continued strength for the asset.
However, if the broader market sentiment shifts or investors begin to sell their holdings, BINANCE:XLMUSDT could face a significant pullback. If the price falls below the key support levels of $0.43 and $0.41 , it could slide further to $0.35, which would invalidate the current bullish outlook.
Stellar XLM price analysisToday, the price of CRYPTOCAP:XLM rose quite dramatically, doing so at a critically important moment, but trading volumes are slightly insufficient for final confirmation.
Now let's look at what we wrote for the OKX:XLMUSDT chart four months ago: “It would be ‘right’ to test $0.19-0.20 before the start of strong growth.”
👆
The minimum was $0.19976 — do we "check" and "done" that?
📈 If so, then the price of #XLM should not fall below $0.226 anymore.
And ahead lies only growth in the price of the #Stellar token to at least $0.50, or even $0.60.
🏆 Well, and about the global goal for #XLMUSD we wrote in the previous idea — read, analyze, and turn information into profit!
_____________________
Did you like our analysis? Leave a comment, like, and follow to get more

Stellar (XLM) Rejected Hard—Brace for $0.25 Next?On the daily chart of XLM/USDT, price has made a steep, parabolic rise, pushing directly into a well-established resistance zone around $0.5155. This level has historically capped price moves, evident from several prior swing highs clustering near this area. The rally itself unfolded rapidly, without significant consolidation, leaving a series of untested supports in its wake.
This combination—a near-vertical climb into resistance—often signals buyer exhaustion. Indeed, the rejection candle formed right at the $0.5155 ceiling, which strengthens the bearish argument.
Below the current price action, there is a broad support zone between $0.3347 and $0.3504. This area previously acted as resistance earlier in the year and is likely to attract some buying interest if price pulls back decisively. Beneath it lie deeper supports around $0.2500, $0.2268, and $0.2000—levels that remain untested during this move up.
While the chart does not display volume bars, the sheer steepness of the final leg suggests momentum was likely unsustainable. Often, such aggressive spikes without healthy consolidation result in a retracement of 30–50% or more.
One critical factor to watch is whether price manages to reclaim and hold above $0.5155. Failure to do so implies that sellers remain in control, raising the probability of a broader pullback toward the mid-$0.30s or lower.
________________________________________
📉 Why This Setup Leans Bearish
This chart structure supports a bearish thesis because:
• Price is reacting strongly to historical resistance.
• The rally was parabolic, making it prone to sharp corrections.
• There is no clear consolidation base above the breakout point.
• Several untested support levels remain below current price, which the market may revisit.
If this move is indeed an exhaustion spike, the next phase is typically a retest of the last major consolidation area around $0.3504–$0.3347.
________________________________________
📊 Potential Bearish Trading Setup
Here is a structured trading idea to consider:
Short Entry Zone:
• Retest of the $0.5155–$0.5200 resistance area.
• Look for confirmation by way of bearish candlestick patterns (shooting star, bearish engulfing, or consecutive rejection wicks).
Stop Loss:
• Conservative stop above $0.6374 to allow for volatility.
• Alternatively, a tighter stop just above $0.5200 if using smaller size.
Targets:
• First target: $0.3504 (major support).
• Second target: $0.2500.
• Third target: $0.2000–$0.2268 (deeper retracement zone).

Here's Why XLM is on the Verge of a Massive breakoutThe next 10 years of success for the Stellar Network (XLM) are being shaped by decisions, developments, and trends happening right now (2024–2025). Here’s a breakdown of the long-term shaping factors currently in motion that will influence Stellar's trajectory through 2035:
------------
🌍 1. Real-World Use Cases Being Built Now
Stellar is not waiting for hypothetical adoption — it’s already deploying use cases that are foundational to its future success.
Examples:
MoneyGram Access gives real people the ability to cash in/out of crypto in over 180 countries.
USDC on Stellar enables stablecoin remittances with instant settlement and low fees.
Stellar Aid Assist provides governments and NGOs a working model for humanitarian digital cash aid.
Long-Term Impact: Building trust and infrastructure in the real world now means exponential network effects later — especially in emerging markets where crypto utility > speculation.
-------------------------------------------------------------------------------------------
🛠️ 2. Soroban (Smart Contracts) Rollout
Stellar is rolling out Soroban, a Rust-based smart contract platform that will transform the network into a programmable blockchain.
Why Soroban is Important:
Enables DeFi, lending, NFTs, on-chain identity, and DAOs.
Designed for predictable gas fees, making it ideal for finance and compliance.
Makes Stellar more competitive with Ethereum, Solana, Avalanche, etc.
Long-Term Impact: Soroban turns Stellar into a platform where real, decentralized applications can live — critical for long-term value capture and developer retention.
-------------------------------------------------------------------------------------------
🌐 3. Laying Global Payment Infrastructure
Stellar is quietly building global payment rails through partnerships with:
Fintechs (MoneyGram, Leaf, Settle, Cowrie)
Stablecoin issuers (Circle for USDC, Novatti for AUDC)
Payment aggregators in Africa, Latin America, Southeast Asia
Long-Term Impact: By 2030, these partnerships could evolve into a globally interconnected network of on/off ramps, anchors, and stablecoins. This gives Stellar real utility far beyond speculation.
-------------------------------------------------------------------------------------------
🏛️ 4. Regulatory Alignment & Compliance Tooling
The Stellar Development Foundation (SDF) is heavily involved in regulatory dialogue, including:
Working with the BIS Innovation Hub and IMF working groups
Building on-chain compliance tools (e.g. KYC/AML anchor guidelines)
Developing the Stellar Disbursement Platform, which complies with aid distribution requirements
Long-Term Impact: As crypto becomes more regulated, networks that built with compliance in mind will thrive. Stellar is positioning itself as a compliant blockchain for finance, especially for governments and NGOs.
-------------------------------------------------------------------------------------------
💸 5. Tokenization of Real-World Assets (RWAs)
The future of blockchain is heading toward tokenizing everything — and Stellar is already positioning itself at the front of that movement.
Franklin Templeton tokenized a U.S. mutual fund on Stellar.
Stablecoins like USDC and native fiat tokens are in active use.
Discussions are ongoing around CBDC pilots and tokenized bonds.
Long-Term Impact: The network that supports the most trusted tokenized assets — from CBDCs to real estate to securities — will gain enormous value from volume and liquidity. Stellar is in that conversation now.
-------------------------------------------------------------------------------------------
🧠 6. Mission-Aligned Ecosystem Funding
The Stellar Development Foundation holds billions of dollars in XLM and is using it to:
Fund early-stage startups building on Stellar
Run accelerator programs and hackathons
Expand into new regional markets (Africa, Asia, LATAM)
Long-Term Impact: Unlike many ecosystems that fizzle due to lack of funding or misaligned VC interests, Stellar has long-term strategic capital to guide the network toward its mission of financial access.
-------------------------------------------------------------------------------------------
🔐 7. Security, Speed, and Simplicity
From day one, Stellar has prioritized:
Fast block finality (~5 seconds)
Very low fees (< $0.001)
Energy-efficient consensus (SCP – Stellar Consensus Protocol)
These strengths are especially important for high-volume, low-margin applications like:
Micropayments
Remittances
Real-time settlements
Tokenized wages and aid
Long-Term Impact: As the blockchain infrastructure layer for finance matures, efficient networks will dominate. Stellar’s technical foundation makes it a sustainable long-term option.
-------------------------------------------------------------------------------------------
🧭 8. Stellar’s Focused, Long-Term Vision
SDF’s mission isn’t to be “just another smart contract chain” — it’s to improve access to equitable financial services, especially in underbanked regions.
That vision is:
Clear
Consistent
Attractive to partners, governments, and NGOs
Long-Term Impact: Clarity of mission = better talent, partners, funding, and resilience during market cycles.
-------------------------------------------------------------------------------------------
XLMUSD inv h&s at the threshold of the necklineNo confirmation yet but market currently feeling very bullish here. Likely to breach this neckline in the next few candles. *not financial advice*

XLMBTC To Enter Its Biggest Bull Market Ever · 4,855% In 2017Stellar. No bull market vs Bitcoin in 2021. You know what this means? We are due an ultra-strong bull market for XLMBTC in 2025 (and beyond).
The 2017 bull market lasted 308 days. Total growth reached 4,855% within this period. The bear market that followed was brutal. From January 2018 until November 2024. A total of 2,499 days of bearish action.
A bottom was hit 4-November 2024 and the proceeding week we saw a major advance. This was a 400% bullish wave. Now this wave is over with a correction and the correction ended in a classic higher low. This week we have a new bullish breakout and this is the continuation of the uptrend, the first time XLMBTC goes bullish since 2017. It seems this pair will continue bullish even after Bitcoin peaks. Who knows, maybe even years going up.
The chart is solid and supports additional growth. We are due a strong rise, the biggest ever for this pair.
Thank you for reading.
Namaste.

Stellar Lumens Looks Ready for Blast-Off!There is a very similar trend happening with the technology of the internet and computing as what we’re seeing now with AI and crypto. The early accumulation cycle for Nvidia would have shaken out many investors simply because of how long it took before going parabolic. Stellar Lumens is showing the same pattern—but the wait could be over. I see a large parabolic run coming for Stellar Lumens very soon, one that could take us to new all-time highs and spark a mass adoption cycle similar to what happened with internet and computing technology.
As always, stay profitable.
- Dalin Anderson

Is The Bottom In For XLM?Stellar Lumens (XLM) is exhibiting strong bullish momentum supported by favorable technical indicators, resilient support zones, and growing investor sentiment around utility-driven altcoins. The recent rebound off the $0.24 support level marks a significant higher low on the daily chart, reinforcing the continuation of the medium-term uptrend that began in Q2 2025. This rebound occurred with increasing trading volume, signaling renewed accumulation and a potential shift in market structure from consolidation to expansion.
I firmly believe the bottom is in, and the next leg up is upon us.

Phemex Analysis #95: Pro Tips for Trading Stellar (XLM)Stellar ( PHEMEX:XLMUSDT.P ) is an open-source, decentralized blockchain platform specializing in fast, affordable cross-border transactions aimed at enhancing global financial inclusion. Its native cryptocurrency, Lumens (XLM), serves as a bridge for currency exchanges and is used to pay transaction fees on the network. Founded in 2014 by Jed McCaleb, Stellar connects banks, payment systems, and individuals worldwide, providing seamless and cost-effective financial interactions.
Recently, Stellar has shown positive market momentum, including a notable 5% price surge coupled with increased transaction volumes. A key catalyst for this optimism is PayPal’s upcoming integration of its stablecoin PYUSD onto the Stellar blockchain, significantly expanding Stellar's real-world use case and accessibility across more than 170 countries.
Given these promising developments, let’s explore several possible trading scenarios to help traders strategically approach XLM.
Possible Scenarios
1. Breakout Rise to $0.28 and Above (Bullish Scenario)
On the daily chart, XLM recently formed a clear "cup and handle" pattern, with the handle emerging around June 22. This classic bullish indicator signals accumulation of buying momentum. If XLM decisively breaks out above the critical resistance level at $0.257, particularly with strong trading volume, it could confirm a bullish continuation, potentially targeting resistance zones around $0.28, $0.312, and even the significant resistance at $0.43.
Pro Tips:
Entry Point: Consider entering positions after confirming the breakout above $0.257, ideally with significant volume confirmation.
Profit-Taking Levels: Aim to take partial profits at key resistance levels: $0.28, $0.312, and $0.43.
2. Rejection by Key Resistance Levels (Neutral Scenario)
While the immediate resistance at $0.28 is relatively weak and likely to be overcome easily, subsequent resistance at $0.312 and particularly at $0.43 could present strong selling pressure, potentially rejecting XLM’s first attempt.
If rejection occurs, the price will likely retrace to retest support zones, such as around $0.25, consolidating before attempting another bullish move.
Pro Tips:
Cautious Entries: If initial rejections occur at higher resistance zones ($0.312 or $0.43), consider waiting for price stabilization around lower support areas ($0.25) before re-entering.
Volume Check: Closely monitor trading volumes during retracements—declining volume often indicates a healthy pullback rather than a significant reversal.
3. All Things Go South (Bearish Scenario)
If broader market sentiment suddenly turns sharply negative—particularly driven by a significant decline in Bitcoin—XLM could face substantial selling pressure. A sharp drop below key support at $0.216 with high volume, accompanied by broader market downturns, would signal serious bearish momentum.
Pro Tips:
Market Observation: Stay cautious and consider stepping aside until clear stabilization occurs at lower support levels.
Accumulation Opportunities: Long-term holders should watch closely for stabilization at critical historical supports, including $0.20, $0.18, $0.12, and $0.09, which could offer attractive entry points for gradual accumulation.
Conclusion
Stellar (XLM) currently stands at a pivotal juncture driven by significant fundamental catalysts and compelling technical signals. By closely monitoring the outlined bullish, neutral, and bearish scenarios, traders can strategically position themselves for profitable trades while effectively managing risks. Always remain alert, employ disciplined risk management strategies, and stay informed on broader market movements to successfully navigate XLM’s market dynamics.
🔥 Tips:
Armed Your Trading Arsenal with advanced tools like multiple watchlists, basket orders, and real-time strategy adjustments at Phemex. Our USDT-based scaled orders give you precise control over your risk, while iceberg orders provide stealthy execution.
Disclaimer: This is NOT financial or investment advice. Please conduct your own research (DYOR). Phemex is not responsible, directly or indirectly, for any damage or loss incurred or claimed to be caused by or in association with the use of or reliance on any content, goods, or services mentioned in this article.

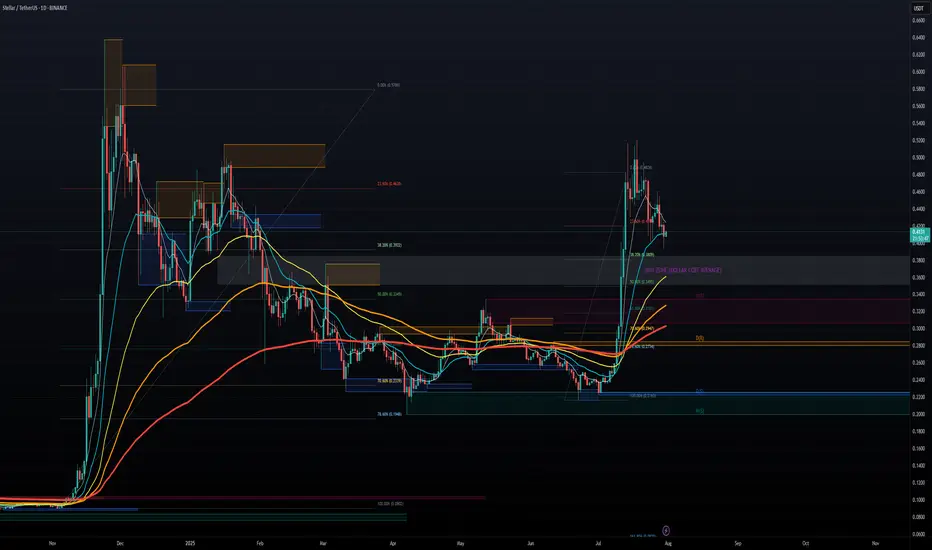
Stellar 2025 Bull Market, ATH Targets, Price Action & MoreA very interesting chart. What is interesting here is how obvious it is that the correction is over. Stellar produced a massive bullish breakout in November 2024, more than 700% growth. After a strong move, there is always a correction. After the correction ends, we get the resumption of the initial move, in this case a bullish wave.
The 0.786 Fib. retracement level worked as support. 7-April. There is an interesting dynamic around this level. Back in July 2023 as XLMUSDT was rising resistance was found around 0.2000. Very close to this level. We then had the late 2024 bullish wave and the correction that ended in early April this year. Support was found exactly at the 0.786 Fib retracement level and this level matches 0.2000. This is the purple line on the chart. Resistance turned support.
After this support zone was hit and confirmed Stellar moved to produce an initial breakout and on the 16-June week, 22-June, we get a higher low. This higher low signals the start of the next bullish wave with a target around 0.9100. This is the next target for the current move but not necessarily where the bull market cycle will end. Can be but not necessarily, the action can move higher.
Growth potential from current price to our target goes to 257%. Coming from the August 2024 low, this same target would give a total of 1,099%. Seeing how strong the first jump was, it is likely that Stellar will go higher in this 2025 bull market.
We have another target between $1.25 and $1.35.
Let's focus on the market and the bigger picture.
Stellar has already proven that it will be a top performer in this cycle. Back in late 2024 XLM outperformed many projects, we can expect the same pattern to repeat in this bullish continuation.
The fact that there are no new lows also signals strength. We saw many pairs hitting new all-time lows in April and June, this is not the case here. And this is also good.
This is a proven project so it is easy to go in big.
Last time the meat of the move unraveled in just two weeks. Something also to keep in mind. Something similar would allow us to profit from the entire XLM wave and then browse the market for new opportunities.
Remember, the market is set to grow for 6 months in the least or it can extend and grow for years. While some pairs go down, others will be going up. When some pairs stop going up, others being down will recover and grow. The market will cycle between this and that, here and there; in the end, everything grows; that's the definition of a bull market. A rising wave lifts all boats.
Notice the long-term consolidation phase, it lasted more than 900 days and then we had a very strong bullish breakout. The longer the consolidation phase, the stronger the move that follows. This is only the beginning, there will be more.
Thank you for reading and for your continued support.
Namaste.

XLMUSD Huge breakout may happen any moment.Stellar / XLMUSD is testing the 6 month Falling Resistance again, while trading inside a Channel Up.
The 1day RSI is in strong support of this move and may force a 1day candle closing above the Resistance finally.
If it happens, go lonh and target 0.3650 (+32.79%).
Previous chart:
Follow us, like the idea and leave a comment below!!
