CHEVRON 53-year Channel Up for longterm investors can dazzle youChevron (CVX) has been trading within a 53-year Channel Up since January 1973. This is the epitome of long-term investing as the pattern has given excellent correction periods (Bear Cycles) to buy for the long-term and Higher Highs to sell and take profit.
During the first years, its Bull Cycles that ended in Higher Highs have been very aggressive, with all three reaching (and even exceeding) the 2.0 Fibonacci extension. In more recent years after the 2008 U.S. Housing Crisis, the two out of three major Bull Cycles (Bullish Legs for the Channel Up) merely reached the 1.382 Fib. All of the Bearish Legs, however, declined by around the same rate (-46.89%, -48.62% and -50.78%). The last two even hit the 1M MA200 (orange trend-line).
As a result, if we assume we will have the minimum of a Bear Cycle Chevron has seen inside this pattern which was the Dotcom's -41.55%, we can expect the current correction to marginally break below the 1M MA200 again to $112.00. However a Target on the 1M MA200 around $120.00 would perhaps be more fair.
The most efficient Buy Signal through this 53-year pattern, ha been when the 1M RSI hit 38.00. As you can see this has happened 7 times, providing the best level to enter for a long-term investor. Consequently, if the 1M RSI hits 38.00 before the stock hits $120.00, it is a good idea for long-term buyers to enter regardless.
The Target then is again the 1.382 Fibonacci extension at around $235.00.
---
** Please LIKE 👍, FOLLOW ✅, SHARE 🙌 and COMMENT ✍ if you enjoy this idea! Also share your ideas and charts in the comments section below! This is best way to keep it relevant, support us, keep the content here free and allow the idea to reach as many people as possible. **
---
💸💸💸💸💸💸
👇 👇 👇 👇 👇 👇
Stocks

ETHUSD Poised for Upside After Support HoldETHUSD is respecting a key support zone after a healthy pullback from recent highs. Price remains above the golden zone, suggesting bullish structure is still intact. A bounce from current levels could open the path toward the first target near prior highs, with buy-side liquidity resting above and a potential continuation toward the second target. Overall, the chart highlights a clean structure with clear support, targets, and momentum alignment.

Silver Breakout From Demand Zone – Eyes on $82 and $87 TargetsSilver has successfully bounced from the marked demand zone and broken out of the falling channel structure. Price is now respecting the ascending channel and building bullish momentum. As long as price holds above the breakout level, upside continuation remains likely.
The first bullish target is $82.49, followed by the second target at $87.18 if momentum extends. Watch the channel support for continuation or potential pullback entries.
This setup highlights clean market structure: breakout → retest → bullish trend development.

EUR/USD Bearish Breakdown – Targets in FocusThis EUR/USD 2-hour chart shows a clear bearish trend. Price moved from consolidation into a rising channel, then formed a rounding top and broke down. After a brief pullback, EUR/USD continues to trade inside a descending channel, aiming toward lower support levels marked as the 1st and 2nd targets.

S&P 500 Daily Chart Analysis For Week of Jan 9, 2026Technical Analysis and Outlook:
During the inaugural trading session of the New Year, the S&P 500 Index is demonstrating a pronounced bullish sentiment. The Index has successfully breached the critical Key Resistance level at 6,932 and has also retested the completed Outer Index Rally at 6,945. It is anticipated that the Index will continue its upward trajectory toward the subsequent target of Outer Index Rally 7,026.
Nonetheless, it is crucial to acknowledge that, given prevailing market conditions, there is a significant likelihood of steady to lower pullbacks before the Index successfully achieves the Outer Index Rally target of 7,026. However, the market participants need to be aware that this event will trigger a price action in Force Retracement to the attainable Mean Support level of 6,922.

RIVN Crossroads: Can We Reclaim $20.61 for a Run to $27... and beyond for the rest of 2026?
while the recent suspension recall and CEO share sale have pushed the price down about 9%, the volume indicators tell a much different story than the headlines.
The Thesis: Despite the pullback the past 3 days, we are seeing a significant Bullish Divergence on the OBV and A/D lines. While retail is panic-selling the recall news, the 'Smart Money' indicators (CMF and Cumulative Volume Delta) are actually rising or holding steady.
This suggests the dip is being absorbed by institutional buyers.
Key Levels to Watch:
Support: If we hold the $19.50 zone through this week, the 'shakeout' is likely over.
Resistance: $20.61 is the immediate pivot. A break above this validates a move toward the $27 supply zone.
Catalyst: All eyes are on the February 12th earnings for R2 platform updates.
Don't forget the strategic partnership with #AMZN which is a major shareholder.

Why Is Duolingo Down 70% from ATH - Analysis1) Why Duolingo’s Stock Fell ~70% from Its ATH:
Duolingo’s stock peaked around $540+ in May 2025 and has since fallen sharply (~65–70% down). Main reasons for the drop:
-Sentiment / Valuation Concerns:
Investors have been worried about slower near-term growth, especially in bookings and guidance. Analysts say the company’s long-term narrative isn’t broken, but short-term worries dragged the stock down.
-AI Competition Fears:
Some investors feared that advances in AI (like GPT-based tools) could reduce Duolingo’s need. However, some analysts argue those fears are overblown, and Duolingo is incorporating AI itself.
-Guidance & Expectations:
Even with strong revenue growth, some guidance for the future was viewed as cautious, which disappointed the market. So the stock was driven down more by expectations and fears than by a collapse in underlying business performance.
2) Company Fundamentals: Strengths
-Strong Revenue Growth:
Revenue grew strongly: 40%+ year-over-year, heading toward $1B in 2025. Revenue growth has been consistent for years.
Large & Growing User Base:
Duolingo surpassed 50 million daily active users (DAUs) with 36% growth year-over-year, and monthly users are huge. Large monthly active user base shows strong engagement and stickiness.
Diversified Offerings:
Duolingo expanded from just language to chess, music, math and is using AI to create content faster. Multiple revenue streams: premium subscriptions, in-app purchases, English Test certification.
-Freemium Monetization Model:
This attracts a huge audience and converts some free users into paying subscribers over time.
Business of Apps
-AI Integration:
The company is using AI to personalize lessons, which could help user retention and future monetization.
3) Company Weaknesses / Risks:
-Valuation Uncertainty:
Even though fundamentals are decent, many investors think the valuation needs to justify growth prospects, and when expectations slow, the stock suffers.
-AI Disruption Narrative:
Some fear AI language tools could make Duolingo less indispensable; however, analysts say Duolingo’s gamified, interactive experience plus its subscription model still differentiates it.
Profit vs Growth Tradeoff:
Recent shifts in focus toward long-term growth rather than immediate monetization undercut short-term results in the eyes of some investors.
-Guidance Disappointments:
Some analysts say guidance hasn’t been strong enough to excite markets recently.
Disclaimer:
This analysis is for informational and educational purposes only and does not constitute financial advice, investment recommendation, or an offer to buy or sell any securities. Asset prices, valuations, and performance metrics are subject to change and may be outdated. Always conduct your own due diligence and consult with a licensed financial advisor before making investment decisions. The information presented may contain inaccuracies and should not be solely relied upon for financial decisions. I am not a licensed financial advisor or professional trader. I am not personally liable for your own losses; this is not financial advice.

Rejection from Supply Zone Signals Potential Pullback to Key Dem
This is a 2-hour BTC/USD chart showing a structured market move framed by clear supply and demand zones
Supply Zone (Top, ~94k–95k
Price rallies into this upper resistance area and gets rejected, indicating strong selling pressure and exhaustion of the bullish move.
Demand Zone (Bottom, ~86k–87k):
A well-defined accumulation area where buyers previously stepped in, acting as a likely downside magnet if price continues lower.
Ascending Channel:
BTC previously trended higher within a rising channel, making higher highs and higher lows. The recent price action shows a **breakdown from the channel**, signaling weakening bullish momentum.
Consolidation & Key Levels:
The horizontal zone around ~89,978 marks a former consolidation and key support. Price is currently hovering near this level, suggesting it is a critical decision point.
Bearish Projection:
The dashed levels and downward arrows indicate a potential continuation lower with targets first near 87,756 and possibly deeper toward the demand zone if support fails.
Overall Interpretation:
The chart suggests a short-term bearish correction after a strong uptrend, driven by rejection at supply. Unless BTC reclaims the broken channel and consolidation support, price is likely to seek liquidity at lower demand levels before any meaningful bounce.

BTDR Short-term analysis | Trading and expectationsNASDAQ:BTDR
🎯 Price appears to have bottomed at the low-cap golden pocket, 78.6 Fibonacci retracement and major High Volume Node support. However, a triangle could be printing, suggesting one more push lower is on the table. Getting above $14.50 will negate this.
📈 Daily RSI has printed bullish divergence, but we need to see some follow though to be confident the bottom is in.
👉 Analysis is invalidated if price falls below wave (B), $6, and the structure will start to look bearish.
Safe trading

COREWAEVE WAS A SCAM IPOSo expect it to make all time lows.
The company was only IPO'd based on a fake order by #NVIDIA.
INSIDERS are dumping.
oN yOu.
This is a roundtripooor.

Nuclear Renaissance: Why $NNE is Primed for a 2026 MoonshotCan NASDAQ:NNE find the momentum to return to the upper trend-line?
Technically, we are looking for a continuation of the bounce off the lower boundary to validate the next leg up.
While these lines are extrapolated, the historical respect for this channel suggests a significant 'reversion to the mean' or a push toward the upper standard deviation if the current news cycle continues to favour small modular reactors (SMRs).
The AI Power Crunch: By 2026, the demand for "always-on" carbon-free power for AI data centres has moved from theory to urgent necessity.
Tech giants like #Meta and #Amazon are actively signing nuclear deals, and NASDAQ:NNE ’s portable micro-reactors (KRONOS and ZEUS) are positioned as the "plug-and-play" solution for these power-hungry hubs.
What do you think? Are we heading back to the top of the channel, or is a breakdown imminent?"

GBPUSD Bearish Structure After Supply Zone RejectionThe GBPUSD 2-hour chart shows price rejecting a higher-timeframe supply zone after a liquidity sweep, followed by a clear change of character (CHoCH) indicating a bearish shift in market structure. Price then continues within a descending channel, suggesting sustained selling pressure. Two downside targets are marked, with the first target near recent support and the second aligning closer to the demand zone, highlighting a continuation move toward lower liquidity areas.

$SPY & $SPX Scenarios — Friday, Jan 9, 2026🔮 AMEX:SPY & SP:SPX Scenarios — Friday, Jan 9, 2026 🔮
🌍 Market-Moving Headlines
• 🚨 Jobs Day: Payrolls, unemployment, and wages hit together — the single most important macro catalyst of the week.
• Labor cooling vs resilience: Markets assess whether hiring strength holds without reigniting wage pressure.
• Rates and risk reset: Payrolls outcome will drive front-end yields, equity multiples, and January positioning.
• Housing check: Starts and permits add context on rate sensitivity in real economy demand.
📊 Key Data & Events (ET)
8 30 AM — Labor and Housing
• U.S. Employment Report Dec: 73,000
• Unemployment Rate Dec: 4.5 percent
• Hourly Wages Dec: 0.3 percent
• Hourly Wages Year over Year: 3.6 percent
• Housing Starts Oct: 1.33 million
• Building Permits Oct: 1.34 million
10 00 AM
• UMich Consumer Sentiment Jan: 53.4
⚠️ Disclaimer: For informational use only — not financial advice.
📌 #SPY #SPX #JobsReport #NFP #wages #labor #macro #markets #trading

Biogen (BIIB): Clear operational turnaround signalBiogen(BIIB) Fundamentals: Biogen Had it's Multi-year decline stabilized, growth returned driven by new product launches.
Clear operational turnaround signal.
Biogen(BIIB) Technicals: STRONG volume way above the average, 30 and 50 EMA crossover and breakout of a pivot point in the weekly chart.
I'm LONG Biogen(BIIB) at: $182.47
SL or TP: When Biogen(BIIB) close below the 50 EMA (WEEKLY)

QQQ Weekly Outlook – Week 1 of 2026QQQ Weekly Outlook – Week 1 of 2026
Technical Look:
Price moved exactly as planned in my December 21 Weekly QQQ outlook (you can check the linked idea). The market bottomed on December 17, as anticipated in my December 14 Weekly QQQ prediction, and then started to move higher. Price reached both of my targets and began retracing from those levels. (Please refer to the linked post for details)
Currently, QQQ is retracing from the highs and appears to be seeking additional liquidity and energy before any continuation higher. This consolidation phase may take longer than initially expected.
Scenarios – Prediction:
Scenario 1: Bullish Scenario
I am looking for price to break and close above the 614.5 level on the 4H timeframe.
A confirmed 4H close above 614.5 would indicate that the bullish scenario is in play, and I would consider engaging on the long side.
Potential upside targets for this scenario:
621.75 – 629.5
Scenario 2: Bearish Scenario
If price fails to break above 614.5, I would consider that QQQ is shifting into a bearish flow and seeking lower prices. In that case, I would look to engage on the short side.
Downside targets for this scenario:
610 – 606.25 – 600 – 588.5
The 588.5 level represents the most extended bearish scenario. If price breaks 600 aggressively , I would then expect a move toward 588.5.
Position Management Notes:
Each target level may trigger significant pullbacks or reversals. Personally, I take partial profits at these levels and keep the remaining position open toward the next targets, while trailing the stop loss to breakeven. This is how I manage my positions.
I share deeper US Market breakdowns and weekly scenario updates on Substack. Link is in my profile.
This analysis is for educational purposes only and reflects my personal opinion. It is not financial advice.

Update: Nikkei 225 Hits 52k. The Log Extension still the Magnet!The Nikkei 225 closed the first full week of 2026 at 51,939.89, marking a significant recovery from its mid-week dip to nearly 51,000. Here is why the structural bull case for your log target remains robust:
The "Takaichi" Tailwinds: The market is currently fueled by "Sanaenomics" (the policies of Prime Minister Sanae Takaichi), which focus on expansionary fiscal measures and a pro-growth stance that favors reflation over aggressive interest rate hikes.
Earnings Dominance: Heavyweights like Fast Retailing (Uniqlo) recently posted record earnings (revenue of ¥1.03 trillion), proving that Japan's major exporters can deliver massive growth even as the global landscape shifts.
Institutional Accumulation: Unlike previous "hot money" cycles, this rally is seeing sustained inflows from global funds (like BlackRock and Citigroup) who are pivoting away from expensive US tech toward the "relative affordability" of Japanese equities.
The AI Infrastructure Play: Japan's industrial ecosystem—specifically semiconductor equipment makers like Tokyo Electron and Advantest—provides the physical infrastructure (machinery and materials) required for the global AI boom, creating a consistent floor for the index.
Technical Verification (January 2026)
The Pivot: The index successfully tested and held the 51,000 handle on January 8th, confirming it as new structural support.
Momentum: The 50-day moving average remains firmly above the 200-day, a "Golden Cross" alignment that typically precedes long-term logarithmic extensions.

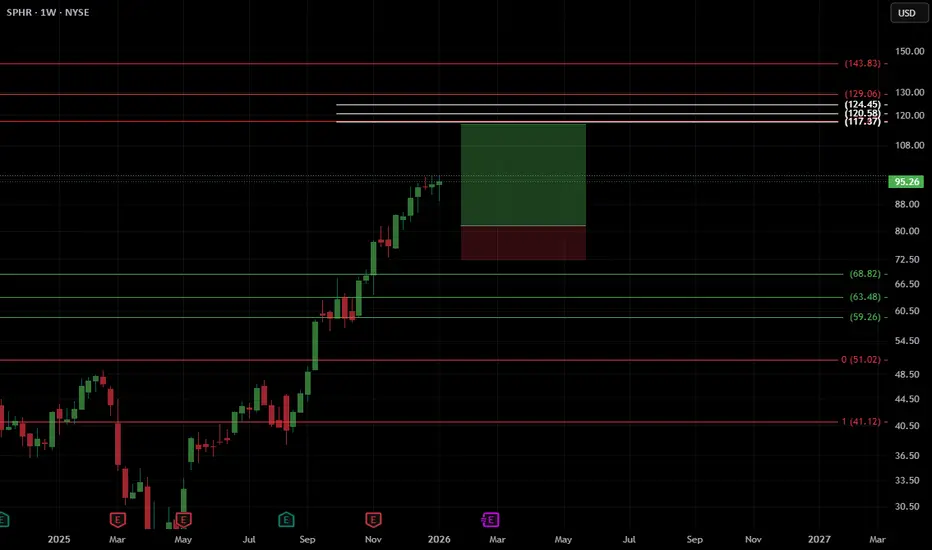
$SPHR , SetupEntry : 82
TP : 117.37
SL : If you wish
⚠️ Financial Disclaimer:
This post is not financial advice. I am not your financial advisor, your life coach, or your legally responsible adult.
Always do your own research and never trade based solely on internet comedy.
$MU SetupEntry : CMP
TP1 : 655.27
TP2 : 809.36
SL : If you wish
⚠️ Financial Disclaimer:
This post is not financial advice. I am not your financial advisor, your life coach, or your legally responsible adult.
Always do your own research and never trade based solely on internet comedy.

OVID Therapeutics (OVID) - Biotech with strong nervesOVID Therapeutics is a biotech company focused on developing treatments for rare neurological and genetic disorders.
On the monthly chart, OVID has broken above a long-term descending trendline and is currently retesting it from above. The key support zone sits at 1.45, while the latest close at 1.67 confirms structure preservation. Volume expanded on the breakout and faded during the pullback, indicating a healthy retest. Monthly MACD remains above zero and shows bullish divergence, while RSI holds above 50, confirming a shift in market phase. Volume profile suggests a potential magnet zone above current prices if support continues to hold.
Fundamentally, the company remains unprofitable, which is typical for a development-stage biotech. Q4 2025 EPS is expected at −0.11, revenues are minimal, but debt levels are manageable and cash reserves provide operational runway.
This is a higher-timeframe positioning idea, where the market begins to reassess the asset after a prolonged downtrend. Biotech is never comfortable, but this is how monthly reversals usually start.


Quantum's NQ Trade Thesis 1/9/26SEED_ALEXDRAYM_SHORTINTEREST2:NQ 📸
💡Mixed data this AM so need to see how the market reacts on open. Also have tariff decision today so that could also provide another huge move.
🟢Bullish if... Above pivot at 25,731 with buyside support
🔴Bearish if... Under pivot down to buyside support/poc around 25,670s.
📍Pivot - 25,731
📈Upside 🧲 25,818 - 25,838 - 25,850 - 25,863
📉Downside🧲 25,731 - 25,710 - 25,687 - 25,638
⚠️News:
8:30am
Average Hourly Earnings m/m
Non-Farm Employment Change
Unemployment Rate
Housing Permits
Housing Starts
10:00am
Prelim UoM Consumer Sentiment
Prelim UoM Inflation Expectations

The Insider Intel Community Is Now Live!We’re excited to announce that our new Insider Intel Community is officially open — built for traders who want to level up their analysis, connect with others, and discuss real market structure setups across Forex and Stocks.
Inside the community, members can access two dedicated trading hubs:
💹 The Trading Floor FX – Focused on Forex price action, ICT concepts, and macro drivers.
📈 The Equity Exchange – Covering stock setups, swing ideas, and long-term plays.
We’re posting more frequent breakdowns, setups, and weekly bias updates within the community to keep discussions structured and informative. You’ll also find built-in trading tools like a heat map, news feed, and economic calendar to support your analysis workflow.
This is a space for traders who value structure, collaboration, and clarity — designed to learn, share, and grow together.
If you’re part of the Insider Intel network, you can now explore the new community area directly through our main portal.
Stay sharp. Trade smart.
— Insider Intel Team
Tesla (TSLA) | Maintaining Bullish Structure & Supporting Key Levels
Tesla continues to show strong bullish structure across the higher timeframes.
Price has respected the monthly Fibonacci golden zone (234–212) as a solid re-entry area, aligning with a bullish order flow and structural break to the upside.
We can see price now consolidating above a key monthly POI (around 384–359), forming a potential continuation zone as it builds liquidity for the next leg higher.
The long-term bullish projection remains intact, with extended targets toward 831–850, completing a full swing move if momentum persists.
The overall structure remains supported by broader NASDAQ tech strength, reinforcing Tesla’s alignment with sector performance.
In our private trading discussions, we explore deeper setups like this — identifying structure shifts, key liquidity pools, and macro confluence zones across multiple assets.
Disclaimer: This analysis is for educational purposes only and does not constitute financial advice. Always do your own research (DYOR) before making investment decisions.

TSLA: Historical Gigantic Triangle Breakout, Next 200% in Sight!Hello There,
Welcome to my new analysis about the Tesla stock (TSLA). On the broader and global timeframe perspective, this stock is sending huge and historical signals that should not be underestimated. TSLA is continuously within this major uptrend from where it always had the ability to form new higher highs after the others. Now, TSLA is surging higher into the next spheres. Such price action is indicating massive events likely to follow through in 2026.
As when looking at my chart, we can see there that TSLA already broke out above the upper boundary of this gigantic triangle formation. Such a formation is, in a high number of cases, marking the starting point of a huge expansion towards the upside. Especially as TSLA already completed the wave count within the triangle formation, this is marking a huge confirmation of this gigantic formational structure.
As it is seen within my chart, TSLA is now building up above the upper boundary of this giant formation and is setting up the next bullish setup from where the next phases of the bull run are likely. There are also underlying factors supporting this trend, such as the 100-EMA and 50-EMA. As this uptrend is going on, TSLA has major supports here. From this level, the next bounces are highly likely. Currently the bullish setup is already building up, and a continuation should be expected.
Also, TSLA had the ability to expand their China business massively. Such a gigantic market is likely to boost sales, which in turn is bullish for the underlying stock. This dynamic is also attracting a lot of investors and whales to further move into this stock. It will be fascinating to see this dynamic expand in the upcoming times and how the actual market sets up further dynamics for the price action.
Technically, TSLA is already confirming the next major 200% move. As this whole formation has been completed, this is already the cornerstone of confirmation in this whole structure. Considering such a dynamic, there is a high likelihood that TSLA won't reverse or get stuck within the whole structure. It is important that TSLA stay above the upper boundary of the triangle. As long as this is the case, the next expansionist move is likely to happen soon.
With this being said, it is great to consider the important trades upcoming.
We will watch out for the main market evolutions.
Thank you very much for watching!
