EURUSD - Bullish momentum for the week!Introduction
The EURUSD has been consolidating for a prolonged period, sweeping both upside and downside liquidity in the process. After the liquidity sweep to the downside, price reacted strongly by moving upwards, indicating a shift in market structure. The pair has since inverted the previously bearish 4-hour fair value gap, which now acts as a bullish reference point, and is currently holding within the 1-hour fair value gap. As long as price maintains this 1-hour FVG support, there remains a strong case for further upside movement.
Liquidity Sweep
The recent downside liquidity sweep was a significant turning point. By driving below key lows and collecting stop orders, EURUSD effectively cleared the market of weak positions. This was followed by a sharp rejection, represented by a wick, which signaled strong buying interest at these levels. Since then, the market has been climbing steadily, showing intent to challenge the higher liquidity levels resting above.
Inversion
Following the liquidity sweep, EURUSD inverted the bearish 4-hour fair value gap. What was previously an area of supply and resistance has now been reclaimed and transformed into a demand zone. This inversion is an important bullish signal because it indicates that sellers were absorbed and that buyers have successfully taken control. As long as this zone remains intact, the path of least resistance continues to lean upward.
1-Hour Bullish FVG
Currently, EURUSD is resting on a 1-hour bullish fair value gap. This area serves as an important support level, and as long as it holds, price is likely to use it as a springboard for further gains. The next targets lie at the upside, beginning with the first objective at the intermediate resistance level labeled “Target 1,” before ultimately pushing towards the liquidity area above. By reaching this zone, the market would sweep short-side liquidations and potentially trigger momentum-driven buying.
Target Area
The primary targets for this bullish move are the two significant highs above the current range. These highs represent zones where stop-loss orders are most likely accumulated. By driving into and above these levels, EURUSD will effectively complete a liquidity grab, providing bulls with a logical profit-taking zone before the market considers a possible retracement. Such a move would align with the general principle of markets seeking liquidity before establishing a new direction.
Final Thoughts
In summary, EURUSD is showing constructive price action following its downside liquidity sweep and subsequent bullish reversal. The inversion of the 4-hour FVG and the current defense of the 1-hour FVG are both encouraging signs for buyers. As long as the 1-hour fair value gap continues to act as a firm support, the probability of an upward continuation towards the liquidity area remains strong. However, traders should also remain mindful that once the liquidity above the highs is collected, a corrective move to the downside could develop. For now, the short-term bias stays bullish, with clearly defined targets on the upside.
-------------------------
Disclosure: I am part of Trade Nation's Influencer program and receive a monthly fee for using their TradingView charts in my analysis.
Thanks for your support. If you enjoyed this analysis, make sure to follow me so you don't miss the next one. And if you found it helpful, feel free to drop a like 👍 and leave a comment 💬, I’d love to hear your thoughts!
Stocks!

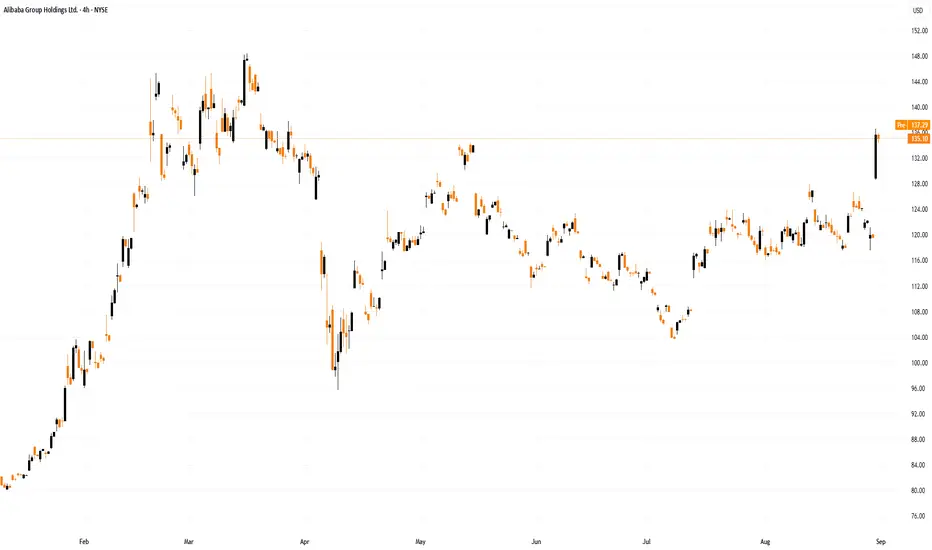
Alibaba (BABA) Shares Soar ~13% After Earnings ReportAlibaba (BABA) Shares Soar ~13% After Earnings Report
Alibaba published its second-quarter report on Friday morning. Although the company’s gross revenue came in below analysts’ forecasts ($34.6bn vs $35.1bn), BABA’s share price surged by around 13% (to its highest level since March) as the market reacted positively to:
→ Faster growth in cloud services revenue, seen as key to the company’s success in monetising artificial intelligence, similar to Microsoft and Google.
→ Testing of a new processor designed to reduce reliance on Nvidia.
Technical analysis of Alibaba (BABA) shares
When analysing BABA’s price movements in early July, we identified a resistance zone at $126–$145.
Since then, the price tested the $126 level twice in August, reversing downwards each time. However, the earnings release triggered a wide bullish gap, meaning that $126 could now act as support.
Further bullish arguments:
→ The A-B-C-D-E formation created a contracting triangle, which can be interpreted as a long-term balance of supply and demand. The current bullish impulse breaks this balance, pointing to the potential for a major bullish trend.
→ Starting from point D, price movements have formed an ascending channel (shown in blue), with its median and lower boundary potentially serving as support.
From a bearish perspective, the sharp 19% rise could encourage investors to take profits on existing long positions, as the RSI indicator has moved into overbought territory and BABA’s share price is close to the upper boundary of the blue channel.
Taking all of this into account, we could assume that after the initial strong emotional reaction to the news, the market may reassess its impact and BABA’s share price could correct (for instance, towards the lower boundary of the gap at $128.22).
At the same time, the strong fundamental outlook, driven by the company’s prospects of becoming a leader in the AI sector, suggests that by the end of 2025 we may see an attempt to break above the March high (point A).
This article represents the opinion of the Companies operating under the FXOpen brand only. It is not to be construed as an offer, solicitation, or recommendation with respect to products and services provided by the Companies operating under the FXOpen brand, nor is it to be considered financial advice.
RKLB Next target is 65.60Rocket Lab showed good strength to end the week last week, finally closing above the recent downtrend line. Next structure target would be 65.60, with partial profits being taken at key fibonacci levels along the way. The thesis changes is we break 34.

NVIDIA Has Some Reversal SignsNVDA has formed a double top and stochastic oscillator divergance on the dailyt chart. ON the monthly chart it has a it has formed a shooting star candle.
Good luck for all of you
Markets Titan

SPY LONG FROM RISING SUPPORT|
✅SPY is trading in an uptrend
Along the rising support line
Which makes me bullish biased
And the index is about to retest the rising support
Thus, a rebound and a move up is expected
With the target of retesting the level above at 650$
LONG🚀
✅Like and subscribe to never miss a new idea!✅

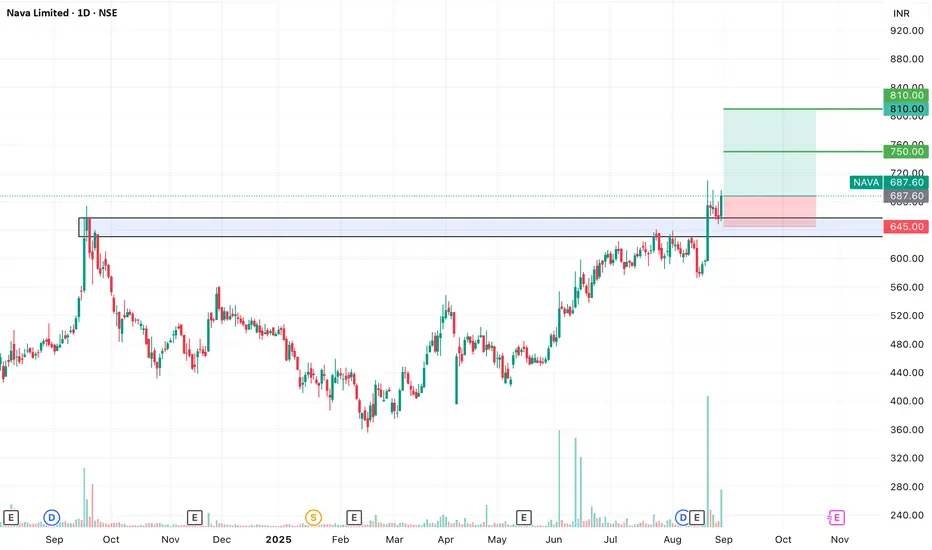
SWING IDEA - NAVA Nava Ltd , a diversified natural resources and energy company, is showing a promising swing opportunity with a breakout backed by strong technical signals.
Reasons are listed below :
Cup and Handle breakout, a strong bullish continuation pattern
Confirmed bullish price action post breakout
Bullish engulfing candle on the daily timeframe
Volume spike, confirming breakout strength
Trading near its 52-week high, showing momentum
Sustaining above 50 & 200 EMA on the daily chart
Target - 750 // 810
Stop loss - daily close below 645
DISCLAIMER -
Decisions to buy, sell, hold or trade in securities, commodities and other investments involve risk and are best made based on the advice of qualified financial professionals. Any trading in securities or other investments involves a risk of substantial losses. The practice of "Day Trading" involves particularly high risks and can cause you to lose substantial sums of money. Before undertaking any trading program, you should consult a qualified financial professional. Please consider carefully whether such trading is suitable for you in light of your financial condition and ability to bear financial risks. Under no circumstances shall we be liable for any loss or damage you or anyone else incurs as a result of any trading or investment activity that you or anyone else engages in based on any information or material you receive through TradingView or our services.
@visionary.growth.insights
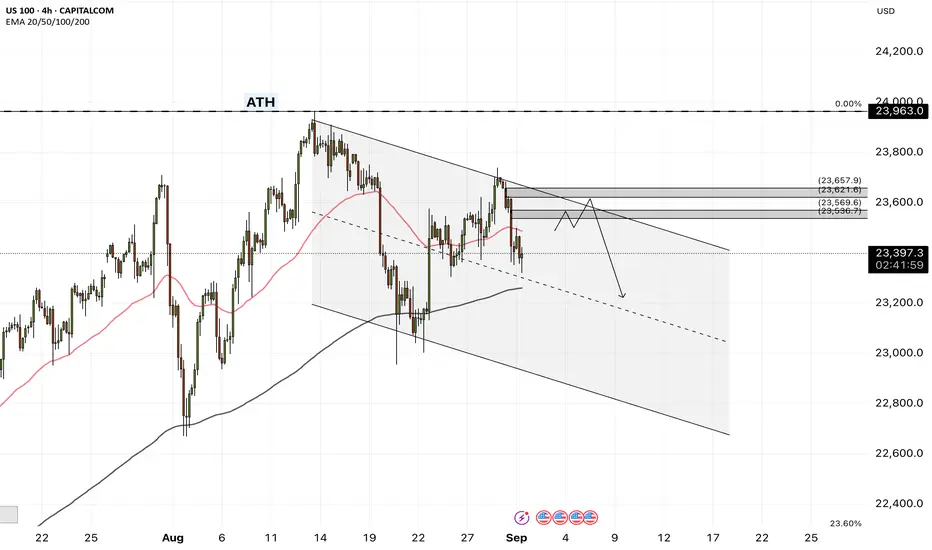
NAS100 - Stock Market, in the Work Week!The index is below the EMA200 and EMA50 on the four-hour time frame and is in its short-term descending channel. If this channel is maintained and the specified range is reached, a close sale can be made with a suitable reward.
Economists anticipate that customs tariffs will push consumer prices higher while slowing economic growth in the coming months. Inflation is expected to accelerate, though not to the extreme levels of the 1970s when the term “stagflation” was coined to describe the combination of high inflation and economic stagnation. Unlike a recession—where the economy contracts and prices fall—stagflation features rising prices despite economic weakness. The U.S. economy could be heading toward a 1970s-style stagflationary environment, though analysts believe this time it will be far less severe.
Many experts argue that the U.S. is on the verge of a period of sluggish growth paired with accelerating inflation. The root cause lies in President Donald Trump’s tariffs, which simultaneously raise consumer costs and weigh on the labor market. However, economists expect this inflationary wave to be much milder than the double-digit annual increases that strained household budgets in the 1970s.
On the corporate front, Nvidia released its second-quarter earnings last week. Revenue reached $46.7 billion, exceeding analysts’ expectations of $46.23 billion. The company’s data center unit—the main growth driver—generated $41.1 billion, slightly below the $41.29 billion forecast. Adjusted earnings per share came in at $1.05, while the adjusted gross margin stood at 72.7%.
Looking ahead, Nvidia projected third-quarter revenue of around $54 billion, with a margin of error of plus or minus 2%. Its board also approved an additional $60 billion share repurchase program. Regarding China, the company reported zero sales of H20 chips to Chinese clients during Q2 and stated that no shipments are planned for that market in the near future.
In the earnings call, CEO Jensen Huang emphasized that the Chinese market could present a $50 billion opportunity for Nvidia this year. He estimated annual growth in China at nearly 50%, noting that the country is the world’s second-largest computing market and home to half of global AI researchers. Huang stressed that maintaining a presence in China is vital for the company’s long-term future, even amid ongoing political and trade tensions between Washington and Beijing.
On the monetary policy side, UBS warned that weakening the independence of the Federal Reserve—especially following Trump’s threat to remove Fed board member Lisa Cook—could have significant economic consequences. In its analysis of Jerome Powell’s speech at the Jackson Hole symposium, UBS described it as “classic Powell”: hinting at the possibility of a September rate cut to offset tariff effects but lacking a broader long-term framework for the evolving economy.
UBS emphasized that failure to strongly defend Fed independence could heighten political risks and destabilize markets.The bank warned that if the central bank comes under political influence, potential outcomes include the reemergence of inflationary instability, a one-percentage-point increase in real borrowing costs, and negative effects on fiscal policy, corporate investment, housing affordability, household savings, and speculative activity.
This week begins with one fewer trading day due to the Labor Day holiday, yet the economic calendar remains packed, with the labor market at the center of attention. On Tuesday, the ISM Manufacturing PMI for August will be released, followed by the JOLTS job openings report on Wednesday.
Thursday will be particularly important, bringing the August ADP private payrolls report, weekly jobless claims, and the ISM Services Index—all at once. These data points are especially significant given the recent large revisions to the Nonfarm Payrolls (NFP) report, which have renewed focus on the degree of convergence or divergence between ADP and NFP figures.
Historically, ADP and NFP reports have often diverged, leaving traders mispositioned when relying too heavily on ADP data. A recent example occurred in July, when ADP reported a decline of 33,000 jobs, while NFP the following day showed a gain of 147,000—well above expectations of 110,000. However, after NFP revisions, the actual trend proved more consistent with ADP’s numbers.
The most important event of the week will take place on Friday: the release of the August U.S. Nonfarm Payrolls report. Investors will be monitoring it closely, as any signs of labor market weakness could reinforce expectations for a Fed rate cut in mid-September.
Despite growing stagflation risks and heightened market volatility, Bank of America (BofA) suggested that autumn could be an attractive entry point for bullish investors. The bank cautioned that while volatility may exert short-term downward pressure, potential pullbacks could serve as buying opportunities.
The VIX volatility index fell to its lowest level of the year following Powell’s dovish remarks at Jackson Hole. Still, concerns about stretched stock valuations, a potential AI-driven bubble, and political risks tied to Fed independence suggest that this calm may not last.
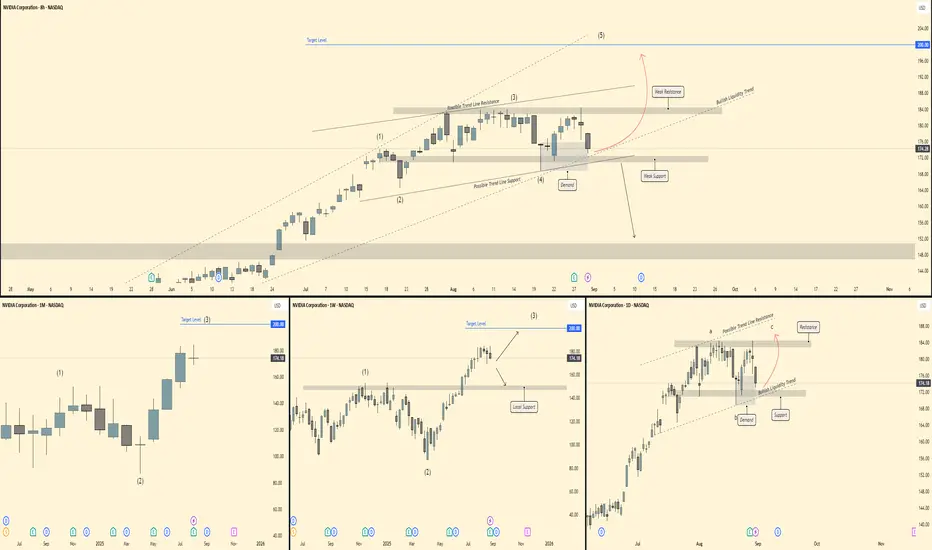
NVDA - Critical Point right now! Back to 150 OR we make new high📊 NVDA – Multi-Timeframe Outlook
🔎 Monthly (1M)
Strong bullish structure with clear Elliott Wave progression (1)-(3) unfolding.
Current candle shows retracement after a parabolic push, but higher timeframe structure remains intact.
Target level stands at 200 USD, aligning with Wave (3) completion zone.
🕰 Weekly (1W)
NVDA completed Wave (3) near 184, now pulling back into a local support zone ~160 – 165.
Structure suggests a corrective Wave (4) before potential continuation higher.
As long as support holds, expectation remains for a Wave (5) push towards 200+.
⏱ Daily (1D)
Price coiling inside a corrective a-b-c structure under trendline resistance.
Demand/support zone ~170 – 172 is acting as the base.
Break above 184 resistance confirms bullish continuation, while loss of support opens risk towards 152 (deeper retrace).
⏳ 8H
Clear retracement into demand after Wave (3) high.
Price holding trendline support + demand confluence.
If buyers step in, expect a rally into Wave (5) targeting 190 – 200.
Breakdown of demand would shift momentum bearish short-term.
🎯 Trade Plan
Bias: Bullish continuation (Wave 5 setup)
Entry Zone: 170 – 175 (demand/support)
Targets: 184 (short-term), 200 (medium-term)
Invalidation: Break & close below 160 support
Resideo Technologies (REZI) AnalysisCompany Overview:
Resideo Technologies NYSE:REZI is a smart home & security solutions provider, positioned to benefit from the fast-growing residential technology sector.
Key Catalysts:
Spin-off ahead: Plans to separate ADI Global Distribution in 2H 2026, unlocking shareholder value and sharpening strategic focus.
Honeywell indemnity resolved: Settled $1.59B liability in Q3 2025, removing a long-standing earnings overhang and improving financial clarity.
Product momentum: Strong adoption of Honeywell Home FocusPRO thermostats and First Alert smart alarms, expanding market penetration.
Investment Outlook:
Bullish above: $26.00–$27.00
Upside target: $40.00–$42.00, supported by spin-off potential, liability resolution, and product strength.
📢 REZI — unlocking value with spin-off, clarity, and smart-home growth.
#REZI #SmartHome #Security #Honeywell #SpinOff #GrowthStocks #ResidentialTech

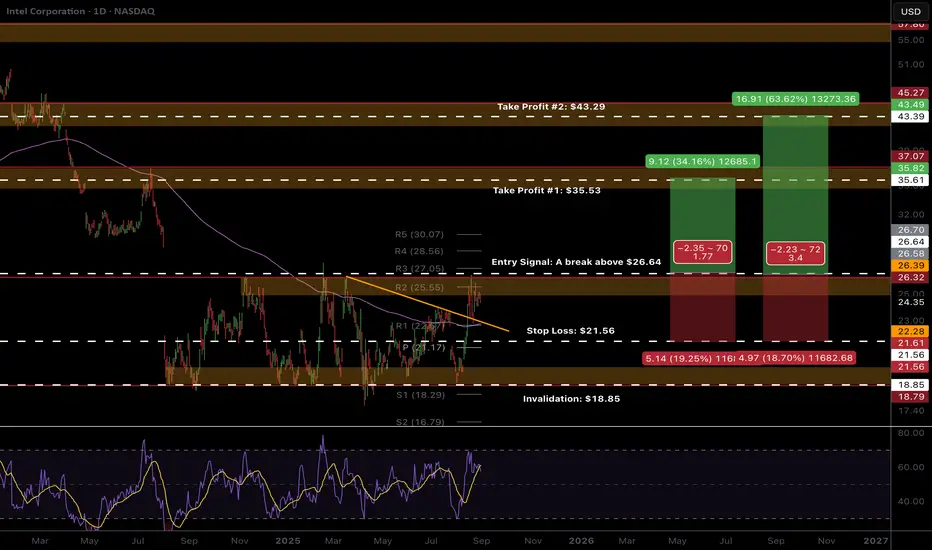
INTC Ready For Breakout?Intel INTC appears to be putting in a major bottom on the weekly time frame. Stock has been beaten down for some time!
On the daily time frame, price appears to be ready to breakout of the range above the High Volume Node after multiple tests of the upper boundary resistance.
Theres been a gap to fill for some time up to $28. The pivot targets are subdued due to the amount of time INTC has spent ranging, so not super useful for targets in this case.
Price is above the daily 200EMA which has flicked positive.
Here is an example from my trade signals Substack. Stop below the 200EMA, pivot, High Volume Node and descending support line - you don't want to see price losing these as it adds confidence to the downside. This asset is volatile so the stop is wide for now - I will be looking out to adjust this to a tighter stop and thus a larger position size once I see how price action unfolds. I believe we have a good opportunity ahead to make several trades on this asset as we play it level by level.
Safe trading
Dominion Energy Inc. September 02, 2025.$D #DominionEnergy — Dominion Energy Inc. (NYSE:D) Insider Activity Report | Utilities | Utilities - Regulated Electric | USA | NYSE | September 02, 2025.
Overview: This report evaluates the recent open-market purchase of Dominion Energy (D) shares by its Chair, President, and CEO on August 27, 2025. Dominion, a leading regulated utility with a focus on transitioning to clean energy, is well-positioned amid surging electricity demand from data centers and renewable initiatives.
The insider activity, against a backdrop of solid Q2 earnings and strategic investments, suggests executive confidence in near-term value creation. This analysis is tailored for institutional investors seeking exposure to resilient utility plays with growth catalysts.
1. Insider Trading
On Aug 27, 2025, Dominion’s boss Robert Blue (Chair, President & CEO) bought 4,331 shares @ $60.35.
Ticket size: ~$250k. (SEC Form 4)
www.sec.gov
Not huge for a $50B utility, but it’s his first open-market buy since Mar ‘24. No insider sales on record. That’s a confidence move.
2. Fundamentals
• Q2 EPS: $0.75 (beat by 8.7%). Revenues $3.5B (+3% vs est).
• FY25 EPS guidance reaffirmed at $3.28–$3.52.
• Dividend yield ~4.5% — not bad while you wait.
• $50B capex plan (2025–2029) focused on data centers + renewables.
• Offshore wind project facing cost bumps, but still on track.
3. Big Picture
• Utilities usually move slow, but AI/data-center demand is a real tailwind.
• Dominion already hooked up 15 centers (1,000 MW) in 2024, another 15 on deck this year.
• SCC hearings Sept 2 on rate adjustments — could unlock recovery on those heavy investments.
Charts:
• (3W)
Insider Trades:
D Ownership:
4. Trade Setup
Entry: $59.90–$60.35 (right around CEO’s buy).
Targets:
➡️ Short-term: $72.00
➡️ Mid-term: $79.00
➡️ Long-term: $84.00
Takeaway
CEO’s dipping into his own pocket right after an earnings beat + with data-center growth at his back? That’s not charity. That’s conviction.
For me, $D looks like a buy/accumulate here with 20–40% upside over 6–12 months. Worst case you clip the dividend while waiting — not the worst seat in the house.

Reynolds Consumer Products Inc - September 01, 2025.NASDAQ:REYN #REYN — Reynolds Consumer Products Inc (NASDAQ:REYN) Insider Activity Report | Consumer Cyclical | Packaging & Containers | USA | NASDAQ | September 01, 2025.
Let’s cut to the chase: insiders just put real skin in the game, and that matters.
1. Insider Buys
Director Duncan Hawkesby went on a shopping spree in August:
159k shares @ $22.90 → ~$3.65M
(SEC Form 4)
www.sec.gov
67k shares @ $23.04 → ~$1.55M
(SEC Form 4)
www.sec.gov
4.3k shares @ $23.16 → ~$100k
(SEC Form 4)
www.sec.gov
That’s $5.3M+ total. He boosted his stake big time, and no one’s been selling.
Even (Chairman of the Board of Directors) Rolf Stangl jumped in for 4.5k shares @ $21.
First insider buying cluster in over a year — when a director opens the wallet like that, it usually screams undervaluation.
Charts:
• (1D)
• (5D)
Insider Trades:
REYN Ownership:
REYN Hedge Fund Flows:
2. Fundamentals
➖ Q2 revenue slipped 2% to $930M, but EPS came in hot at $0.39 (beat consensus).
➖ Full-year EPS guide: $1.54–$1.61 → stable despite weak retail volumes.
➖ Margins improving thanks to automation and cost control.
Consumer staples = defensive play. Foil, bags, tableware — people still gotta eat, right?
3. Trade Setup
Entry: $23–23.50 (same zone where insiders loaded up).
Targets:
➡️ Short-term: $25.00
➡️ Mid-term: $26.50
➡️ Long-term: $28.00
When insiders drop millions while the chart’s in the gutter, they’re either crazy or early.
• My bet? They’re early.
REYN looks like a buy-the-dip defensive play with upside into earnings season.

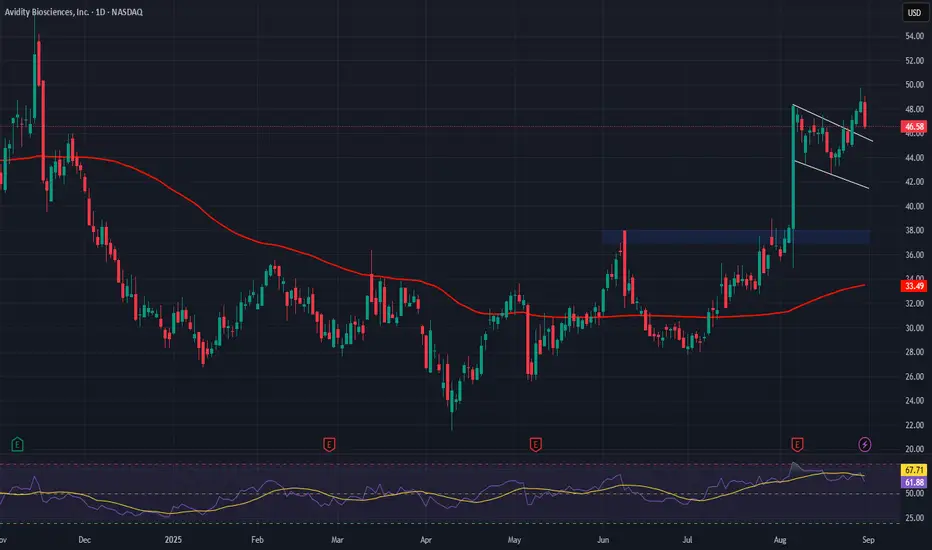
Avidity Biosciences (RNA) AnalysisCompany Overview:
Avidity Biosciences NASDAQ:RNA is pioneering RNA therapeutics with its Antibody Oligonucleotide Conjugates (AOC) platform, aiming at rare genetic diseases where no treatments exist—unlocking high unmet demand.
Financial Snapshot (Q2):
Revenue: $3.85M
Net loss: $157.31M (reflecting heavy early-stage R&D investment)
Valuation: P/S 529.67, P/B 9.27, signaling premium growth pricing by investors.
Technical View:
Stock has formed multiple bull flag patterns.
Breakout potential is strong after recent consolidation phase.
Investment Outlook:
Bullish above: $37.00–$38.00
Upside target: $70.00–$72.00, supported by pipeline innovation + bullish technical setup.
📢 RNA — premium biotech bet with rare-disease focus and breakout momentum.
#RNA #Biotech #Genomics #GrowthStocks #BullFlag #Breakout
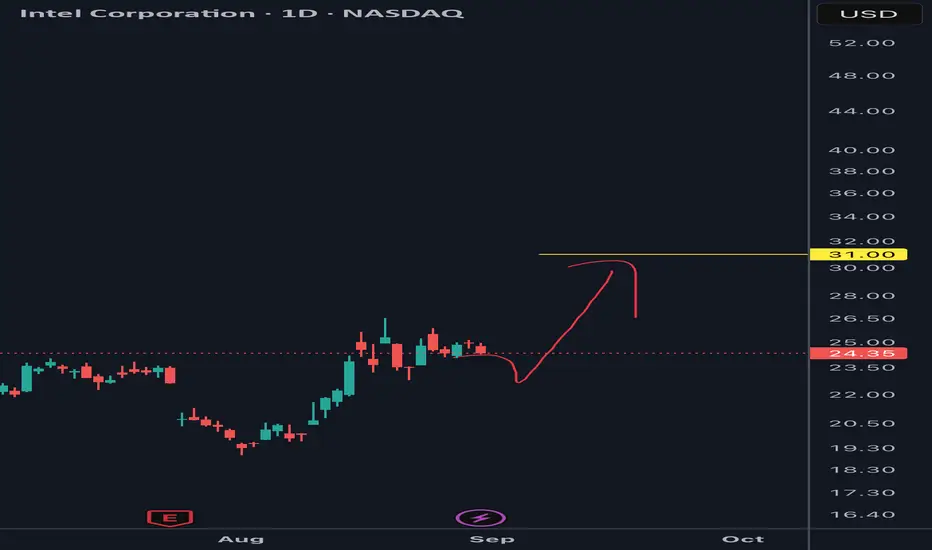
Is Intel about to blow?NASDAQ:INTC
What I expect from Intel in coming weeks
First drop just a little then $30
LBRDA: Fundamental Analysis +41%With 2024 revenue of $ 1.02 billion, Liberty Broadband Corporation is an american communications company. EverStock identifies a fundamental revaluation potential of +41 %.
Valuation at 10.06 x net earnings :
Currently valued at $ 8.74 billions in market capitalization, Liberty Boardband Corporation posted a profit of $ 869 millions in its latest fiscal year (2024).
Balance sheet and debt :
In the company annual report, tangible net asset value stood at $ 8.04 billions, giving a market capitalization / tangible net asset value ratio of 1.09.
The gearing ratio is good, at 0.50. (Total financial debt / net tangible assets valuation).
Current share price: $ 60.67
Target price: $ 85.67
Upside potential: + 41 % (including dividende income)

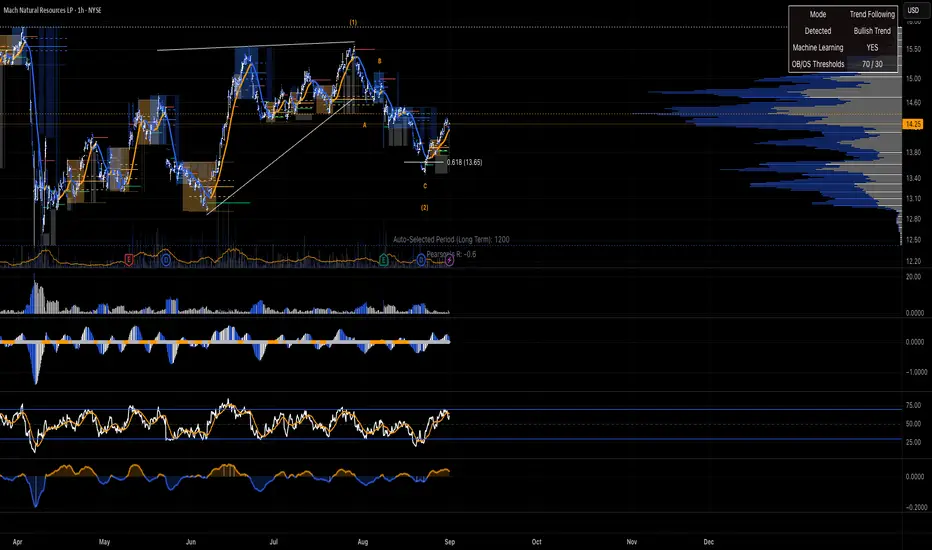
Mach Natural Resources LP $MNR ~ Bulls Inbound...Mach Natural Resources LP engages in the acquisition, development, and production of oil, natural gas and liquids. Its reserves are located in Anadarko Basin, Southern Kansas, and Texas. The company was founded in 2017 and is headquartered in Oklahoma City, OK.
TESLA Bullish Wave C still underway...NASDAQ:TSLA is a tough count, the entire macro chart looks like a complex correction (wave 4?) with many series of 3 wave structures.
A triangle in wave B of the current wave appears complete, leading to a terminal thrust up with a target of the High Volume Node resistance at $410 followed by a poke above the swing high touching the R1 pivot at $548.
RSI remains at the EQ.
Analysis is invalidated below the wave B triangle.
Safe trading

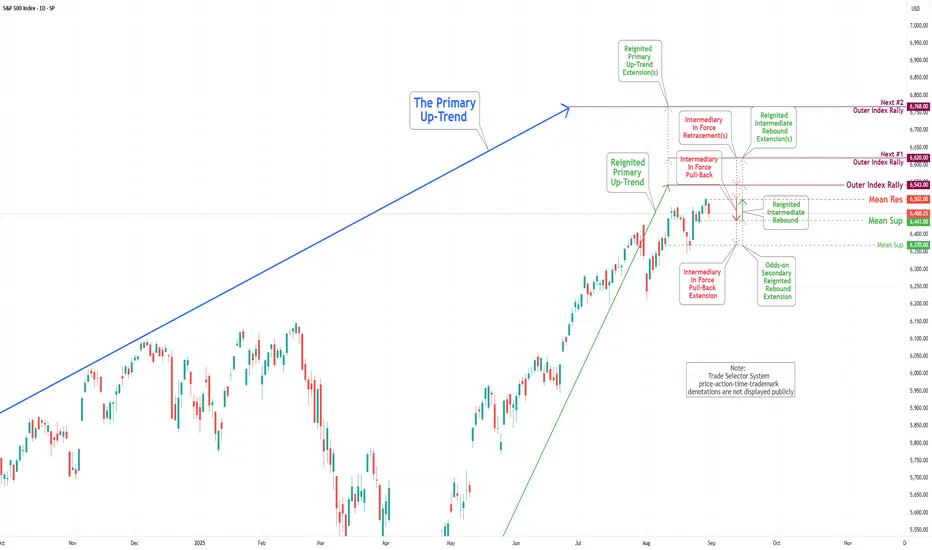
S&P 500 Daily Chart Analysis For Week of August 29, 2025Technical Analysis and Outlook:
During the trading activities of the previous week, the S&P 500 Index demonstrated significant downward price movements before indicating a recovery. It reestablished its upward trend by retesting the Mean Resistance level of 6470 and trading above this benchmark. Following this, the Index exhibited a strong pivot, leading to the establishment of a new Mean Resistance at 6502.
Currently, the objective is to reach our Mean Support target, set at 6441. It is crucial to acknowledge that once this Mean Support level is achieved, there exists a substantial likelihood of a robust rebound aimed at the long-term target, the Outer Index Rally at 6543, facilitated by the Mean Resistance of 6502. Conversely, there is a potential scenario involving a significant pullback to the Mean Support level of 6370, which an odds-on secondary rebound would follow.
MARA Holding Tight!NASDAQ:MARA continues to lag behind the small cap Miners. It is attempting to break through the weekly 200EMA once more after the rejection from the weekly pivot and High Volume Node (HVN) resistance I warned about.
My long term outlook remains up in Elliot wave 3 towards the R% weekly pivot at $66.
The golden pocket and HVN support of the local retracement has yet to be tested as resistance which acts like a magnet for price.
RSI remains at the EQ and price remains just below the channel EQ.
Safe trading

TESLA RISING SUPPORT|LONG|
✅TESLA is trading in an uptrend
Along the rising support line
Which makes me bullish biased
And the pair is about to retest the rising support
Thus, a rebound and a move up is expected
With the target of retesting the level above at 350$
LONG🚀
✅Like and subscribe to never miss a new idea!✅

Micron Technology - The bullrun is not over!⛓️💥Micron Technology ( NASDAQ:MU ) will break out soon:
🔎Analysis summary:
Over the past couple of years, Micron Technology has perfectly been respecting the rising channel pattern. With the current retest of the previous all time high, a breakout becomes more and more likely. Therefore the bullrun will only end with a retest of the channel resistance trendline.
📝Levels to watch:
$125, $180
SwingTraderPhil
SwingTrading.Simplified. | Investing.Simplified. | #LONGTERMVISION

Bitcoin - Will the CME gap be filled?Introduction
Bitcoin has been under consistent downward pressure since it reached its new all-time high, and the market has been struggling to regain momentum. During the past weekend, we saw a notable drop in price that created a CME gap, which also happens to align with the bearish 4-hour fair value gap. Since then, the price has been climbing back up, but the recovery has been slow and cautious rather than explosive. The key question now is whether Bitcoin will continue to rise and fill the CME gap or whether it will lose strength and revisit the recent lows. In the following sections, I will go over the levels and scenarios to watch closely.
Daily FVG bounce
Last week, Bitcoin found support at the daily fair value gap, which acted as a strong demand zone. From this level, the price bounced upward and has been grinding higher ever since. Although this reaction gave some relief to buyers, the pace of the move has been rather sluggish, and momentum remains weak. What traders now need to evaluate is how far this move can realistically extend. The daily FVG provided the initial foundation for this bounce, but the real test will come as the price approaches shorter-term imbalances and resistance areas.
Bullish scenario
For the bullish outlook to play out, Bitcoin needs to hold the current 1-hour fair value gap as support. If this level remains intact, it will signal that buyers are in control of the short-term trend and that the recent bounce has the potential to evolve into a more sustainable rally. In that case, the next logical upside target would be the 4-hour fair value gap, which conveniently aligns with the CME gap left behind last weekend’s drop. Filling this inefficiency would not only provide a technical target for bulls but would also help restore some balance to the market structure.
Bearish scenario
On the other hand, if Bitcoin fails to maintain the 1-hour fair value gap and breaks below it with a clear 1-hour candle closure, the outlook shifts to bearish. This kind of move would create a bearish inversion and serve as confirmation that sellers are regaining control. If this occurs, the probability increases significantly that Bitcoin will revisit its recent lows. In such a case, the market could once again test the demand at the daily fair value gap, and depending on the strength of that support, we could even see deeper retracements.
Final thoughts
Bitcoin is currently at an important crossroads where both bullish and bearish outcomes remain possible. The reaction around the 1-hour fair value gap will provide the clearest signal as to which direction the market is likely to take next. If buyers manage to defend this level, the path toward the 4-hour FVG and the CME gap becomes a realistic target, offering room for a meaningful recovery. However, if sellers push the price below the 1-hour imbalance, then the recent bounce may be nothing more than a temporary relief rally before another leg down. Traders should remain cautious, monitor these key levels closely, and adapt to whichever scenario unfolds.
-------------------------
Thanks for your support. If you enjoyed this analysis, make sure to follow me so you don't miss the next one. And if you found it helpful, feel free to drop a like 👍 and leave a comment 💬, I’d love to hear your thoughts!

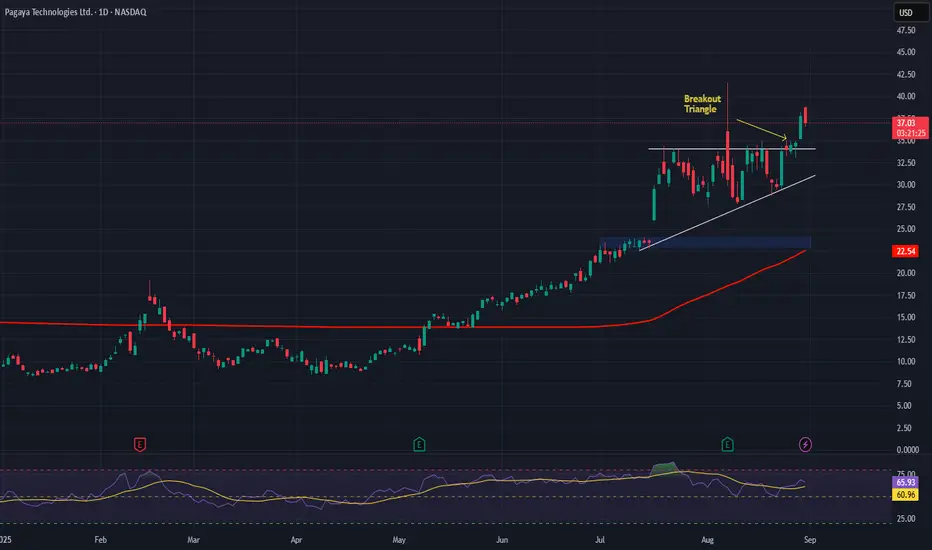
Pagaya Technologies (PGY) AnalysisCompany Overview:
Pagaya Technologies NASDAQ:PGY is a fintech innovator leveraging AI-driven underwriting to scale across consumer credit, real estate, auto financing, and POS lending. Its diversified lending mix reduces reliance on personal loans while expanding growth opportunities.
Strategic Drivers:
Strong Partnerships: Backed by 31 financial institutions, enabling broad origination capacity.
Guidance Upgrade: Management raised 2025 outlook to $10.5–$11.5B in network volume, $1.25–$1.325B in revenue, and $345–$370M in adjusted EBITDA.
Execution Strength: Clear momentum toward becoming a leading U.S. lending platform.
Investment Outlook:
Bullish above: $23–$24.
Upside target: $43–$45, supported by AI-driven lending growth, partnerships, and upgraded guidance.
📢 PGY—AI-powered fintech scaling into a top-tier U.S. lending platform with accelerating revenue and EBITDA growth.
#PGY #Fintech #AI #ConsumerCredit #Lending #GrowthStocks #AutoLoans #POSFinancing