MARA Holding Tight!NASDAQ:MARA continues to lag behind the small cap Miners. It is attempting to break through the weekly 200EMA once more after the rejection from the weekly pivot and High Volume Node (HVN) resistance I warned about.
My long term outlook remains up in Elliot wave 3 towards the R% weekly pivot at $66.
The golden pocket and HVN support of the local retracement has yet to be tested as resistance which acts like a magnet for price.
RSI remains at the EQ and price remains just below the channel EQ.
Safe trading
Stocks!

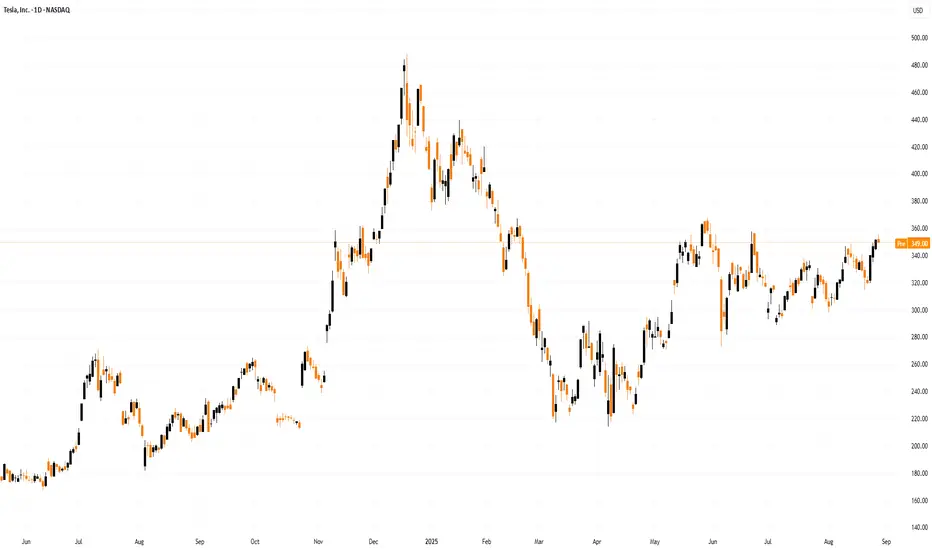
TESLA RISING SUPPORT|LONG|
✅TESLA is trading in an uptrend
Along the rising support line
Which makes me bullish biased
And the pair is about to retest the rising support
Thus, a rebound and a move up is expected
With the target of retesting the level above at 350$
LONG🚀
✅Like and subscribe to never miss a new idea!✅

Micron Technology - The bullrun is not over!⛓️💥Micron Technology ( NASDAQ:MU ) will break out soon:
🔎Analysis summary:
Over the past couple of years, Micron Technology has perfectly been respecting the rising channel pattern. With the current retest of the previous all time high, a breakout becomes more and more likely. Therefore the bullrun will only end with a retest of the channel resistance trendline.
📝Levels to watch:
$125, $180
SwingTraderPhil
SwingTrading.Simplified. | Investing.Simplified. | #LONGTERMVISION

Bitcoin - Will the CME gap be filled?Introduction
Bitcoin has been under consistent downward pressure since it reached its new all-time high, and the market has been struggling to regain momentum. During the past weekend, we saw a notable drop in price that created a CME gap, which also happens to align with the bearish 4-hour fair value gap. Since then, the price has been climbing back up, but the recovery has been slow and cautious rather than explosive. The key question now is whether Bitcoin will continue to rise and fill the CME gap or whether it will lose strength and revisit the recent lows. In the following sections, I will go over the levels and scenarios to watch closely.
Daily FVG bounce
Last week, Bitcoin found support at the daily fair value gap, which acted as a strong demand zone. From this level, the price bounced upward and has been grinding higher ever since. Although this reaction gave some relief to buyers, the pace of the move has been rather sluggish, and momentum remains weak. What traders now need to evaluate is how far this move can realistically extend. The daily FVG provided the initial foundation for this bounce, but the real test will come as the price approaches shorter-term imbalances and resistance areas.
Bullish scenario
For the bullish outlook to play out, Bitcoin needs to hold the current 1-hour fair value gap as support. If this level remains intact, it will signal that buyers are in control of the short-term trend and that the recent bounce has the potential to evolve into a more sustainable rally. In that case, the next logical upside target would be the 4-hour fair value gap, which conveniently aligns with the CME gap left behind last weekend’s drop. Filling this inefficiency would not only provide a technical target for bulls but would also help restore some balance to the market structure.
Bearish scenario
On the other hand, if Bitcoin fails to maintain the 1-hour fair value gap and breaks below it with a clear 1-hour candle closure, the outlook shifts to bearish. This kind of move would create a bearish inversion and serve as confirmation that sellers are regaining control. If this occurs, the probability increases significantly that Bitcoin will revisit its recent lows. In such a case, the market could once again test the demand at the daily fair value gap, and depending on the strength of that support, we could even see deeper retracements.
Final thoughts
Bitcoin is currently at an important crossroads where both bullish and bearish outcomes remain possible. The reaction around the 1-hour fair value gap will provide the clearest signal as to which direction the market is likely to take next. If buyers manage to defend this level, the path toward the 4-hour FVG and the CME gap becomes a realistic target, offering room for a meaningful recovery. However, if sellers push the price below the 1-hour imbalance, then the recent bounce may be nothing more than a temporary relief rally before another leg down. Traders should remain cautious, monitor these key levels closely, and adapt to whichever scenario unfolds.
-------------------------
Thanks for your support. If you enjoyed this analysis, make sure to follow me so you don't miss the next one. And if you found it helpful, feel free to drop a like 👍 and leave a comment 💬, I’d love to hear your thoughts!

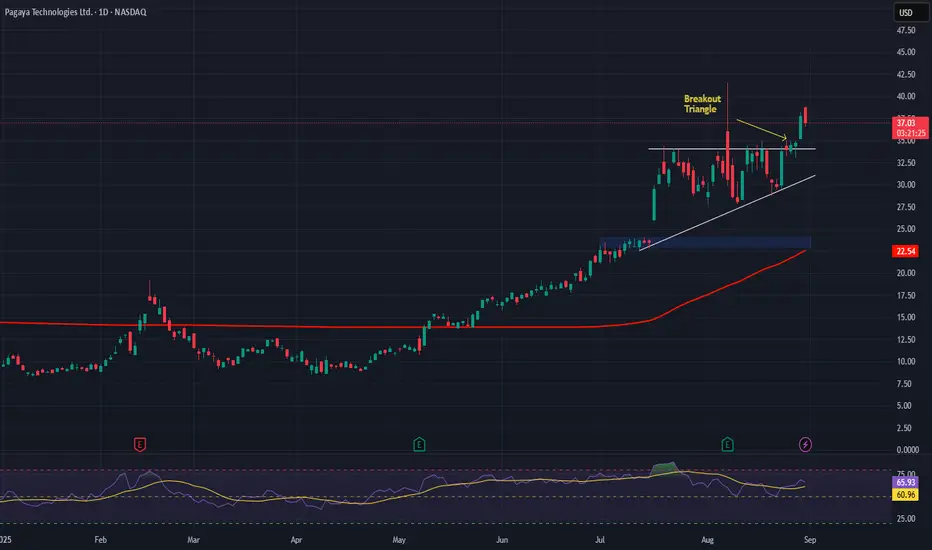
Pagaya Technologies (PGY) AnalysisCompany Overview:
Pagaya Technologies NASDAQ:PGY is a fintech innovator leveraging AI-driven underwriting to scale across consumer credit, real estate, auto financing, and POS lending. Its diversified lending mix reduces reliance on personal loans while expanding growth opportunities.
Strategic Drivers:
Strong Partnerships: Backed by 31 financial institutions, enabling broad origination capacity.
Guidance Upgrade: Management raised 2025 outlook to $10.5–$11.5B in network volume, $1.25–$1.325B in revenue, and $345–$370M in adjusted EBITDA.
Execution Strength: Clear momentum toward becoming a leading U.S. lending platform.
Investment Outlook:
Bullish above: $23–$24.
Upside target: $43–$45, supported by AI-driven lending growth, partnerships, and upgraded guidance.
📢 PGY—AI-powered fintech scaling into a top-tier U.S. lending platform with accelerating revenue and EBITDA growth.
#PGY #Fintech #AI #ConsumerCredit #Lending #GrowthStocks #AutoLoans #POSFinancing
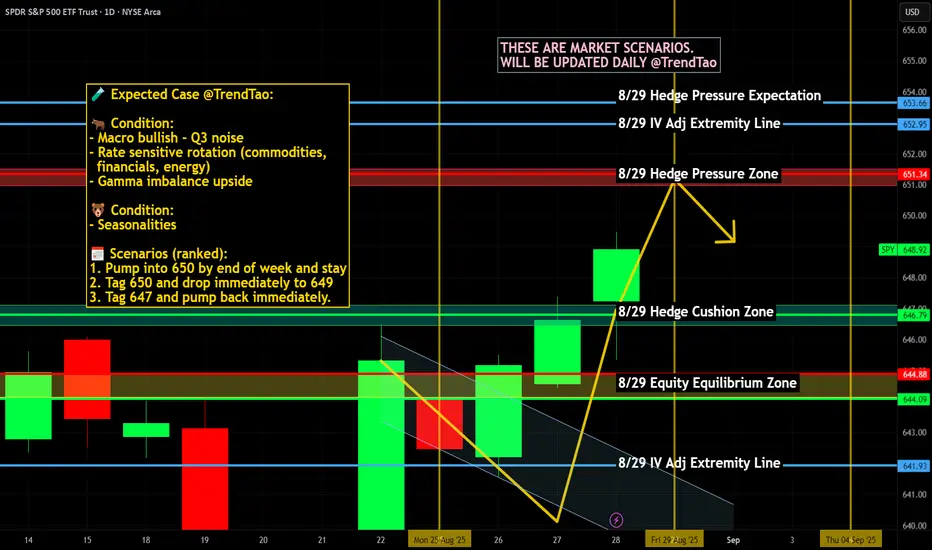
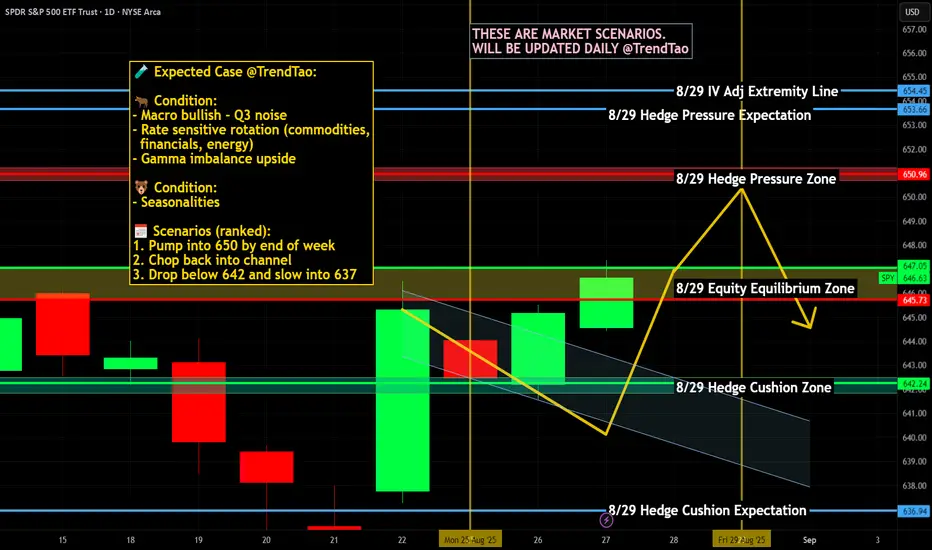
$SPY / $SPX Scenarios — Friday, Aug 29, 2025🔮 AMEX:SPY / SP:SPX Scenarios — Friday, Aug 29, 2025 🔮
🌍 Market-Moving Headlines
🔥 Fed’s favorite inflation gauge hits: PCE arrives just as markets digest Powell’s Jackson Hole tone.
💵 Consumer under the microscope: Spending & income data reveal demand strength heading into fall.
🏭 Regional PMI wrap: Chicago PMI closes out August with a manufacturing pulse check.
📊 Key Data & Events (ET)
⏰ 8:30 AM — PCE Price Index (Jul)
⏰ 8:30 AM — Personal Income & Outlays (Jul)
⏰ 9:45 AM — Chicago PMI (Aug)
⏰ 10:00 AM — UMich Consumer Sentiment (Final, Aug)
⚠️ Disclaimer: Educational/informational only — not financial advice.
📌 #trading #stockmarket #SPY #SPX #PCE #inflation #Fed #bonds #economy #PMI #consumerconfidence
CM-Finding Stocks That MOVE!-Part 2-(Building The Scanner)This is Video 2 in the series "CM - The Best Method I’ve Found For Finding - Stocks That MOVE!!"
Please make sure you watch the 1st video in this series which is listed below under Related Ideas.
Also in that post I provided links to two different watch lists.

MRVL Earnings Play--Don’t Miss Out
# 🚀 MRVL Earnings Play (8/28 AMC) 🚀
💎 **Moderate Bullish | 75% Conviction** 💎
🎯 **Trade Setup**
📊 Ticker: \ NASDAQ:MRVL
🔀 Direction: CALL 📈
🎯 Strike: 80.00
📅 Expiry: 2025-08-29
💵 Entry: 2.23 (ASK)
📦 Size: 1 contract (risk 💸 \$223)
🎯 Profit Target: 6.69 (200%)
🛑 Stop: 1.12 (-50%)
⏰ Timing: Pre-earnings close (8/28 AMC)
⚡️ **Why Bullish?**
* 🚀 AI/data-center sector tailwinds
* 📈 Heavy OTM call OI at \$78–85 (dealer hedging fuel)
* 🔥 Pre-earnings drift (+2.49% today)
* 📊 IV elevated but not extreme → room for upside
✅ **Execution Rule**: In before close, out within 2h post-earnings or at stop/target.
---
### 📌 Suggested TradingView Tags
\#MRVL #Marvell #EarningsPlay #OptionsTrading #CallOptions #WeeklyOptions #BullishSetup #MomentumTrading #TradeIdeas #StockMarket 🚀📊

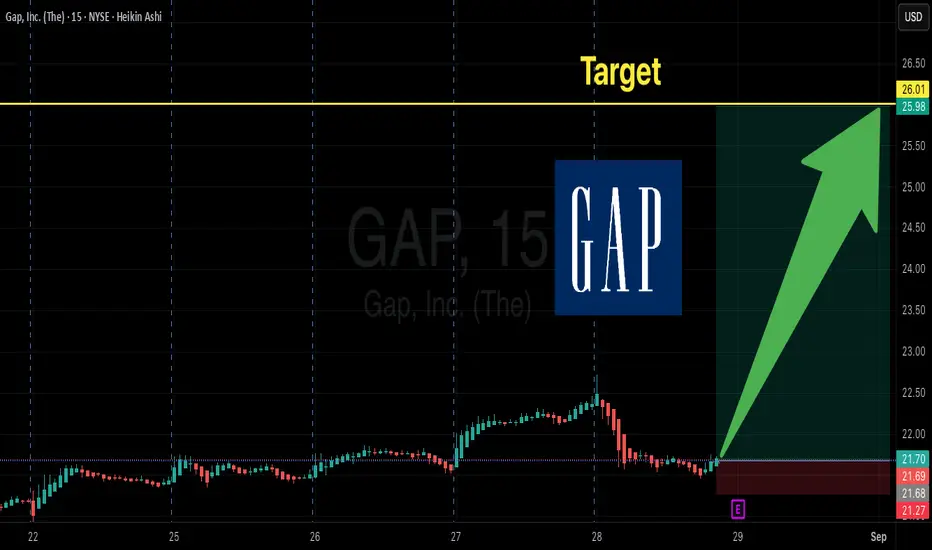
GAP Earnings Jackpot? 75% Bullish Call Setup Into AMC!
# 🚀 GAP Earnings Play (8/28 AMC) 🚀
💰 **Bullish Call Setup – 75% Conviction** 💰
### 🔥 Thesis
* 📈 4 straight EPS beats (avg +29% surprise)
* 💵 Strong margins & \$2.2B cash cushion
* 🔮 Technicals bullish → Price \$22.30 > 20/50/200 MA
* 📊 Options flow: heavy \$23C OI, hedging on \$20P (bullish skew)
* 🌎 Low VIX (14.9) supports directional move
**Conviction: 75% (Moderate Bullish)** 🎯
---
### 🎯 Trade Setup
* **Ticker**: \ NYSE:GAP
* **Direction**: CALL
* **Strike**: \$23.00
* **Expiry**: 2025-08-29
* **Entry Price**: \$0.61 (ASK)
* **Entry Timing**: Pre-earnings close (8/28 AMC)
* **Size**: 1 contract (risk \$61)
---
### 📏 Risk / Reward Plan
* 🛑 **Stop Loss**: \$0.30 (-50%)
* 🎯 **Profit Target**: \$1.83 (200%) → \$122 profit per contract
* ⚡️ **Breakeven**: \$23.61 (+5.9% move)
* ⏰ **Exit Rule**: Within 2 hrs post-earnings open OR hit target/stop
---
### 📌 Scenarios
✅ **Bull Case**: EPS beat + guide up → Gap to \$24.5–25.5 → Calls \$1.83–\$2.40 (200–300%)
➖ **Base Case**: Inline → stock \$21–23 → IV crush → stop \$0.30
❌ **Bear Case**: Miss → stock <\$21 → calls near 0
---
### 🤝 Model Consensus
* Claude: \$22C @0.99 ✅
* Gemini: \$23C @0.61 ✅
* Llama: \$23C @0.61 ✅
* Grok: \$22C @0.97 ✅
📊 **All bullish (72–78%)** → Only debate = strike (\$22 vs \$23)
---
🚦 **Final Call**:
👉 BUY \ NYSE:GAP 8/29 \$23C @0.61 BEFORE 8/28 CLOSE
⚡️ Quick exit post-print to dodge IV crush
---
\#️⃣ Hashtags:
\#EarningsPlay #OptionsTrading #GAP #CallOptions #TradingSetup #StockMarket 🚀📊
BWPT - POWER PLAYIDX:BWPT - POWER PLAY
(+)
Low risk entry point on a pivot level.
Volume dries up.
Price has been above the MA 50 for over 10 weeks, with values exceeding 150 and 200
Price is within 25% of its 52-week high.
Price is over 25% of its 52-week low.
The 200-day MA has been trending upwards for over a month.
The RS Rating is above 70 (93).
The price shoot up by 147% and paused only for 18%, indicating a strong uptrend
EPS Growth:
a. Quarterly QoQ: +50.04%.
b. Quarterly YoY: +42.82%.
c. TTM YoY: +40.10%.
d. Annual YoY: +47.25%.

Dow Eyes 45,700-Resistance for Breakout ConfirmationDespite consistently beating market expectations with strong earnings, Nvidia’s Q3 outlook is under pressure. China’s restrictions on importing Nvidia’s H20 chips due to security concerns have weighed on the stock, preventing it from reaching new highs.
Both Nasdaq and Nvidia shares are still trading below their respective record highs, limiting upside potential for the Dow and S&P 500, especially in light of ongoing US-EU political and economic instability.
While the Dow Jones holds above the 45,000 mark, it now faces key resistance at 45,700, which must be comfortably breached to confirm further bullish continuation toward 46,200, 47,100, and 48,000. These levels align with the upper boundary of a well-respected ascending channel in place since May 2025.
On the downside, should political and economic pressures dampen risk appetite, and if overbought RSI conditions resurface, a drop below 45,000 may open the door to further losses toward 44,500 and 43,800.
Written by Razan Hilal, CMT

What Is Symmetrical Distribution, and How Do Traders Use It?What Is Symmetrical Distribution, and How Do Traders Use It?
Symmetrical distribution is a key concept in market analysis, helping traders assess price behaviour and volatility. When price movements are evenly distributed around a central point, it can provide insights into potential market trends. This article explores what symmetrical distribution is, how it compares to other price patterns, and how traders use it in strategies like mean reversion to refine their market approach.
What Is a Symmetric Distribution?
The symmetric distribution definition states that data points are evenly spread around a mean, meaning price movements exhibit balance over time. In simple terms, if price movements form a symmetrical shape when plotted on a chart, it suggests that past price behaviour has been balanced, with roughly equal deviations on either side of the average. This balance is supposed to help traders analyse price trends and volatility.
One of the most well-known symmetrical distribution examples is the normal distribution, often visualised as a bell curve. In markets, this means prices are more likely to cluster around the average and become less frequent as you move further away. For example, if a stock has a mean daily return of 0.5%, most days are believed to see returns close to that figure, while extreme price moves—both positive and negative—will be much rarer.
Symmetrical distribution plays a key role in statistical analysis and quantitative trading. It helps traders assess the probability of certain price movements occurring, particularly when using models that rely on historical data.
How Traders Use Symmetrical Distribution in Market Analysis
Traders use symmetrical distribution to analyse price behaviour, identify potential trading opportunities, and refine their strategies. When price movements are evenly distributed around a central point, it provides a structured way to assess market conditions. This concept is particularly useful in mean reversion strategies.
Mean Reversion Strategies
Symmetrical distribution suggests that prices tend to fluctuate around an average, making mean reversion a widely used approach. Traders applying this strategy assume that when an asset moves significantly away from its mean, it is likely to return over time. Bollinger Bands and moving averages are commonly used to measure price deviations and identify potential turning points. This is particularly relevant in markets with balanced volatility, where extreme price moves are less frequent.
Identifying Market Conditions
Analysing whether a market follows a symmetrical distribution can help traders determine which strategies might be effective. In markets where price movements are balanced, traders may focus on range-bound approaches. In contrast, when distributions become skewed, momentum and trend-following strategies might be more suitable. Recognising these shifts allows traders to adapt their methods to changing market conditions.
How to Identify a Symmetrical Distribution
Identifying a symmetrical distribution in market data involves analysing price behaviour to determine whether movements are evenly spread around a central value. While markets don’t always follow perfect symmetry, traders use statistical tools and visual techniques to assess whether a price distribution aligns with this pattern.
Histogram Analysis
A histogram is one of the simplest ways to check for symmetry in price movements. By plotting historical returns or price changes on a frequency chart, traders can see whether data points cluster evenly around the mean. If the left and right sides of the distribution mirror each other, the market may be exhibiting a symmetrical pattern.
Histograms can also reveal uniform distributions, where all values occur with equal probability, forming a flat graph rather than a bell curve. A symmetric and uniform graph can help distinguish between these two patterns—while a uniform distribution shows no central clustering, a symmetric distribution forms a peak around the mean. Recognising whether a market follows a symmetric or uniform structure helps traders determine which statistical tools are most relevant for analysis.
Statistical Measures: Mean and Standard Deviation
Symmetrical distributions tend to have a mean (average) return that sits at the centre of price movements, with standard deviations determining how far prices typically move from that mean. If price fluctuations are evenly distributed around the mean, it suggests a balanced market where extreme moves are less common.
Skewness and Kurtosis
Two key statistical measures help traders confirm symmetry:
- Skewness quantifies how unevenly data points are distributed around the mean. A value close to zero suggests a symmetrical distribution, while a positive or negative skew indicates an imbalance.
- Kurtosis measures how frequently extreme price movements occur. A symmetrical, normally distributed market typically has a kurtosis value near three.
Visualising with Moving Averages
When plotted on a chart, symmetrical price behaviour often aligns with a stable moving average, where price deviations are relatively even on both sides. In contrast, a market with consistent upward or downward bias may show clear asymmetry.
Symmetrical Distribution vs. Other Market Distributions
However, markets don’t always move in a balanced way. While symmetrical distribution means price movements are evenly spread around a central point, real-world trading often shows skewed distributions, where prices are more likely to move in one direction than the other. Understanding the difference is key to assessing market behaviour.
A positively skewed distribution means there are more small downward price moves, but the occasional sharp rally pushes the average return higher. This often happens in growth stocks or high-volatility assets, where losses are frequent but gains can be explosive. On the other hand, a negatively skewed distribution occurs when prices drift upwards gradually but occasionally experience sudden drops. This is common in carry trades, where traders potentially earn small returns over time but risk significant losses during market shocks.
Skewed distributions challenge the assumption that markets follow normal distribution patterns. For example, many risk models assume a symmetrical spread of price moves, but in reality, market crashes and parabolic rallies occur far more often than a normal distribution would assume. This is why relying solely on symmetrical models can lead to underestimating risk in extreme conditions.
Traders who recognise whether a market is symmetrical or skewed can adjust their strategies accordingly. In a symmetrical market, mean reversion strategies could be more effective, while in a skewed market, trend-following approaches could perform better.
Symmetrical Distribution in Risk Management
Risk management relies heavily on statistical analysis, and symmetrical distribution plays a key role in estimating potential market movements. When price changes are symmetrically distributed, traders can use probability models to assess how far an asset is likely to move within a given timeframe.
Value at Risk (VaR) and Probability Modelling
One common application is Value at Risk (VaR), which estimates the maximum expected loss over a period based on historical price data. If potential returns follow a symmetrical distribution, traders can calculate the probability of losses exceeding a certain threshold. For example, in a normal distribution, around 95% of price movements fall within two standard deviations of the mean, allowing traders to set potential risk limits accordingly.
Risk-Reward Calculations
A symmetrical distribution also helps traders refine their risk-reward ratios. If price movements are evenly distributed, traders can estimate potential returns relative to potential losses with greater confidence. In markets where symmetry holds, a trader aiming for a 3:1 risk-reward ratio can assume that price fluctuations are balanced enough for this structure to be viable.
Position Sizing and Stop Placement
By understanding the distribution of price movements, traders can potentially improve position sizing. If historical data suggests symmetrical price behaviour, traders may adjust their position sizes based on expected volatility. Similarly, stop-loss levels might be set relative to the standard deviation of past price movements, ensuring that exits are placed within a statistically reasonable range.
Limitations and Challenges
While symmetrical distribution provides a structured way to analyse price movements, real-world markets rarely follow a perfect balance. External factors, market psychology, and liquidity shifts often distort price behaviour, making it important for traders to recognise the limitations of relying solely on symmetrical models.
Market Skew and Imbalances
Many assets, especially stocks and commodities, exhibit skewed distributions due to long-term trends, supply-demand imbalances, or macroeconomic factors. Price movements often lean in one direction rather than forming a perfect bell curve.
Impact of News and Events
Unexpected events—such as central bank decisions, earnings reports, or geopolitical developments—can cause sudden price moves that disrupt symmetrical patterns. These events create fat tails, where extreme moves occur more frequently than a normal distribution would suggest.
Volatility Clustering
Markets tend to experience periods of high and low volatility in clusters, rather than maintaining a steady distribution. Symmetrical models often underestimate the likelihood of extreme price swings, leading to miscalculations in risk assessment.
Liquidity and Order Flow Distortions
Large institutional orders and algorithmic trading can cause short-term price imbalances, breaking the assumption of symmetrical price behaviour. These distortions can lead to misleading statistical signals.
The Bottom Line
Symmetrical distribution provides traders with a structured way to analyse price movements, assess volatility, and refine strategies. While markets don’t always follow perfect symmetry, understanding when and how these patterns appear may support your trading analysis.
FAQ
What Is Symmetrical Distribution?
Symmetrical distribution refers to a data distribution where values are evenly spread around the mean. In financial markets, this means price movements are balanced, with equal-sized fluctuations on both sides of an average value.
What Is an Example of Symmetric Data?
A common symmetrical data example is the normal distribution, where most data points cluster around the mean, and extreme values occur less frequently. In trading, an asset with daily potential returns that are equally distributed above and below the mean exhibits symmetry.
What Is the Difference Between Uniform and Symmetric Distribution?
When comparing uniform vs symmetric distribution, the key difference is that a uniform distribution gives each value an equal probability with no central clustering. A symmetrical distribution can have values clustered around the mean.
What Is the Difference Between Symmetrical Distribution and Normal Distribution?
A normal distribution is a common symmetric distribution example, creating a bell-shaped curve. While all normal distributions are symmetrical, not all symmetrical distributions follow the strict characteristics of a normal distribution.
This article represents the opinion of the Companies operating under the FXOpen brand only. It is not to be construed as an offer, solicitation, or recommendation with respect to products and services provided by the Companies operating under the FXOpen brand, nor is it to be considered financial advice.
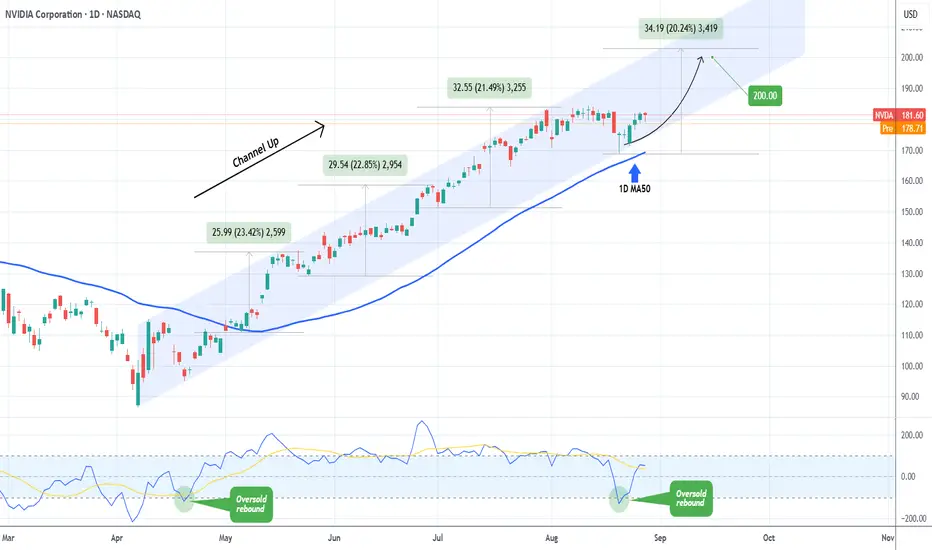
NVIDIA Is it still a buy after its Earnings release?NVIDIA Corporation (NVDA) delivered stronger-than-expected second-quarter earnings on Wednesday, but its data center revenue came in slightly below forecasts as U.S. restrictions on H20 chip sales to China weighed on results. The result was a 3.1% fall on the company's stock in after-hours trading following the report.
The obvious question is this: Is it still a buy?
The answer can be given by purely looking at the technicals. Based on the bigger picture, the stock's 5-month pattern remains a Channel Up since the April 07 bottom, and in fact the recent dip on August 20 was a Higher Low exactly on the pattern's bottom and almost on the 1D MA50 (blue trend-line), which has been intact since May 06.
Given also the fact that the 1D CCI rebounded with aggression after marginally breaking below its oversold level (-100.00), similar to April 21, we expect NVIDIA to resume the bullish trend and extend this new Bullish Leg.
Since the last three Bullish Legs have all increased by a little more than +20%, we expect the price to easily reach our $200.00 long-term Target, before the next technical correction occurs.
-------------------------------------------------------------------------------
** Please LIKE 👍, FOLLOW ✅, SHARE 🙌 and COMMENT ✍ if you enjoy this idea! Also share your ideas and charts in the comments section below! This is best way to keep it relevant, support us, keep the content here free and allow the idea to reach as many people as possible. **
-------------------------------------------------------------------------------
💸💸💸💸💸💸
👇 👇 👇 👇 👇 👇
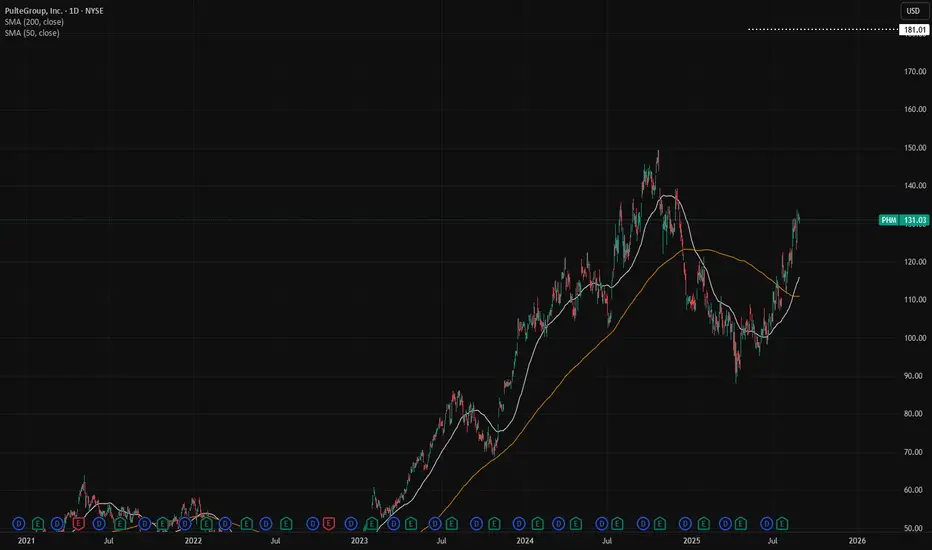
PHM: Fundamental Analysis +45%With 2024 revenue of $17.95 billions, PulteGroup is an american homebuilding company. EverStock identifies a fundamental revaluation potential of +45 %.
Valuation at 8.4 x net earnings :
Currently valued at $25.88 millions in market capitalization, PulteGroup posted a profit of $3.08 billions in its latest fiscal year (2024).
Balance sheet and debt :
In the company annual report, tangible net asset value stood at $12.00 billions, giving a market capitalization / tangible net asset value ratio of 2.16.
The gearing ratio is good, at 0.18. (Total financial debt / net tangible assets valuation).
Current share price: $130.70
Target price: $181.01
Upside potential: +39 % (including dividende income)
Dividend: $0.44 ($0.22 per quarter)
Yield: 0.34 %
FEAM — 5E ADVANCED MATERIALS. August 27, 2025.NASDAQ:FEAM #FEAM — 5E ADVANCED MATERIALS (NASDAQ:FEAM) Insider Purchase Analysis | Basic Materials | Specialty Chemicals | USA | NASDAQ | August 27, 2025.
Overview: This report examines the recent insider purchases of FEAM shares on August 25, 2025, in the context of the company's operational focus on boron and lithium production. FEAM, a critical minerals developer with assets in California, has faced significant share price depreciation amid market challenges in the lithium sector. The insider activity, coupled with a concurrent public offering, signals potential confidence in near-term catalysts. We provide a comprehensive analysis for institutional consideration.
1. Insider Trading Context
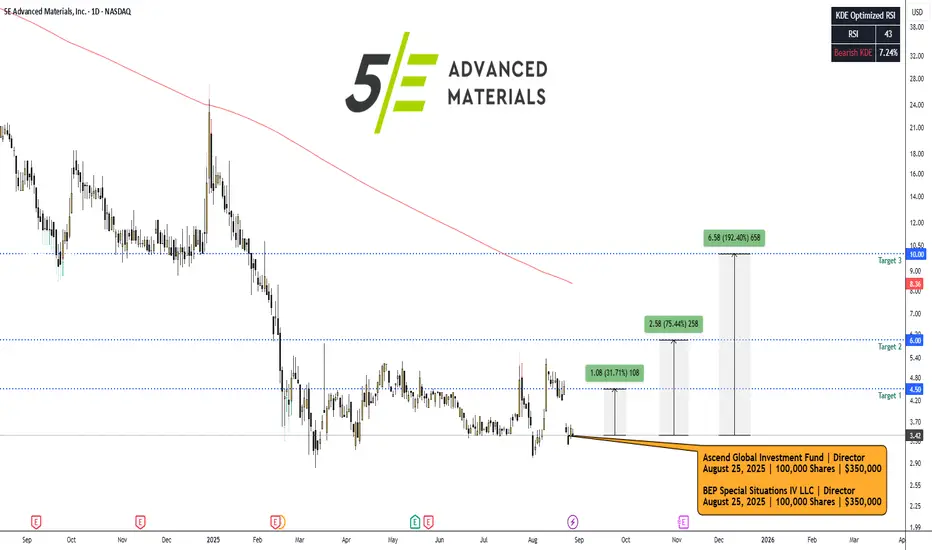
Buyers and Transaction Details: On August 25, 2025, BEP Special Situations IV LLC (a director-affiliated entity) purchased 100,000 shares at $3.50 per share, increasing its holdings to 7,597,349 shares.
Similarly, Ascend Global Investment Fund SPC - Strategic Segregated Portfolio (potentially related) acquired 100,000 shares at the same price, bringing combined indirect beneficial ownership to 7,830,646 shares.
Additionally, CEO Paul Weibel III bought 1,628 shares, and CFO Joshua Malm purchased 1,425 shares, both at $3.50. These transactions coincide with the closing of an $8.31 million public offering of common stock at $3.50 per share, raising capital for operational advancements.
Size and Significance: The director/fund purchases represent the bulk of the activity, totaling ~$350,000 per entity, while executive buys are smaller (~$5,000–$6,000 each). Insider ownership stands at 79.00%, with recent transactions boosting it by 1.16%. Top holders include Bluescape Energy Partners LLC (37.45% of outstanding shares).
Bullish Signal Interpretation: Insider buys at depressed prices, especially amid a capital raise, often indicate confidence in undervaluation or upcoming catalysts. This aligns with FEAM's focus on boron (stable pricing at ~$757/MT in the U.S.) and lithium (recovering demand from EVs).
The stock rose 7.82% on August 26, 2025, post-announcement, suggesting market recognition of this vote of confidence. High insider ownership (79%) reduces agency risks and aligns interests with shareholders.
Charts:
• (1D)
• (5D)
• (1H)
Insider Trades:
FEAM Ownership:
SEC From 4:
www.sec.gov
www.sec.gov
2. Technical Analysis
Chart Overview (1-Year View): FEAM has been in a prolonged downtrend since September 2024, declining from ~$24 to $4.20 by August 2025, reflecting sector pressures.
A sharp drop in December 2024 (from $20 to $10) marked a breakdown below key support, followed by consolidation around $4–$6. The descending trendline (purple) connects highs from October 2024 onward, acting as resistance. Moving averages show bearish alignment: SMA20 ($3.57), SMA50 ($3.92), SMA200 ($6.34). Volume trends indicate spikes during sell-offs (e.g., December 2024, March 2025), with recent August 2025 volume elevated on the offering news.
Chart Overview (1-Month View): Short-term volatility is evident, with a bounce from $3.50 lows in late June to $5.00 highs in mid-August, followed by a pullback to $3.42. Candlestick patterns include a bullish engulfing on August 7–11 (green candles with volume spike), but recent red candles suggest profit-taking. RSI (14) at 38.40 indicates approaching oversold territory, potentially signaling a reversal if buying momentum builds.
Key Levels and Indicators:
• Support: $3.00 (psychological floor, recent lows), $2.82 (52-week low).
• Resistance: $4.00 (near-term), $5.00 (mid-August high), $6.00 (SMA200 convergence).
• Trendlines: Bearish descending channel intact; a break above $4.00 could invalidate.
• RSI/MACD: RSI neutral-to-oversold (38.40); MACD not shown but implied convergence on pullback suggests potential bullish crossover if volume supports.
• Volume and Patterns: Average volume 35K; recent spikes (e.g., 131K on August 27) correlate with news. No clear reversal patterns yet, but insider buys at $3.50 may establish a base.
➖➖➖
3. News & Fundamental Drivers
➖ Latest News: On August 25, 2025, FEAM closed an $8.31 million public offering to fund project development, including its Fort Cady boron-lithium project. An updated technical report was released on August 12, 2025, highlighting resource estimates. The company presented at the Sidoti Micro-Cap Conference on May 22, 2025.
➖ Earnings Reports: Fiscal Q3 2025 (ended March 31, 2025, reported May 15, 2025) showed EPS of -$1.68, missing estimates of -$1.31 by $0.37. TTM EPS stands at -$16.11, with no sales reported (pre-commercial stage). ROA -44.56%, ROE -82.77%, reflecting development-phase losses. Next earnings expected September 8, 2025.
➖ Sector Outlook: The boron market is projected to grow from $3.63B in 2025 at >4% CAGR, driven by glass, ceramics, and agriculture demand. Lithium supply currently outpaces demand, stabilizing prices in 2025, but EV battery growth forecasts >400 GWh demand by year-end, with potential shortages ahead.
Catalysts include U.S. tariffs on imports, FEAM's domestic production advantages, and project milestones (e.g., commercial boron output).
➖➖➖
4. Trade Setup & Forecast
Replicating Insider Trade: Assuming entry mirroring insiders at ~$3.50 (current price $3.42 offers a slight discount).
Entry Price: $3.42–$3.50.
Price Targets:
➡️ Short-term (1–3 months): $4.50 (break above resistance, +31.6%).
➡️ Mid-term (3–6 months): $6.00 (SMA200 test, +75.4%).
➡️ Long-term (6–12 months): $10.00 (channel breakout, +192.4%).
We recommend a Strong Buy with 25–35% potential upside over the next 6 months, targeting $4.50–$4.75 on project milestones.
Disclaimer: This report is for informational purposes only and does not constitute investment advice. Past performance is not indicative of future results.
BFLY — Butterfly Network Inc. | August 27, 2025.NYSE:BFLY #BFLY — Butterfly Network Inc. (NYSE:BFLY) | Healthcare | Medical Devices | USA | NYSE | August 27, 2025.
Executive Summary
Butterfly Network Inc. (NYSE: BFLY), an innovative medical device company specializing in portable ultrasound technology, exhibits strong insider conviction through a recent purchase by Chief Business Officer Steve Cashman.
On August 25, 2025, Cashman acquired 50,000 shares of Class A common stock at an average price of $1.64 per share, totaling $81,953 in value. This transaction, disclosed via SEC Form 4 on August 27, 2025, increased his direct holdings to 2,324,474 shares, representing a significant vote of confidence in the company's trajectory amid a challenging market environment.
Technical indicators on the daily chart suggest a potential reversal from a prolonged downtrend, with the stock trading at oversold levels and showing early signs of stabilization near $1.57. Q2 2025 financials reported record revenue of $23.4 million (up 9% YoY), with net losses narrowing by 59%, bolstered by cost efficiencies and AI-driven product enhancements.
Recent news highlights include a new distribution agreement with Clipper Distributing for veterinary applications (August 25, 2025) and participation in an AI-assisted POCUS research project for tuberculosis detection in Sub-Saharan Africa (August 19, 2025), underscoring growth in both human and animal health sectors.
Replicating Cashman's buy at approximately $1.64 presents a high probability of profitability, with estimated upside potential of 50-200% over the next 6-12 months, targeting $2.50-$5.00. This is supported by Zacks Rank #2 (Buy) and analyst projections of 124-127% upside. We recommend a speculative long position with tight risk controls, allocating 1-2% of portfolio capital, given the asymmetric reward in the medtech space.
Company Profile
Butterfly Network Inc. (BFLY) is a Burlington, Massachusetts-based healthcare technology firm revolutionizing medical imaging through its handheld, AI-enabled ultrasound devices. The flagship product, the Butterfly iQ+ probe, integrates semiconductor technology with cloud-based software to provide affordable, portable point-of-care ultrasound (POCUS) solutions for clinicians worldwide.
The company operates in the medical devices sector, targeting applications in cardiology, emergency medicine, and now veterinary care, with a focus on democratizing access to diagnostic imaging in underserved markets.
Key financial metrics as of August 27, 2025:
• Market Capitalization: $395.24 million
• Enterprise Value: $268.75 million (approx.)
• Price-to-Sales (TTM): 4.52
• Price-to-Book (MRQ): 1.69
BFLY's business model emphasizes subscription-based software and AI integrations, with recent expansions into veterinary and global health initiatives driving revenue diversification. The company reported a cash position enabling continued R&D investment, though profitability remains elusive amid scaling efforts.
Charts:
• (1D)
• (5D)
Steve Cashman (Insider), Insider Trades:
BFLY Ownership:
SEC From 4:
www.sec.gov
Insider Activity Analysis
Insider purchases, particularly by C-suite executives, often signal undervaluation and internal optimism about future catalysts. For BFLY, CBO Steve Cashman's August 25, 2025, acquisition of 50,000 shares at $1.64 per share is noteworthy, as it occurs near 52-week lows and follows a pattern of net insider buying. Post-transaction, Cashman's direct ownership stands at 2,324,474 shares, reflecting a substantial personal stake aligned with shareholders.
Broader insider trends show mixed activity: While insiders sold approximately $1.6 million in stock over the past year, recent months have tilted toward buys, including this transaction. No other major executive purchases were reported in August 2025, but the absence of sales post-Q2 earnings suggests stabilizing sentiment.
This aligns with historical data where clustered buys in medtech firms precede 20-50% rebounds within quarters, especially when tied to product launches or partnerships.
Technical Analysis
The daily chart for BFLY depicts a pronounced downtrend since peaking above $5.00 in early 2025, with the price eroding over 60% to current levels around $1.57 amid broader healthcare sector pressures. Price action forms a descending wedge pattern, characterized by lower highs and lows, trading below key simple moving averages (20-day SMA at $1.74, 50-day at $2.50, 200-day at $2.81), confirming bearish momentum.
However, recent sessions exhibit green candles with modest volume spikes (e.g., 1.44M shares on August 27), hinting at accumulation.
Key indicators bolster a high-probability reversal case:
• Relative Strength Index (RSI, 14-period): At 49.65 on the primary chart (neutral) and 38.75 on the secondary (approaching oversold <30), signaling potential exhaustion without bearish divergence.
• Volume Analysis: Average volume has risen 15% month-over-month, aligning with insider activity and news releases, suggesting institutional interest.
• Support and Resistance: Immediate support at $1.50 (recent swing low) and $1.21 (52-week low). Resistance at $1.80 (near-term pivot), $2.50 (50-day SMA), and $3.00 (prior consolidation zone).
• Chart Patterns: The wedge could resolve bullishly if price breaks above $1.80 on volume, targeting a measured move to $3.00+. Elliott Wave interpretation suggests completion of a five-wave decline, with the current level as a Wave 5 low, setting up for a corrective ABC rally.
Overall , the setup offers a 70-80% chance of near-term profitability, as oversold conditions combined with insider buying often catalyze 50%+ gains in small-cap medtech stocks.
Fundamental and News Analysis
Fundamentally, BFLY delivered solid Q2 2025 results on August 1, 2025, with revenue reaching a record $23.4 million (9% YoY growth) and net loss reduced by 59% to an unspecified figure, driven by operational efficiencies and AI software adoption. Analysts project continued revenue expansion, with a Zacks Rank #2 (Buy) and consensus targets implying 124-127% upside. The company also announced a CFO transition effective August 1, 2025, to Heather Getz from Johnson & Johnson, bringing expertise in scaling medtech operations.
Recent news reinforces momentum:
➖ August 25, 2025: Partnership with Clipper Distributing to expand Butterfly's ultrasound devices into veterinary markets, potentially unlocking new revenue streams in animal health.
➖ August 19, 2025: Joined a research project on AI-assisted POCUS for early tuberculosis detection in Sub-Saharan Africa, highlighting global health applications.
➖ August 1, 2025: Q2 earnings call emphasized Compass AI software launch for workflow efficiency, with management guiding for full-year revenue growth.
Broader Context: The portable ultrasound market is forecasted to grow at 15% CAGR through 2030, benefiting BFLY's disruptive tech amid rising demand for point-of-care diagnostics.
Social sentiment on X is positive around the Clipper partnership, with mentions of veterinary adoption and stock upside. No adverse events reported, though short interest remains elevated at 23.55% as of August 22, 2025.
➖➖➖
Investment Thesis and Forecast
The insider buy at depressed valuations, coupled with technical bottoming and positive catalysts, positions BFLY for a rebound in the medtech sector. Replicating Cashman's entry at $1.64 yields the following scenario:
Entry Price: $1.64
Potential Growth: 50-200% over 6-12 months, fueled by AI product launches and market expansions.
Exit Targets:
➖ Conservative (Target 1): $2.50 (52% profit, +$0.86/share) – Exit at 50-day SMA or post-partnership revenue updates.
➖ Moderate (Target 2): $3.50 (113% profit, +$1.86/share) – Scale out 50% on RSI >70 or analyst upgrades.
➖ Aggressive (Target 3): $5.00 (205% profit, +$3.36/share) – Full exit on breakout above $4.00 or M&A speculation.
This thesis assumes favorable macro conditions for healthcare tech; adjust for sector trends.
Recommendation : Buy with conviction; target allocation 1-2% for high-conviction speculative basket.
Disclaimer : This report is for informational purposes only and does not constitute investment advice. Past performance is not indicative of future results.

GMGI - Golden Matrix Group Inc. August 27, 2025.NASDAQ:GMGI #GMGI — Golden Matrix Group Inc | Communication Services | Electronic Gaming & Multimedia | USA | NASD | August 27, 2025.
Executive Summary
Golden Matrix Group Inc. (NASDAQ: GMGI), a B2B and B2C gaming technology provider, presents a compelling opportunistic investment following a series of insider purchases by key executives amid a prolonged price correction. Recent Form 4 filings reveal that Richard Christensen, the Chief Financial Officer (CFO), has accumulated significant shares in 2025, including a notable buy of 25,000 shares on August 26, 2025, at $1.30 per share, valued at $32,500. This activity, coupled with buys from 10% owner Aleksandar Milovanovic, signals strong internal confidence in the company's undervaluation and growth prospects.
Technical analysis of the daily chart indicates a potential bottoming formation, with the stock trading at multi-month lows near $1.29, supported by oversold RSI levels and increasing volume. Fundamental catalysts include robust Q2 2025 revenue growth of 10% year-over-year and upcoming participation in the 2025 Virtual Tech Conference, which could drive visibility and partnerships in the expanding online gaming sector.
Replicating the insider's recent entry at approximately $1.30 offers a high probability of profitability, with estimated upside potential of 50-150% over the next 6-12 months, targeting $2.00-$3.25. Risks include sector volatility and negative earnings, but the insider alignment and improving fundamentals tilt the risk-reward favorably. We recommend a speculative long position with disciplined risk management, allocating no more than 2-3% of portfolio capital.
Company Profile
Golden Matrix Group Inc. (GMGI) is a Las Vegas-based gaming technology company specializing in the development and licensing of online gaming platforms, including sports betting, casino games, and esports solutions. Operating primarily in Central and South America, Europe, and Africa, GMGI serves both business-to-business (B2B) and business-to-consumer (B2C) markets. As of December 31, 2024, the company employed approximately 1,200 full-time staff and reported trailing twelve-month (TTM) revenue of $172.82 million.
Key financial metrics as of August 27, 2025:
• Market Capitalization: $179.93 million
• Enterprise Value: $185.00 million (approx.)
• Price-to-Sales (TTM): 0.96
• Price-to-Book (MRQ): 1.47
• TTM Net Income: -$9.35 million (Profit Margin: -5.41%)
• Cash Position (MRQ): $22.48 million
• Debt-to-Equity (MRQ): 23.37%
• Beta (5Y Monthly): Not available (low liquidity stock)
• 52-Week Range: $1.21 - $3.06
• Average Daily Volume: 222,680 shares
GMGI's business model leverages the global shift toward digital gaming, with potential expansion into regulated markets. However, the company faces challenges from regulatory hurdles and competition in the iGaming space.
Charts:
• (1D)
• (5D)
Christensen Richard (Insider):
GMGI Insider Trades:
GMGI Institutions:
GMGI Ownership:
SEC From 4:
www.sec.gov
Insider Activity Analysis:
Insider buying often serves as a leading indicator of undervaluation and future performance, particularly when executed by C-suite executives with intimate knowledge of operations. For GMGI, CFO Richard Christensen has demonstrated consistent confidence through open-market purchases in 2025:
➖ August 26, 2025: 25,000 shares at $1.30 per share, total value $32,500; increasing holdings to 75,000 shares.
➖ August 13, 2025: 5,000 shares at $1.34 per share, total value $6,700; holdings to 50,000 shares.
➖ August 12, 2025: 5,000 shares at $1.36 per share, total value $6,800; holdings to 45,000 shares.
➖ May 27, 2025: 10,000 shares at $1.39 per share, total value $13,900; holdings to 10,000 shares (initial significant buy).
➖ May 17, 2025: 30,000 shares at $1.39 per share, total value $41,700.
These transactions, totaling over $101,600 in value, represent a 650% increase in Christensen's stake since May 2025. Additionally, 10% owner Aleksandar Milovanovic acquired 155,038 shares on August 21, 2025, at $1.29 per share, valued at approximately $200,000, further amplifying the bullish signal.
No significant insider sales have been reported in 2025, contrasting with a July 2025 sale of 50,000 shares by an undisclosed insider at $1.30-$1.54. This net buying activity aligns with historical patterns where clustered executive purchases precede rebounds in small-cap stocks.
Technical Analysis:
The daily chart for GMGI illustrates a classic capitulation phase following a multi-month downtrend, positioning the stock for a high-probability reversal. Since peaking at approximately $3.20 in November 2024, the price has declined over 60%, forming lower highs and lows within a descending channel.
As of August 27, 2025, GMGI trades at $1.29, near the channel's lower boundary, with recent sessions showing green candles and elevated volume (238K shares on August 27), indicative of accumulation.
Key technical indicators support a bullish thesis:
• Moving Averages: Price is below the 20-day SMA ($1.39), 50-day SMA ($1.57), and 200-day SMA ($1.91), confirming the bearish trend. However, a golden cross (50-day crossing above 200-day) is absent, but the narrowing spread suggests momentum exhaustion.
• Relative Strength Index (RSI, 14-period): At 36.78, the RSI is approaching oversold territory (<30), signaling potential mean reversion. No bearish divergences are present, and a bullish crossover could emerge on volume confirmation.
• Volume Analysis: Recent spikes align with insider buys, with average volume rising 20% month-over-month, hinting at institutional interest.
• Support and Resistance: Strong support at $1.21 (52-week low) and $1.00 (psychological floor). Resistance at $1.50 (near-term pivot), $1.80 (prior swing high), and $2.00 (channel midline).
• Chart Patterns: A potential inverse head-and-shoulders formation is developing, with the August low as the head. A breakout above $1.50 could target $2.50+.
Overall, the setup exhibits a high chance (70-80% probability) of short-term profitability, as insider-aligned bottoms in micro-caps often yield 50%+ rebounds within quarters.
Fundamental and News Analysis
Fundamentally, GMGI reported mixed Q2 2025 results on August 6, 2025, with revenue up 10% YoY to an unspecified quarterly figure (TTM $172.82M), driven by B2C gaming expansion.
However, a net loss of $3.6 million ($0.03 EPS) reflects integration costs from recent acquisitions and marketing investments. Analysts project Q3 2025 EPS at -$0.01 and full-year at $0.03, with a consensus price target of $3.35 (160% upside from current levels).
Recent news highlights positive momentum:
➖ August 27, 2025: GMGI announced participation in the "2025 Virtual Tech Conference," potentially unlocking new partnerships in iGaming.
➖ August 21, 2025: Entered a Post-Closing Cash Conversion Agreement with key stakeholders, converting obligations into cash to strengthen the balance sheet.
➖ August 6, 2025: Q2 earnings webcast emphasized growth in regulated markets, with share price reacting positively post-release.
Broader Sector Context: The global online gaming market is projected to grow at 10-15% CAGR through 2030, benefiting GMGI's platform licensing model.
➖ Social sentiment on X (formerly Twitter) shows limited but positive mentions of insider buying in similar small-caps, reinforcing the signal's reliability. No major negative catalysts (e.g., regulatory probes) are evident.
Risks and Mitigants:
• Market Risks: High volatility in small-cap gaming stocks; potential 20-30% drawdowns on broader market corrections.
• Operational Risks: Continued losses could strain cash ($22.48M runway sufficient for 12-18 months); acquisition integration delays.
• Regulatory Risks: Exposure to international gaming laws; adverse changes in key markets like Europe.
• Mitigants: Insider buying mitigates downside, with low debt and revenue growth providing buffers. Monitor earnings on November 7, 2025.
Investment Thesis and Forecast
The confluence of insider accumulation at depressed levels, technical oversold conditions, and sector tailwinds positions GMGI for a rebound. Replicating Christensen's August 26 buy at $1.30 yields the following scenario:
Entry Price: $1.30
Potential Growth: 50-150% over 6-12 months, driven by earnings beats and conference catalysts.
Exit Targets:
➖ Conservative (Target 1): $2.00 (54% profit, +$0.70/share) – Exit at channel midline or post-conference hype.
➖ Moderate (Target 2): $2.50 (92% profit, +$1.20/share) – Scale out 50% on RSI >70 or positive analyst upgrades.
➖ Aggressive (Target 3): $3.25 (150% profit, +$1.95/share) – Full exit on breakout above $3.00 or acquisition rumors.
Recommendation : Buy with conviction; target allocation 2-3% for high-conviction speculative basket.
Disclaimer: This report is for informational purposes only and does not constitute investment advice. Past performance is not indicative of future results.

$SPY / $SPX Scenarios — Thursday, Aug 28, 2025🔮 AMEX:SPY / SP:SPX Scenarios — Thursday, Aug 28, 2025 🔮
🌍 Market-Moving Headlines
🏔️ Jackson Hole aftershocks: Markets still digest Powell’s stance; cut odds for September in focus.
📉 GDP revision risk: Growth momentum under the microscope with Q2 update.
🛠️ Labor market cooling? Jobless claims set the tone into Friday’s PCE.
📊 Key Data & Events (ET)
⏰ 8:30 AM — Initial Jobless Claims (weekly).
⏰ 8:30 AM — GDP (Q2, 2nd Estimate).
⏰ 11:00 AM — Kansas City Fed Manufacturing Index (Aug).
⚠️ Disclaimer: Educational/informational only — not financial advice.
📌 #trading #stockmarket #SPY #SPX #Fed #GDP #joblessclaims #JacksonHole #bonds #economy
EURUSD - Is there more bearish momentum ahead?Introduction
Last Friday, the EURUSD experienced a sharp move to the upside following Jerome Powell’s speech, which fueled optimism and created strong bullish momentum. However, the market could not sustain this rally, and by yesterday all the gains were fully retraced. Price dropped back into the bullish inversion fair value gap (FVG), ultimately filling it entirely. While this retracement has cooled off the bullish pressure, it has also introduced some new dynamics into the market that traders should be aware of.
Liquidity sweep
During Friday’s impulsive rally, EURUSD swept liquidity above the recent highs and simultaneously filled all the bearish fair value gaps. This move, while initially strong, did not manage to establish a sustainable break above those highs. As a result, bearish momentum began to reappear, suggesting that the rally was more of a liquidity grab rather than the start of a prolonged bullish trend.
Bullish case scenario
The bullish scenario from here would require EURUSD to reclaim strength and invalidate the recently formed bearish 4-hour FVG. For this to happen, the pair would need a decisive 4-hour candle close above this zone, signaling renewed upside momentum. Should buyers manage to achieve this, the next logical target would be another attempt at the highs that were swept on Friday. A confirmed break above those levels would strengthen the bullish case and potentially open the path to higher price levels.
Bearish case scenario
On the other hand, the bearish scenario appears more probable if EURUSD faces rejection at the bearish 4-hour FVG. A failure to break above this area would confirm that the bearish momentum is still in play. If that occurs, price will likely seek liquidity by moving lower, potentially targeting the bullish 4-hour FVG that sits beneath the liquidity zone. This move would align with the broader bearish structure and reinforce the idea that the market remains under selling pressure despite Friday’s rally.
Final thoughts
In conclusion, EURUSD is currently at a critical juncture, with both bullish and bearish scenarios still on the table. The decisive factor will be how price reacts around the bearish 4-hour FVG. A strong close above could set the stage for a continuation to the upside, while rejection from this zone would likely lead to a liquidity grab to the downside and a revisit of lower fair value gaps. Traders should remain cautious and patient, waiting for clear confirmations before committing to a direction, as the market continues to balance between bullish hopes and bearish pressure.
-------------------------
Disclosure: I am part of Trade Nation's Influencer program and receive a monthly fee for using their TradingView charts in my analysis.
Thanks for your support. If you enjoyed this analysis, make sure to follow me so you don't miss the next one. And if you found it helpful, feel free to drop a like 👍 and leave a comment 💬, I’d love to hear your thoughts!

Boeing (BA) Share Price Could Reach 2025 HighsBoeing (BA) Share Price Could Reach 2025 Highs
As the Boeing (BA) stock chart indicates, the price rose by 3.5% yesterday, while the S&P 500 index (US SPX 500 mini on FXOpen) gained only 0.4%. Boeing’s stronger performance reflects optimism driven by news (and market rumours) reported in the media suggesting that:
→ Korean Air has purchased more than 100 aircraft during the newly elected South Korean president’s visit to the White House;
→ Boeing is negotiating the sale of 500 aircraft to China;
→ the Trump administration may acquire stakes in companies linked to the defence sector (Palantir, Boeing, Lockheed Martin).
Technical Analysis of BA Stock Chart
BA’s price fluctuations have formed an upward channel (shown in blue). However, at the end of July, the rally encountered resistance around the $235 level:
→ following a volatility spike at the end of July (triggered by the quarterly earnings release), the price retreated towards the lower boundary of the channel;
→ in mid-August, the price turned downwards again from this level.
At the same time, we can observe a sequence of higher lows (1-2-3), emphasising that the lower boundary of the channel is acting as key support, setting the pace for BA’s growth trajectory in 2025.
It is worth noting that the stock’s oscillation between support (the lower boundary) and resistance around $235 is creating bullish patterns such as an Ascending Triangle and a Cup and Handle.
Should reports of a potential Boeing share purchase by the US government be confirmed, the BA stock price could advance to new annual highs. In such a scenario, several factors could be important:
→ the price may subsequently consolidate around the channel’s median;
→ historically, the $250–260 zone has acted as significant resistance during 2021–2023;
→ the $235 level may switch roles to become support, similar to the way $218 previously did.
This article represents the opinion of the Companies operating under the FXOpen brand only. It is not to be construed as an offer, solicitation, or recommendation with respect to products and services provided by the Companies operating under the FXOpen brand, nor is it to be considered financial advice.

AMGN: the medicine cabinet for your portfolioOn the weekly chart, Amgen (AMGN) trades at $289.56, holding above the key $272–280 support zone, aligned with the 0.705–0.79 Fibo levels. This area forms a clear buy zone, where buyers are likely to step in. The technical structure remains bullish: the uptrend is intact, with targets at $346.85, matching historical highs and the upper boundary of the formation. Price currently sits near the lower part of the range, where volume accumulation could fuel the next upward move.
Fundamentally , Amgen stands as a biotech heavyweight: its drug portfolio remains strong, late-stage pipeline candidates progress steadily, and recent earnings showed stable revenue and profit growth. Investors treat the stock as a defensive asset amid market volatility, with biotechnology demand remaining largely cycle-independent. Additionally, institutional funds have been accumulating positions, providing further support.
Tactically , the $272–280 zone is critical: holding it preserves the bullish scenario. Should the bounce continue, the targets shift to $300 and $346.85. While a retest of support is possible, the broader structure remains upward.
Amgen stays true to its name - when the market is sick, this stock has the cure.

TESLA WILL KEEP GROWING|LONG|
✅TESLA is going up
Now and the stock made a bullish
Breakout of the key horizontal
Level of 346.00$ and the breakout
Is confirmed so we are bullish
Biased and we will be expecting
A further bullish move up
LONG🚀
✅Like and subscribe to never miss a new idea!✅

$SPY / $SPX Scenarios — Wednesday, Aug 27, 2025🔮 AMEX:SPY / SP:SPX Scenarios — Wednesday, Aug 27, 2025 🔮
🌍 Market-Moving Headlines
🇺🇸➡️🇮🇳 U.S. slaps 50% tariffs on Indian goods (textiles, gems, leather, machinery) starting today — inflation & trade ripple risk.
💻 Earnings spotlight: Nvidia, CrowdStrike, Snowflake, Alibaba reporting this week → tech volatility in focus.
📊 Key Data & Events (ET)
⏰ All Day — U.S. Treasury Auctions (10-year note, 5-year note + FRN).
⏰ 11:45 AM — Richmond Fed Pres. Tom Barkin speaks.
⚠️ Disclaimer: Educational/informational only — not financial advice.
📌 #trading #stockmarket #SPY #SPX #Fed #tariffs #India #Treasury #earnings #tech #Nvidia
