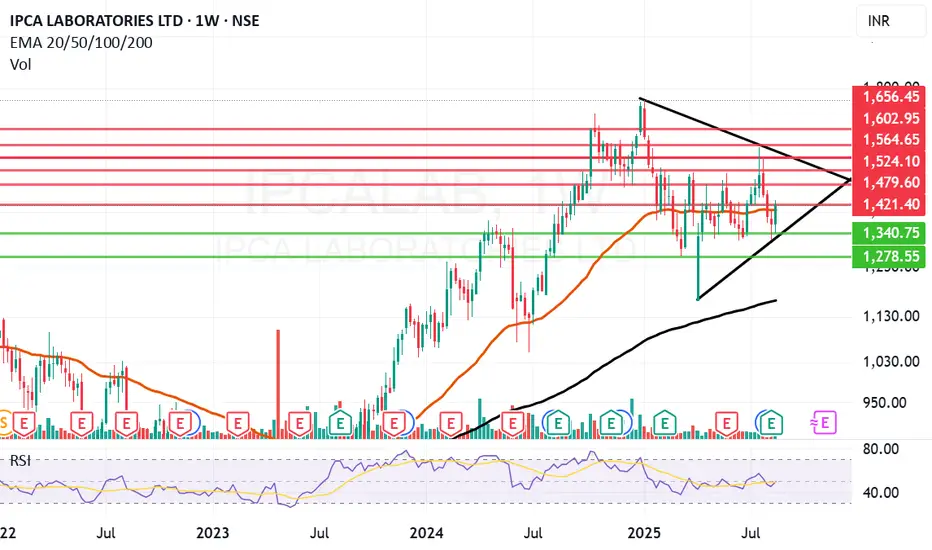
IPCA Labs looking forward to cross a few slabs..Ipca Laboratories Ltd. engages in the manufacturing, marketing, research, and development of pharmaceutical products.
Ipca Laboratories Ltd. Closing price is 1418.40. The positive aspects of the company are Companies with Zero Promoter Pledge, Company with Low Debt, Rising Net Cash Flow and Cash from Operating activity, Annual Net Profits improving for last 2 years and FII / FPI or Institutions increasing their shareholding. The Negative aspects of the company are high Valuation (P.E. = 46.2), Increasing Trend in Non-Core Income, RSI indicating price weakness, Companies with growing costs YoY for long term projects and MFs decreased their shareholding last quarter.
Entry can be taken after closing above 1422 Historical Resistance in the stock will be 1479, 1524 and 1564. PEAK Historic Resistance in the stock will be 1602 and 1656. Stop loss in the stock should be maintained at Closing below 1340 or 1278s depending upon your risk taking ability.
Disclaimer: The above information is provided for educational purpose, analysis and paper trading only. Please don't treat this as a buy or sell recommendation for the stock or index. The Techno-Funda analysis is based on data that is more than 3 months old. Supports and Resistances are determined by historic past peaks and Valley in the chart. Many other indicators and patterns like EMA, RSI, MACD, Volumes, Fibonacci, parallel channel etc. use historic data which is 3 months or older cyclical points. There is no guarantee they will work in future as markets are highly volatile and swings in prices are also due to macro and micro factors based on actions taken by the company as well as region and global events. Equity investment is subject to risks. I or my clients or family members might have positions in the stocks that we mention in our educational posts. We will not be responsible for any Profit or loss that may occur due to any financial decision taken based on any data provided in this message. Do consult your investment advisor before taking any financial decisions. Stop losses should be an important part of any investment in equity.
Stocks!
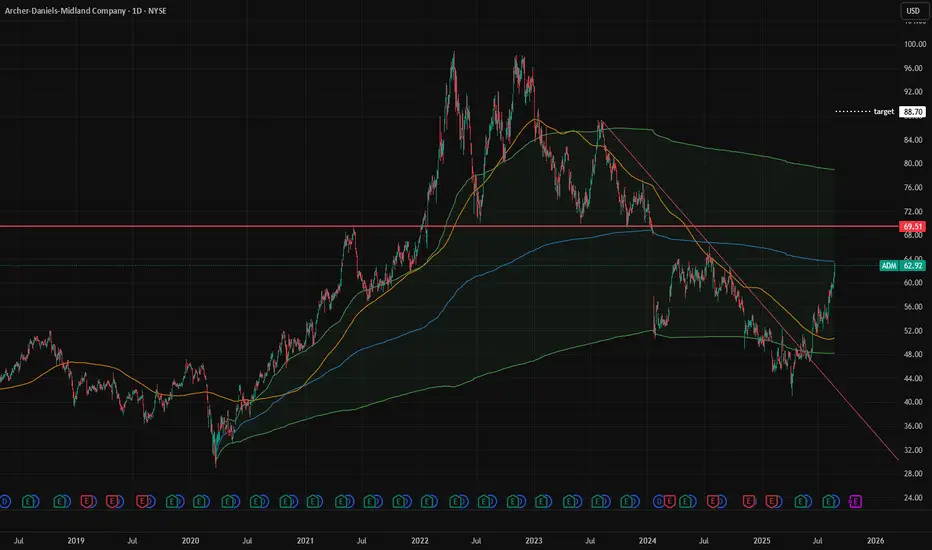
ADM: Fundamental Analysis +41%With 2024 revenue of $ 85.53 billions, Archer-Daniels-Midland is an american agricultural and animal nutrition provider. EverStock identifies a fundamental revaluation potential of +41 %.
Valuation at 16.8 x net earnings :
Currently valued at $ 30.23 billions in market capitalization, Archer-Daniels-Midland posted a profit of $ 1.80 billions in its latest fiscal year (2024).
Balance sheet and debt :
In the company annual report, tangible net asset value stood at $ 15.40 billions, giving a market capitalization / tangible net asset value ratio of 1.96.
The gearing ratio is good, at 0.66. (Total financial debt / net tangible assets valuation).
Current share price : 62.92 $
Target price : 88.70 $
Upside potential : + 41 % (including dividende income)
Dividend : 2.04 $ (0.51 $ per quarter)
Yield : 3.24 %
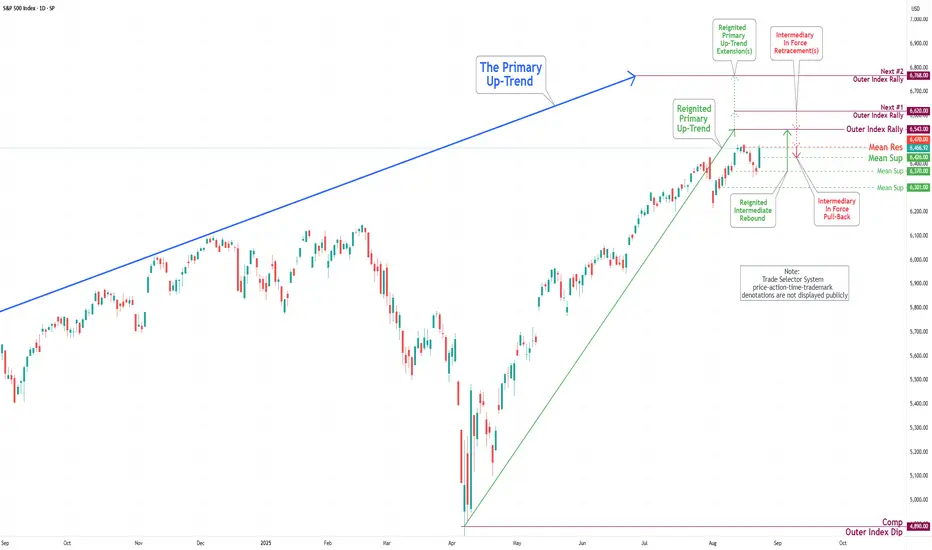
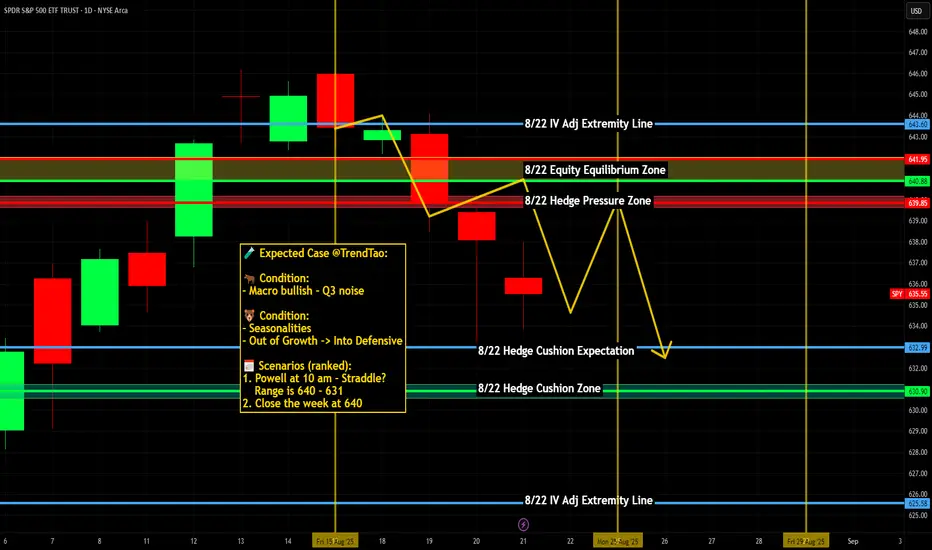
S&P 500 Daily Chart Analysis For Week of August 22, 2025Technical Analysis and Outlook:
During the trading activity of the previous week, the S&P 500 Index experienced significant volatility before reestablishing its strong bullish trend. Initially, the Index faced a substantial decline, reaching our designated target of Mean Support at 6370. Subsequently, it rebounded vigorously, attaining our target of Mean Resistance at 6470, and is currently aiming for the Outer Index Rally target of 6543. It is essential to recognize, however, that there remains a possibility of a decline to Mean Support at 6426 before the upward trajectory resumes.
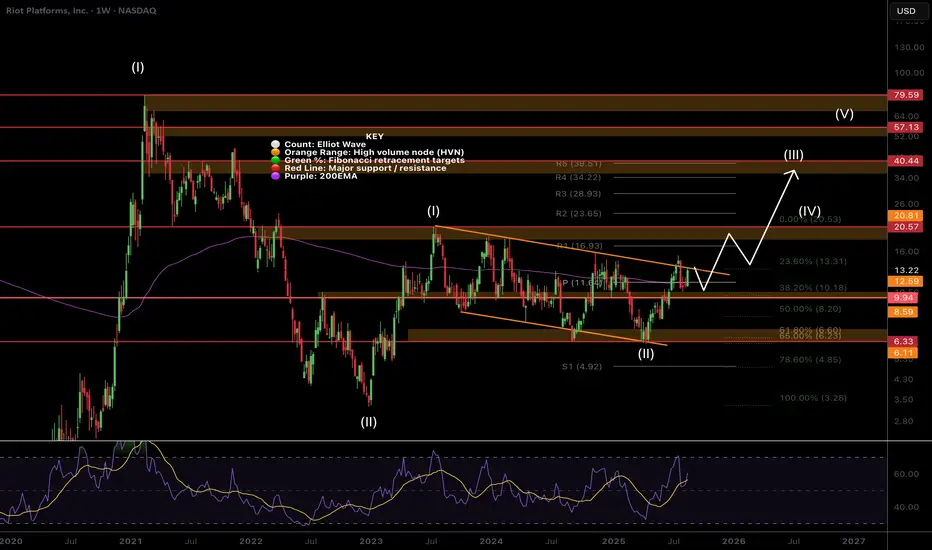
$RIOT Making Moves!NASDAQ:RIOT found support at the areas mentioned last week, the weekly pivot and 200EMA.
Wave (ii) ended at the golden pocket and High Volume node support.
Retesting the descending channel resistance upper boundary again will be the 5th test and a very high probability breakout. This would bring up the first target resistance of the wave (I) swing high and High Volume Node $20.5 followed by $40.
Weekly RSI did hit overbought but this can take months to pay play out and there is no divergence!
Analysis is invalidated below $6.33.
Safe trading
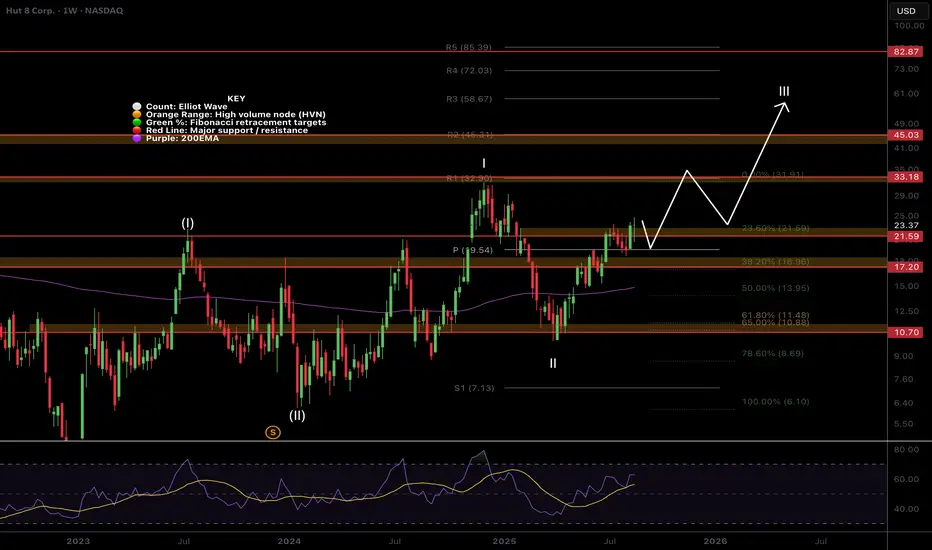
$HUT Clear for take off?NASDAQ:HUT bounced strongly off the weekly pivot retest above the major resistance High Volume Node flipped support.
Path is clear for the weekly R1 pivot target resistance at $33 and a poke above the previous swing high.
Long term cyclical targets remain at the R3 weekly pivot at $61. Weekly RSI is in an uptrend but not yet overbought while weekly RSI is pointing upwards.
Analysis is invalidated below $10.7
Safe trading
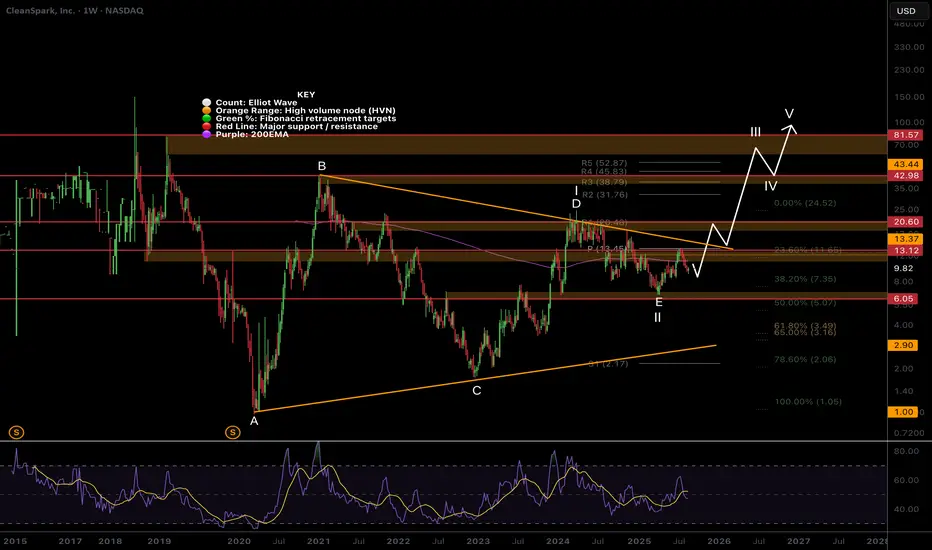
$CLSK Looks like XRP at $0.4 before the move to $3NASDAQ:CLSK is hated right now as much as XRP was when it ranged between $0.4-$0.8 for 4 years before it when ballistic.
CRYPTOCAP:XRP printed a huge macro triangle similar to what I have identified here for CLSK which looks complete at the triangle EQ, where wave E is expected to terminate! This finds confluence with the High Volume Node and 0.5 Fibonacci retracement.
Quadruple resistance lies ahead of the weekly 200EMA, major High Volume Node, weekly pivot point and descending resistance boundary, tested multiple times weakening the point. This built up pressure could provide an explosive move to price discovery.
I have left my alternative motif wave count on their as a secondary count (1-2) with similar targets.
RSI is at the channel EQ so plenty of upside left.
Analysis is invalidated below $6.05.
Safe trading
$BTDR Pressure Building?NASDAQ:BTDR still appears to be in a wave 2 triangle building pressure for a significant wave 3 up into price discovery.
Wave (II) found support a the golden pocket, shallower than the other miners! Price has tested the upper boundary of the triangle and High Volume Node multiple times at $15 and only once at the bottom threshold hinting at a breakout upwards. Each test makes the boundary weaker.
The weekly pivot point at $17 is the first area of resistance to watch followed by the all time high at $25
Analysis is invalidated below $6.44. RSI is only at the EQ so has room to grow.
Safe trading

BNC - Where Cycles Meet Opportunity!In our last updates, we tracked how BNC NASDAQ:BNC shifted momentum and entered a bullish structure. Now, price is consolidating at a key support zone, a normal phase in bigger cycles, while the fundamentals continue to strengthen behind the scenes.
📊 Technical Analysis
- Cyclic rhythm: Price continues to respect cyclical lows (highlighted in green), suggesting we’re in a repeating accumulation/rebound structure.
- Support in play: The $20 - $21 level is being tested again, with the stronger $15 support zone still intact as a line in the sand for bulls.
- RSI confluence: Momentum indicators (RSI) are once again dipping into oversold territory, just as they did at the last local low, hinting at potential buyer re-entry.
- 200 MA: Price is sitting near the 200-period MA, adding another layer of dynamic support to watch.
If bulls hold the $20 area, we could see another cyclical rebound play out, targeting higher highs in the weeks ahead.
💡 Bigger Picture
What makes BNC stand out isn’t just its bold BNB strategy — it’s the timing . The crypto market is maturing, yet most U.S. investors are still locked out of direct BNB exposure. ETFs and sovereign funds are circling, but haven’t moved yet.
That means BNC is positioning itself ahead of the institutions - offering retail investors the rare chance to front-run Wall Street. It’s the kind of countercultural setup that often leads to the biggest asymmetrical gains: buy before the herd, hold before the headlines.
📌 Previous BNC analysis is attached for context.
➡ ️ Talk to your financial advisor and start your due diligence on CEA Industries (NASDAQ: BNC) before the institutions move in.
📚 Always follow your trading plan => including entry, risk management, and trade execution.
Good luck!
All Strategies Are Good, If Managed Properly.
~ Richard Nasr

GH 3D: breakout forming inside ascending channelThe price of GH continues consolidating within the top of an ascending channel, confirming bullish structure. The rectangular accumulation has lasted for over three months, with price staying above all major EMAs and MAs - a strong trend confirmation. On the last impulse, volume increased, and now the price is compressing again. A breakout with a retest would serve as a valid entry. First target lies near 61.38, second at 73.66, and third at 87.37 - aligned with the upper range of the medium-term Fibonacci extension. Fundamentally, GH remains a promising biotech pick amid sector rotation and potential Fed easing. EMAs and MAs sit below price, and D/A supports the breakout scenario. Waiting for confirmation before entering.

Lemonade Inc.: Breakout in Motion — Cup, Flag, and No BrakesLemonade Inc. (LMND) is accelerating after a clean breakout from a textbook cup with handle pattern, where the handle formed as a tight bullish flag. The breakout occurred around $32, and since then, price action has been sharp, controlled, and uncorrected — currently trading at $42.42 with buyers clearly in charge.
On the fundamental side, LMND is moving through a recovery phase: operational losses are narrowing, revenue is stabilizing, and the company is aggressively leveraging AI to automate its insurance processes. Expansion into Europe continues, and institutional interest is visibly rising — confirmed by volume building alongside price. Within the insuretech sector, LMND is starting to look like a comeback story rather than a cautionary tale.
Technically, the setup remains strong:
– Golden Cross confirmed (EMA50 crossing EMA200)
– EMA50/100/200 all below price — bullish structure firmly intact
– Volume expanding on up-days — healthy confirmation
– RSI hovering in the 60–65 range — momentum is intact, no signs of exhaustion
Targets remain aligned with the structure:
– tp1 = $64 — measured move from the flag
– tp2 = $94 — full realization of the cup pattern
Tactically, this is no longer a “wait and see” setup — the move is in progress. No correction so far, only continuation. Momentum traders may consider entries into strength. Above $45, the move could accelerate further as more participants recognize the structure.
LMND is showing technical and fundamental alignment — confirmed breakout, improving narrative, and strong trend structure. While the impulse holds, this chart favors continuation, not hesitation.

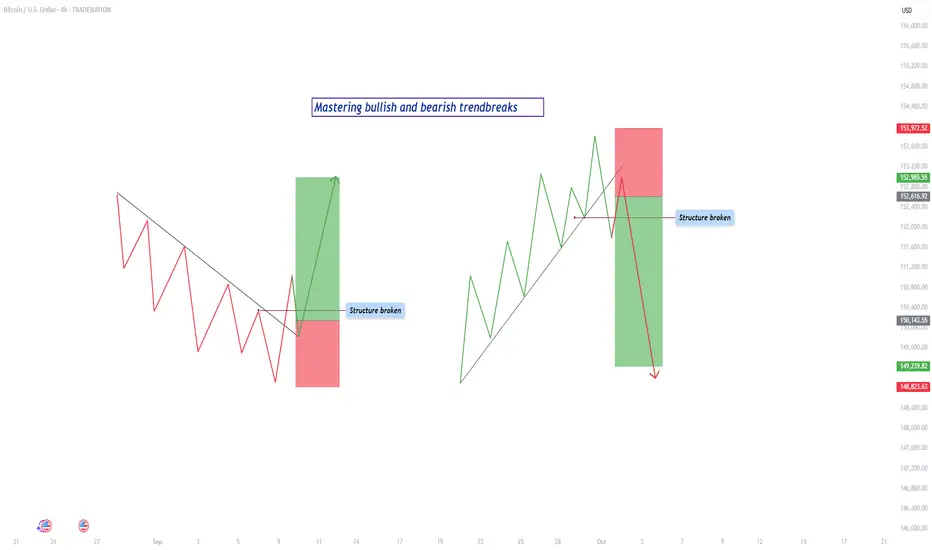
Mastering trendbreaks - How to trade it?In this guide will the trendbreaks be discussed. The following subjects will be explained:
- What is a trend?
- What is a bearish trendline break?
- What is a bullish trendline break?
- How to trade a trendbreak?
- Example
What is a trend?
A trend is the backbone of price action in any market. It represents the general direction in which price is moving over a sustained period of time. When price is consistently creating higher highs and higher lows, the market is considered to be in an uptrend. This behavior shows that buyers are in control and are willing to keep paying higher prices with each wave. On the other hand, when price continues to make lower highs and lower lows, the market is in a downtrend. This shows that sellers dominate the market and buyers are unable to push price above previous levels. Understanding trends is essential because it gives traders a framework for anticipating what is most likely to happen next, rather than guessing in random price action.
What is a bearish trendline break?
A bearish trendline break takes place when an established uptrend begins to lose momentum. In an uptrend, price usually respects a rising trendline, bouncing off it multiple times as buyers defend the bullish structure. Eventually, there comes a point when the market can no longer sustain this strength. Price breaks down through the rising trendline, signaling potential weakness. However, the true confirmation of a bearish shift only happens once the market also breaks below the most recent higher low. This is the key moment where structure changes. What was once a sequence of higher highs and higher lows now transforms into lower highs and lower lows, showing that sellers are gaining control. Without this structural shift, the break of the trendline alone might just be a temporary pullback or a false signal.
What is a bullish trendline break?
A bullish trendline break is the mirror image. In a downtrend, price respects a falling trendline as it consistently makes lower highs and lower lows. Each rally upward fails to break past previous highs, confirming sellers’ control. Eventually, price surges and breaks above the falling trendline. Just like with a bearish break, this initial move is not enough on its own. The true sign of reversal comes when price also breaks above the most recent lower high. This action destroys the existing bearish structure, which relied on lower highs to remain valid. Once that lower high is broken, the market shows that buyers have taken back control and a potential uptrend may begin.
How to trade a trendbreak?
For a valid trendbreak, three conditions must come together. First, the price must break the trendline itself, either rising or falling depending on the direction of the trend. Secondly, the breakout needs to be with strong volume. lastly, the price must also break the most recent higher low in an uptrend or lower high in a downtrend. Without this structural break, what looks like a reversal may only be a correction before the market resumes in its original direction. This distinction is crucial because many traders enter too early on a simple trendline break, only to get caught when the market snaps back into the trend. The combination of both the trendline break and the structural break provides much stronger confirmation.
Trading the trendbreak is where discipline and patience make the difference between success and failure. When the structure has been broken, it is tempting to enter immediately in the direction of the new move. But the higher-probability entry usually comes from waiting. Price often pulls back after a break, returning to retest the broken level. This retest can take different forms. Sometimes price simply returns to the broken higher low or lower high and uses it as support or resistance. Other times, price fills what traders call a fair value gap (fvg), which is an imbalance left on the chart when price moves too quickly in one direction without much trading in between. By waiting for this retest, a trader enters at a better price, with a tighter stop loss and greater profit potential.
Example
For example, imagine the market in an uptrend. Price respects a rising trendline until it finally breaks through it. Shortly after, the market breaks below the most recent higher low, confirming the bearish trendbreak. Instead of selling right at the break, the disciplined trader waits. Price pulls back upward to retest the broken higher low, which now acts as resistance. At that moment, the trader sells with a stop loss just above the retest level and targets the next support or previous swing low. This provides a controlled risk and larger potential reward.
The same logic applies to a bullish trendbreak. Price in a downtrend breaks above the falling trendline, then pushes higher to break a lower high, flipping the structure bullish. Price later dips back down to retest the broken lower high or fills a fair value gap. When it holds and begins to rise again, the trader enters long, with a stop below the retest and a target at the next resistance level.
By combining awareness of trendlines, structural shifts, and retest opportunities, traders can filter out false signals and position themselves to catch the early stages of new trends. The trendbreak is not just about spotting the first sign of weakness or strength, but about confirming that the underlying structure has truly changed. This approach gives a trader clarity, consistency, and confidence in execution, making trendbreaks one of the most powerful tools for price action trading.
-------------------------
Disclosure: I am part of Trade Nation's Influencer program and receive a monthly fee for using their TradingView charts in my analysis.
Thanks for your support. If you enjoyed this analysis, make sure to follow me so you don't miss the next one. And if you found it helpful, feel free to drop a like 👍 and leave a comment 💬, I’d love to hear your thoughts!
DHI: Fundamental Analysis +45%With 2024 revenue of $ 36.80 billions, D. R. Horton is an american homebuilding company. EverStock identifies a fundamental revaluation potential of + 45 %.
Valuation at 10.1 x net earnings :
Currently valued at $ 48.26 millions in market capitalization, D. R. Horton posted a profit of $ 4.76 billions in its latest fiscal year (2024).
Balance sheet and debt :
In the company annual report, tangible net asset value stood at $ 25.15 billions, giving a market capitalization / tangible net asset value ratio of 1.92.
The gearing ratio is good, at 0.24. (Total financial debt / net tangible assets valuation).
Current share price: 161.87 $
Target price : 235.36 $
Upside potential : + 45 % (including dividende income)
Dividend : 1.60 $ (0.40 $ per quarter)
Yield : 0.99 %

Bitcoin - Can the bulls defend this support?Introduction
After reaching its all-time high, Bitcoin has faced strong rejection, falling from $124.5k down to $113k with notable bearish volume behind the move. On this downward path, several four-hour bearish Fair Value Gaps (FVGs) were left open, signaling areas of inefficiency that the market may look to revisit. At present, Bitcoin is testing a critical support zone formed by overlapping daily and four-hour FVGs. This support level is of particular importance because holding it could provide the foundation for renewed bullish momentum and a potential recovery in price action.
Bullish scenario
For the bullish case to unfold, Bitcoin must successfully maintain support in the $111.2k to $112.7k range, which represents the current four-hour FVG. This zone serves as a pivotal point where buyers need to defend price in order to keep upward potential intact. If the market stabilizes here, the next logical target will be the four-hour bearish FVG just above. In order to confirm strength, Bitcoin would need to close a clear four-hour candle above this resistance, effectively flipping it into support. Should that occur, it opens the door for price to climb toward the $120k region, a level that would reintroduce confidence among bulls and suggest that the broader trend could still have room for continuation.
Bearish scenario
On the other hand, the bearish scenario becomes more likely if Bitcoin fails to defend the $111.2k to $112.7k four-hour FVG and instead flips this zone into resistance. While a breakdown below this area would be concerning, there is still the possibility of a short-term bounce. In such a case, price could retrace back upward toward the bearish four-hour FVG at $114.7k before facing another critical test. If Bitcoin rejects strongly from that zone and subsequently breaks below $111.2k, the market could experience further downside pressure, potentially setting up a deeper correction. This would reinforce the dominance of the ongoing downtrend that has followed the rejection at the all-time high.
Final thoughts
Bitcoin remains in a pronounced downtrend after its sweep of the previous all-time high, yet it currently sits at a strong support level that offers a chance for recovery. The market’s reaction to this support area will play a decisive role in determining whether a rebound toward $120k is achievable or whether a deeper decline is imminent. The four-hour FVG around $114.7k stands out as a key battleground between bulls and bears. If buyers can reclaim and hold this level, momentum could shift back in their favor, but if sellers defend it and force price lower, the bearish trend is likely to persist.
-------------------------
Disclosure: I am part of Trade Nation's Influencer program and receive a monthly fee for using their TradingView charts in my analysis.
Thanks for your support. If you enjoyed this analysis, make sure to follow me so you don't miss the next one. And if you found it helpful, feel free to drop a like 👍 and leave a comment 💬, I’d love to hear your thoughts!

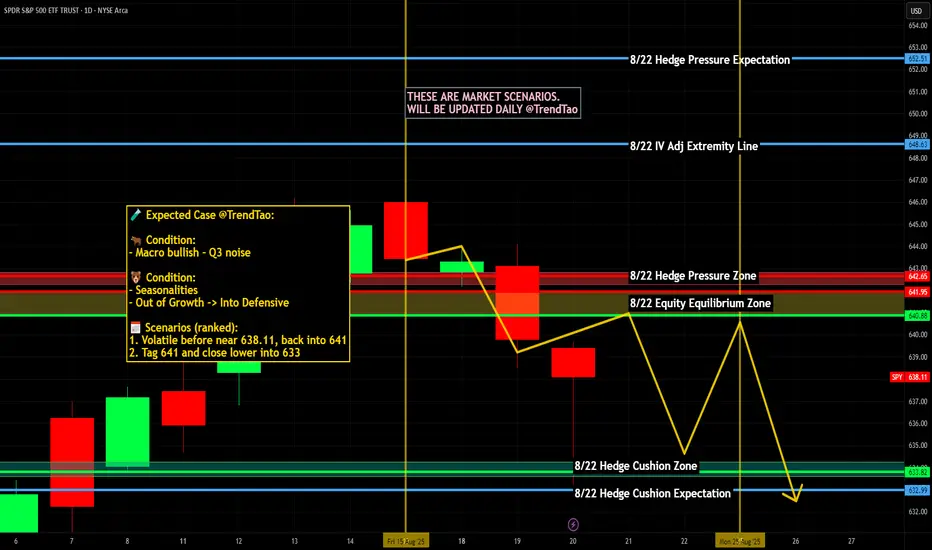
Nightly $SPY / $SPX Scenarios for Friday, August 22, 2025🔮 Nightly AMEX:SPY / SP:SPX Scenarios for Friday, August 22, 2025 🔮
🌍 Market-Moving News
Powell’s Jackson Hole keynote is the main event (10:00 AM ET). Markets want clarity on the path to cuts and any framework tweaks; the Fed’s own calendar lists the speech and KC Fed confirms the Aug 21–23 agenda. $SPY/$TLT/ TVC:DXY are the most sensitive.
Risk tone turned cautious into the speech. Stocks faded Thursday as traders de-risked ahead of Powell; positioning is tight and headline-sensitive.
Dollar firm / gold steady into Jackson Hole. Classic pre-keynote safety bid; futures price a high probability of a September cut, keeping two-way risk for rates and equities.
Global cues: Japan CPI lands overnight; UK retail sales postponed. Japan’s July inflation print hits before U.S. cash open; the U.K.’s July retail sales were pushed to Sep 5, trimming one macro catalyst from the tape.
📊 Key Data & Events (ET)
10:00 AM — Fed Chair Powell @ Jackson Hole (Keynote). Why it matters: Sets near-term curve path and risk appetite; watch $TLT/ TVC:TNX and TVC:DXY → AMEX:SPY reaction.
1:00 PM — Baker Hughes U.S. Rig Count. Why it matters: Energy activity → supply expectations → $CL_F/ AMEX:XLE ; persistent rig drift can nudge inflation expectations. (Released weekly at noon CT/1 PM ET.)
Overnight — Japan CPI (Jul). Why it matters: Yen rates and global FX spillovers; a surprise could ripple into U.S. risk before the keynote.
All day — Jackson Hole Symposium continues. Why it matters: Secondary speakers can color post-Powell reaction as positioning resets.
⚠️ Disclaimer: Educational/informational only — not financial advice.
📌 #trading #stockmarket #SPY #SPX #Fed #JacksonHole #Powell #DXY #TLT #Gold #Energy #RigCount
NYSE - Short | Disaster ImminentStocks continue to struggle, as economic reality rapidly sets in.
Of all the indexes, the NYA (NYSE) is the most telling, in my view.
To that end, I really don't have much to say, other than this is a beautiful bearish formation, with the economic backdrop to support a short-thesis.
Bank losses are beyond anything this world has ever seen, credit defaults are skyrocketing (and holding new highs), bankruptcies have surpassed covid levels, crypto fraud is completely out of control, and wars are raging on 3 continents.
The only question now is how deep will it go and how quickly will / to what extent will the federal government intervene?
Expect a couple years of deterioration to the downside.
Good luck and godspeed!

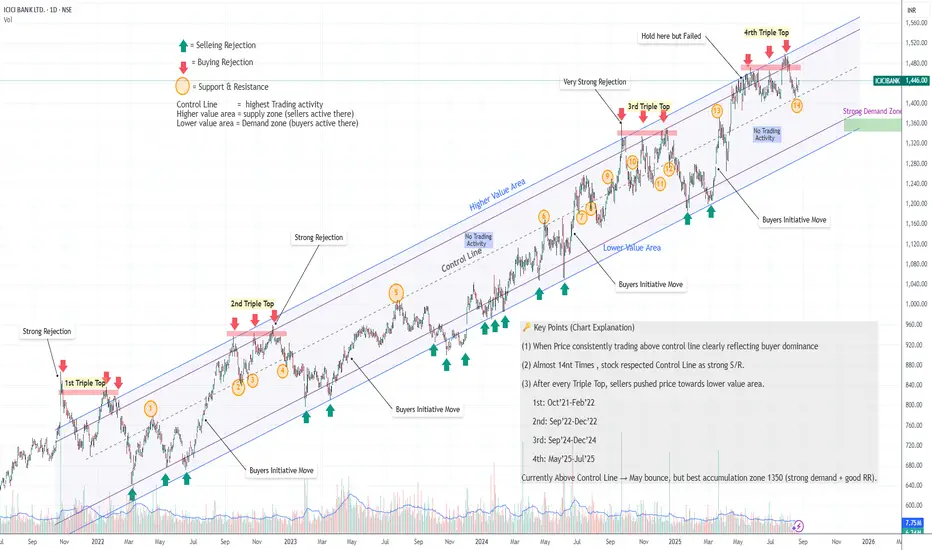
“ICICI Bank – Triple Tops Rejected, Demand Zone in Focus”🔑 ICICI Bank – Key Technical Points
📌Multiple Times → Control Line acted as S/R (around 14nth Times)
price respected the Control Line – price took support & resistance near Control Line → confirms its importance.
📌 Repeated Triple Tops → Seller Pressure
Every time the stock formed a Triple Top, sellers pushed it down towards the lower value area.
🔺 1st: Oct’21 – Feb’22
🔺 2nd: Sep’22 – Dec’22
🔺 3rd: Sep’24 – Dec’24
🔺 4th: May’25 – Jul’25
📌 Current Situation
Price is trading near the Control Line → short-term bounce is possible here but Don't forget Triple top recently forming here.
📌 Demand Zone (Near 1350 or Lower Vale area)
The strongest buying opportunity lies in this zone at 1350 – historically a key demand area offers the best risk–reward setup.
No indicator, no oscillator, No Moving Average, No Fundamental factor included: - Theory is just based on Price action breakdown.
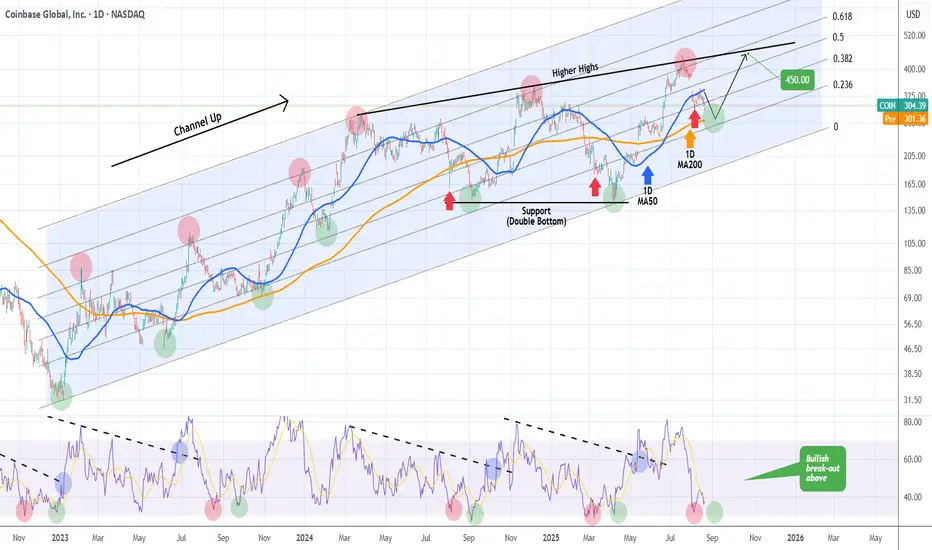
COINBASE about to issue a massive buy signal.Last time we looked at Coinbase (COIN) was more than 3 months ago (May 07, see chart below) where we gave a strong buy signal on its 1D MA50 (blue trend-line), which instantly delivered a rally that eventually hit our $400 long-term Target:
The stock has since dropped off its All Time High (ATH) and is trading right now below its 1D MA50 (blue trend-line). The 1D RSI has given perhaps the most optimal Buy Signal when it double bottoms (red and green circles).
At the moment it has made the first Low and we are anticipating the second, which might very well be on the 1D MA200 (orange trend-line). That would be the signal for maximum gains and our Target will be on the Higher Highs trend-line at $450.
-------------------------------------------------------------------------------
** Please LIKE 👍, FOLLOW ✅, SHARE 🙌 and COMMENT ✍ if you enjoy this idea! Also share your ideas and charts in the comments section below! This is best way to keep it relevant, support us, keep the content here free and allow the idea to reach as many people as possible. **
-------------------------------------------------------------------------------
💸💸💸💸💸💸
👇 👇 👇 👇 👇 👇
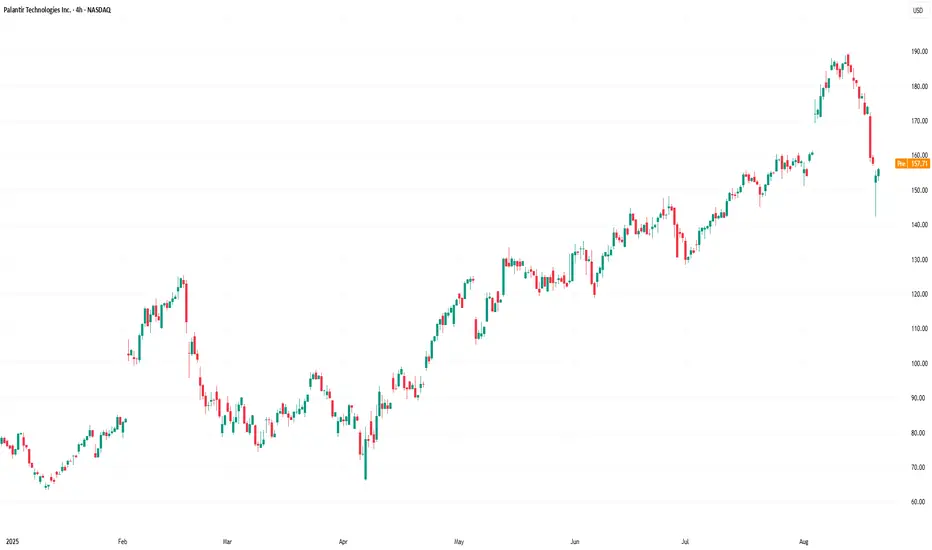
Palantir Technologies (PLTR) Shares Plunge Below $150Palantir Technologies (PLTR) Shares Plunge Below $150
Shares of Palantir Technologies (PLTR), a company specialising in big data analytics software, delivered an unpleasant surprise to investors:
→ just last week, the stock was trading at its all-time high of around $190;
→ yesterday, the price collapsed below $150. At yesterday’s intraday low, PLTR stock had dropped almost 25% from its record peak.
Why Did Palantir Technologies (PLTR) Stock Fall?
Bearish sentiment may have been driven by:
→ capital rotation from risk assets into so-called defensive stocks ahead of the Federal Reserve Chair’s speech at the Jackson Hole Symposium (as we reported yesterday);
→ growing speculation that a “bubble” is forming in the technology sector, which could burst.
According to Investor’s Business Daily, Andrew Left, founder of Citron Research, bet on downside in PLTR, arguing that the stock is severely overvalued following its phenomenal 340% rally in 2024.
Technical Analysis of Palantir Technologies (PLTR) Stock
In our previous analysis of PLTR’s price action, we:
→ identified an ascending channel (shown in blue);
→ suggested that the upcoming earnings release would push the stock towards the upper boundary of this blue channel.
Indeed, the strong earnings report on 5 August acted as a catalyst for the surge (breaking through resistance at $160, as indicated by the arrow) towards the channel’s upper boundary. However, the optimism stemming from these fundamentals was swiftly and completely erased – a highly significant bearish signal.
That said, the bulls still have valid reasons to remain hopeful, as the price:
→ staged a false bearish breakout below the key $145 level, which had previously acted as resistance (and has now flipped into support);
→ closed yesterday’s volatile session above its opening price (forming a dragonfly doji on the daily chart);
→ thus, the blue channel remains valid, with demand showing signs of aggression.
We can assume that the market has undergone a stress test and, after the volatility spike, the price has returned to the prevailing ascending channel, maintaining the uptrend. If so, the bulls will need to prove their resolve by overcoming key resistance levels at $160 and $170 (these mark not only the gap boundaries but also psychological barriers). If successful, PLTR’s price could advance towards the channel’s median line.
This article represents the opinion of the Companies operating under the FXOpen brand only. It is not to be construed as an offer, solicitation, or recommendation with respect to products and services provided by the Companies operating under the FXOpen brand, nor is it to be considered financial advice.
What Are Autoregressive Models in Trading?What Are Autoregressive Models in Trading?
Autoregressive (AR) models help traders analyse market movements by identifying statistical relationships in historical price data. These models assume that past values influence current prices, making them useful for spotting trends and price behaviour. This article explores “What is autoregression?”, how AR models function, their role in trading, and how traders apply them to market analysis.
What Is an Autoregressive Model?
Autoregressive (AR) models are statistical tools that can be used in numerous spheres, including market prices, weather, and traffic conditions. They analyse market movements by using past price data to understand current trends. The autoregressive definition refers to a model where each value in a time series depends on previous values plus an error term.
The number of previous values considered is called the “lag order,” denoted as AR(p), where ‘p’ represents the number of lags. In an autoregressive model example, an AR(1) model looks at just the previous value to estimate the current one, while an AR(3) model considers the last three. In trading, the key idea is that if historical prices show a consistent pattern—whether trending or reverting to a mean—an AR model can help identify that structure.
This approach differs from other time series models. Moving averages (MA) smooth out fluctuations by averaging past prices, while autoregressive integrated moving averages (ARIMA) combine both approaches and adjust for trends. AR models, however, focus purely on the statistical relationship between past and present values, making them particularly useful in markets where past behaviour has a clear influence on future movements.
Traders use an autoregressive process to explore trends, momentum, and potential reversals in markets that exhibit persistent patterns. However, their effectiveness depends on market conditions and the assumption that past relationships remain relevant—something that isn’t always guaranteed, especially in volatile or news-driven environments.
How Autoregressive Models Work in Trading
Traders use AR models to examine how past prices influence current movements. An autoregressive model trading strategy often involves assessing whether an asset’s price exhibits momentum or mean reversion tendencies. For example, if an AR(1) model shows that today’s price is strongly influenced by yesterday’s price, it may suggest a continuation bias—meaning traders could expect trends to persist in the short term.
In contrast, if an AR(2) or AR(3) model highlights a tendency for prices to move back toward an average after a few periods, it could indicate mean reversion. This is particularly relevant in range-bound markets where prices frequently return to support and resistance levels.
The number of past values included in an AR model is a key decision. Too few lags might miss relevant patterns, while too many can add unnecessary complexity. Traders typically determine the appropriate lag length by evaluating past data and statistical criteria like the Akaike Information Criterion (AIC).
AR models are more popular in markets where historical relationships hold for extended periods. It’s common to use autoregressive models for trading forex, equities, and commodities, especially in detecting short-term trends or cycles. While they aren’t predictive tools, they provide a structured way to analyse price behaviour, offering traders a statistical foundation for evaluating market movements.
Stationarity and Its Role in AR Models
For an autoregressive time series model to work, the data must be stationary. This means the statistical properties of the time series—such as its mean, variance, and autocorrelation—remain constant over time. If a dataset is non-stationary, meaning its trends, volatility, or relationships shift unpredictably, the AR model's analysis can become unreliable.
Why Stationarity Matters
The autoregressive model, meaning it assumes a consistent statistical structure, can struggle with shifting market conditions if stationarity is not ensured. If a time series is non-stationary, it might show an upward or downward drift, meaning price relationships aren’t consistent over time. This makes it difficult to analyse patterns. For example, a stock experiencing long-term growth won’t have a stable mean, which can distort AR-based analysis.
Testing for Stationarity
Traders often check for stationarity using statistical tests like the Augmented Dickey-Fuller (ADF) test. This test helps determine whether a time series has a unit root—a key characteristic of non-stationary data. If the test suggests a unit root is present, traders may need to adjust the data before using an AR model.
Transforming Data to Stationarity
When data is non-stationary, traders often apply transformations to stabilise it and convert it to an autoregressive model time series. Differencing is a common method, where they subtract the previous value from the current value to remove trends. Log transformations can also reduce the impact of volatility. Once stationarity is achieved, an AR model is believed to be more effective to analyse price movements.
Using an Autoregressive Model in Practice
Understanding how autoregressive models work is one thing—actually applying them in trading is another. These models are primarily used in quantitative strategies, where traders rely on statistical methods rather than gut feelings or news events. While AR models aren’t a complete trading strategy on their own, they can provide valuable insights when used correctly.
Building an AR Model
The first step in using an AR model is preparing the data. Traders typically start with a time series dataset—such as daily closing prices—and ensure it is stationary. If the data shows trends or changing volatility, they may apply differencing or log transformations to stabilise it.
Once the data is ready, the next step is determining the lag order—how many past values should be included in an AR(p) model. This is done through statistical tests like the Akaike Information Criterion (AIC) or Partial Autocorrelation Function (PACF), which help identify how far back price movements remain relevant. For instance, an AR1 model considers only the previous price point, while an AR3 model incorporates the last three observations. Choosing too few lags might miss important relationships, while too many can overcomplicate the model.
After selecting the lag order, traders fit the AR model using statistical software such as Python’s statsmodels or R’s forecast package. The model estimates how past prices influence current ones, producing a set of coefficients that define these relationships. The trader then analyses these results to determine if the model aligns with market behaviour.
Applying AR Models to Trading
Once built, an AR model provides insights into how past price behaviour influences future movement. For example:
- If an AR(1) model shows a strong positive coefficient, it suggests that today’s price is closely linked to yesterday’s, reinforcing a short-term trend.
- If an AR(2) or AR(3) model suggests a return toward a long-term mean, it may indicate a market where price cycles are present.
Traders use these insights in different ways. Some apply AR models to analyse short-term market momentum, while others use them to examine mean-reverting assets like certain forex pairs or commodities. They can also compare AR-based analysis with other indicators like moving averages or Bollinger Bands to refine their decision-making process.
Autoregressive models are also used in machine learning for time series forecasting, helping algorithms detect patterns in sequential data. In trading, autoregressive model machine learning techniques can refine models by dynamically adjusting lag parameters, improving adaptability to changing market conditions and reducing reliance on fixed assumptions.
ARIMA: Extending AR Models
While AR models work well on stationary data, many financial time series contain trends or seasonality that a basic AR model can’t handle. This is a scenario where Autoregressive Integrated Moving Average (ARIMA) models become useful. ARIMA combines AR components with moving averages (MA) and differencing (I for “integrated”) to account for non-stationary behaviour.
For example, if a stock price has an upward drift, an AR model alone won’t be sufficient. An ARIMA model can first remove the trend through differencing, and then apply AR and MA components to analyse underlying patterns. This makes ARIMA more flexible for complex market environments.
Challenges and Considerations When Using AR Models
Autoregressive models can be useful for analysing price movements, but they come with limitations that traders should consider. Financial markets are complex, and historical price patterns don’t always repeat in the same way. Understanding where AR models fall short might help traders apply them more effectively.
Overfitting and Choosing the Right Lag Order
One of the biggest challenges in using AR models is selecting the right lag order. Including too many past values can lead to overfitting, where the model becomes overly sensitive to historical fluctuations that may not be relevant going forward. Overfitting can create misleading analysis, making the model seem accurate in hindsight but ineffective in real-time market conditions. Traders typically balance complexity with statistical tests like the Akaike Information Criterion (AIC) to determine an optimal lag length.
Market Noise and Unexpected Events
AR forecasting assumes that past price relationships remain relatively consistent. However, financial markets are influenced by a wide range of external factors—economic reports, central bank decisions, and geopolitical events—that models based purely on past prices cannot account for. A market that has historically followed a trend can abruptly reverse due to news or institutional flows, reducing the usefulness of AR-based analysis.
Data Quality and Stationarity
The reliability of an AR model depends on the quality of the data used. Non-stationary data, sudden regime changes, or structural shifts in the market can distort results. Traders often need to check for stationarity and adjust their approach when market conditions change, ensuring that their models remain relevant rather than assuming past relationships always hold.
The Bottom Line
Autoregressive models offer traders a statistical approach to analysing price movements, helping them identify trends and market behaviour based on historical data. While they are not standalone trading signals, they can be valuable when combined with other analytical tools.
FAQ
What Is an Autoregressive Model?
An autoregressive (AR) model is a type of statistical model that analyses time series data by expressing a variable as a function of its past values. It assumes that past observations influence current values, making it useful for identifying patterns in sequential data.
What Is an Autoregressive Model in Finance?
In finance, AR models are used to analyse price movements by examining historical data. Traders apply them to identify trends, momentum, or mean-reverting behaviour in assets like stocks, forex, and commodities. AR models help quantify how past price changes relate to current movements.
What Is an Autoregressive Model for Stock Analysis?
AR models in stock analysis assess price patterns by using historical data to determine potential relationships between past and present values. They can highlight statistical trends but do not account for external market drivers like news or economic events.
This article represents the opinion of the Companies operating under the FXOpen brand only. It is not to be construed as an offer, solicitation, or recommendation with respect to products and services provided by the Companies operating under the FXOpen brand, nor is it to be considered financial advice.
Nightly $SPY / $SPX Scenarios for Thursday, August 21, 2025 🔮 Nightly AMEX:SPY / SP:SPX Scenarios for Thursday, August 21, 2025 🔮
🌍 Market-Moving Headlines
Tech jitters spill as Jackson Hole kicks off. Global equities slipped following a tech sell‑off driven by concerns over U.S. intervention in chipmakers, while traders await Fed Chair Powell’s policy cues. AMEX:SPY and NASDAQ:TLT under pressure as rate‑cut expectations waver.
Sony hikes PS5 prices amid tariffs. Effective August 21, PlayStation 5 models in the U.S. see a $50 price increase—tariff impact spilling into consumer electronics. Raises inflation whispers amid already elevated tech cost narrative.
Healthcare activism heats up. Boards at firms like Medtronic, Pfizer, and Novo Nordisk shift under investor pressure—governance shake‑ups adding a layer of corporate risk and potential M&A signals.
⏱ Key Data Releases & Events (ET)
10:00 AM — Advance Services Report (Q2) (Census bureau). Quarterly weight of service economy—strong print supports Pro side of markets; weak could dial back rate‑cut hopes.
10:00 AM — Summer Youth Labor Force Survey (Annual). Goes with job‑market narrative from July—may tweak Fed sentiment depending on labor softening/stability.
Jackson Hole Symposium begins. Markets now fully focused on Powell; tone could make or break short‑term equity and bond positions.
⚠ Disclaimer: Educational/informational only — not financial advice.
📌 #trading #stockmarket #Fed #JacksonHole #SPY #SPX #TLT #Sony #tech #tariffs #services #labor #activism #healthcare
SPY Long From Rising Support! Buy!
Hello,Traders!
SPY is trading in an
Uptrend along the
Rising support and we
Are already seeing a
Bullish rebound from
The line so we will be
Expecting a further
Bullish move up
Buy!
Comment and subscribe to help us grow!
Check out other forecasts below too!
Disclosure: I am part of Trade Nation's Influencer program and receive a monthly fee for using their TradingView charts in my analysis.

S&P 500 ETF & Index– Technicals Hint at a Possible Correction📉📊 S&P 500 ETF & Index at Resistance – Technicals Hint at a Possible Correction 🔍⚠️
Everything here is pure technicals— but sometimes, the market whispers loud and clear if you know how to listen. 🧠📐
The VOO ETF, which tracks the S&P 500 , has now reached the upper boundary of a long-term ascending channel, once again brushing against resistance near 590.85. This zone has consistently led to major pullbacks in the past.
On the right panel, the US500 Index mirrors this move—pushing toward all-time highs, right as broader sentiment turns euphoric. Technically, both charts are overextended and pressing into key zones.
👀 Potential Path:
🔻 Rejection from current zone ➝ Down toward 526.17, then 465.72 (green support channel)
🔁 Possible bounce after correction — trend still intact long term
And while we’re keeping it technical, it’s worth noting that the Buffett Indicator (Stocks-to-GDP) i s currently screaming “overvaluation.” This doesn't predict timing—but it adds macro context to an already overheated chart setup.
The lesson? Price respects structure. Whether or not the fundamentals are in agreement, the charts are warning that now may not be the time to chase.
History doesn’t repeat, but it often rhymes. Stay sharp, stay technical. 🎯
One Love,
The FX PROFESSOR 💙
ps. the beauty of these levels? Tight Stop loss- excellent R/R
Disclosure: I am happy to be part of the Trade Nation's Influencer program and receive a monthly fee for using their TradingView charts in my analysis. Awesome broker, where the trader really comes first! 🌟🤝📈

8/20/25 SPX Trade Plan📊 Quantum's Trade Plan 📊
TVC:VIX - TVC:DXY - #10Y = Caution📈
⚪️ 6400 Pivot
🟢 If 6400 fails then short - 6390--6388--6375--6364
🔴If 6400 hold then long - 6409--6426--6440--6445
🔵 -Dex with sell walls at 6400 & 6450
🟠 Vanna neutral - 6405-6410 vanna flip
⚫️ Volume + Flow must support thesis
