Breaking: AngioDynamics, Inc. (ANGO) Set for Breakoutshares of AngioDynamics, Inc. (NASDAQ: NASDAQ:ANGO ) are surging 5% in Tuesday's premarket session. The asset has broken the ceiling of a bullish rectangle pattern- couple with the RSI at 54, NASDAQ:ANGO is set for a bullish spike amidst market sentiment.
Adding to the bullish thesis, AngioDynamics Reports Fiscal Year 2026 Second Quarter Financial Results; Continued Double Digit Med Tech Growth Drives Increased Profitability
Report Highlights
Med Tech segment delivers fifth consecutive quarter of double-digit growth
Strong adjusted EBITDA; and positive cash flow
Three regulatory milestones support Mechanical Thrombectomy portfolio: Modified AlphaVac 510(k) clearance, PAVE and APEX-Return IDE approvals
Raised full year FY 2026 guidance for net sales and Adjusted EBITDA
Jim Clemmer to retire during fiscal year 2027 as President and CEO upon appointment of successor; Board initiates comprehensive CEO search.
Analyst Summary
According to 3 analysts, the average rating for ANGO stock is "Strong Buy." The 12-month stock price target is $19.33, which is an increase of 46.11% from the latest price.
About ANGO
AngioDynamics, Inc., a medical technology company, designs, manufactures, and sells medical, surgical, and diagnostic devices for the use in treating peripheral vascular disease, and oncology and surgical settings in the United States and internationally. It offers Auryon Atherectomy system that delivers an optimized wavelength and short pulse width to remove lesions while preserving vessel wall endothelium.
Stockstowatch

Novo Nordisk (NVO) 1WI’m looking at the weekly NVO chart as of late December 2025, and this is no longer about fear or headlines. It’s about structure and valuation. After a powerful multi year rally from 2022 to 2024, the stock went through a deep and healthy correction. In 2025, price built a strong weekly demand base around the 50–55 USD area, where volume profile, historical support and long term buyers align. Selling pressure is fading, volatility is compressing, and price action is stabilizing.
Technically, NVO is transitioning into a post correction accumulation phase. On the weekly timeframe, RSI has recovered from oversold territory and is holding a neutral bullish range. MACD is forming a constructive reversal structure, while declining volume on down moves suggests exhaustion rather than distribution. As long as price holds the weekly base and does not break lower, the recovery scenario remains valid, with upside reference zones near 72–75 USD and later 90–92 USD if momentum confirms.
From a fundamental perspective, as of the end of 2025, Novo Nordisk remains one of the highest quality businesses in global healthcare. Revenue exceeds 39 billion USD, with the Diabetes and Obesity Care segment generating more than 85% of total sales, continuing to show resilient growth. The United States and Europe remain the core revenue drivers, while international markets continue to expand steadily.
Cash flow quality remains strong. Operating cash flow is above 18 billion USD on a TTM basis, free cash flow stays positive despite heavy investments into capacity expansion and R&D. Dividend policy remains disciplined and shareholder friendly, with TTM dividend yield around 2.3% and a payout ratio near 35–36%, leaving room for both reinvestment and future dividend growth.
What matters is that the 2025 correction did not come with any structural deterioration of the business. This was not a business breakdown, but a valuation reset after an extreme growth phase. Expectations have been normalized, multiples compressed, while fundamentals stayed intact. That’s where asymmetry begins to emerge.
Tactically, I see NVO as a long term quality compounder, where 2025 served as a reset year. As long as the weekly structure holds, the path for gradual upside remains open. This is not a short term trade, but a trend rebuilding phase driven by cash flow, market leadership and scale.
Sometimes the best opportunities appear not at peak optimism, but when the market has already done its emotional damage and the numbers are still standing.

SMR 1D: Small reactors. Big nerves.I am looking at NuScale Power without emotions. After a strong impulsive move, the price is in a deep correction phase and is now forming a base. The key focus is not old trendlines, but current market behavior. On the daily chart, RSI reached oversold levels and started to turn up, while price is no longer making aggressive new lows. This signals weakening selling pressure. Volume increased noticeably in the 16.50–18.00 zone, suggesting accumulation rather than panic selling. This is not a fast reversal, but a classic stabilization phase after a sharp sell off.
From a technical perspective, as long as this base holds, a recovery scenario remains valid. Initial upside levels are around 23.50, followed by 30.65. In a more optimistic scenario, the 42.00 area becomes relevant, but only if momentum and volume continue to confirm.
Fundamentally, NuScale remains a high risk but strategic story. The company continues to develop small modular nuclear reactors, targeting long term demand from energy infrastructure and data centers. As of late 2025, profitability is still negative, with Q4 2025 EPS estimated around −0.16 USD, which is already priced in by the market. Revenue remains modest, with near term estimates around 9 million USD, but the real value lies in government backed programs, long term energy contracts, and the strategic role of SMR technology in the energy transition. This is why the stock reacts sharply to any shift in sentiment around nuclear energy and infrastructure spending.
For me, this is not a place for excitement, but a zone to watch carefully. As long as RSI continues to recover and volume confirms demand, the base scenario stays constructive. If the base fails, the market will quickly remind us that future technologies still come with present day risks.
Nuclear energy promises stability. The SMR chart reminds us that the road there is anything but calm.

Oceaneering (OII) — Subsea Tech + Multi-Year Backlog MomentumCompany Overview
Oceaneering International NYSE:OII is a global leader in offshore engineered services & subsea robotics, spanning ROVs, asset integrity, and digital solutions for oil & gas and emerging offshore energy.
Q3’25 Execution
Revenue: $743M (+9% YoY)
Net income: +73% YoY
Drivers: higher offshore activity, improved asset utilization, disciplined cost control—expanding operating leverage.
Backlog & Visibility
Multi-year contracts through 2027 reinforce revenue visibility and margin stability, underpinned by deepwater project pipelines.
Tech Edge
Vision™ Subsea digital platform enables remote inspections, safety improvements, and reduced downtime, strengthening OII’s role as a mission-critical deepwater partner.
Investment Outlook
Bullish above: $23–$24
Target: $35–$36 — supported by backlog growth, utilization gains, and digital subsea differentiation.
📌 OII — scaling robotics + digital to power the next cycle of offshore energy.

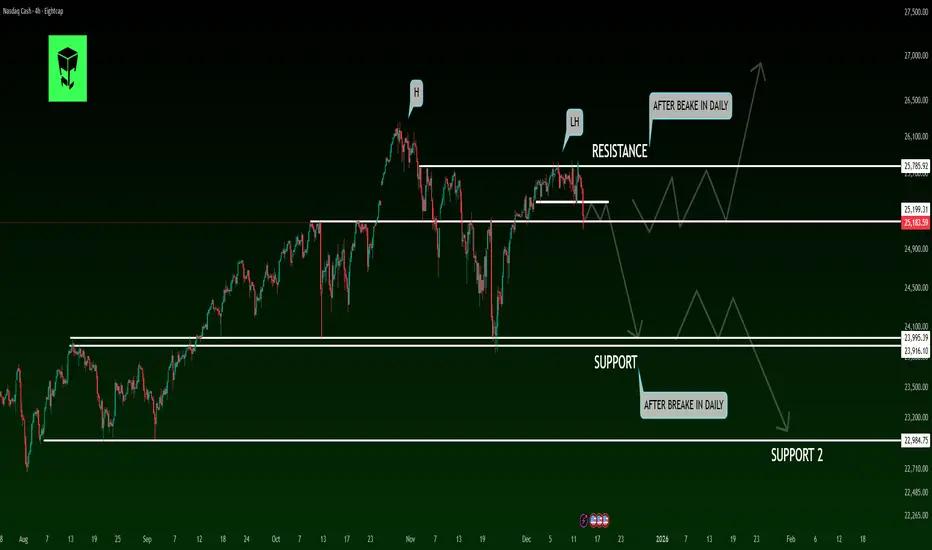
Calm Before the Storm?A Potential Crash Is Forming in US STOCKSHello, I hope you're doing well today. We are going to analyze the Nasdaq index together. The Nasdaq is one of the key U.S. stock indices and consistently offers promising trading opportunities. If you're ready, let's dive into the analysis.
Timeframe: 4H / Daily
🔍 Market Structure Overview
After forming a major High (H) followed by a clear Lower High (LH) near a key resistance zone, the NASDAQ index is showing signs of bullish momentum weakness. Failure to hold and stabilize above this resistance increases the probability of a market phase shift from bullish/ranging to corrective or bearish.
🧱 Key Supply & Demand Zones
🔴 Major Resistance:
Area around 25,750 – 25,900
This zone has rejected price multiple times and is acting as a strong supply area.
🟢 First Support:
Area around 23,950 – 24,050
A daily close below this support would strengthen the bearish scenario.
🟢 Second Support (Support 2):
Area around 22,900 – 23,000
A potential downside target if the first support breaks and weakness continues.
⚠️ Probable Market Scenario
As long as price remains below the main resistance,
the corrective / bearish scenario remains dominant.
A confirmed daily break below the first support could trigger
accelerated selling toward Support 2.
Any bullish moves at this stage may be considered pullbacks into resistance,
rather than the start of a new uptrend.
🧠 Summary
📌 Market structure suggests a weak trend
📌 Sellers are showing strength near highs
📌 Extra caution is required for long positions
📌 Short trades are more favorable only after confirmed breaks
🛑 Disclaimer
⚠️ This analysis is for educational purposes only
⚠️ It is NOT financial advice
⚠️ All trading decisions are made at your own risk
⚠️ Always apply proper risk and capital management
📊 Poll – What’s your outlook?
❓ What do you expect next for NASDAQ?
🔘 Further decline toward lower supports 📉
🔘 Range-bound movement between support & resistance 🔄
🔘 Strong rebound and breakout above resistance 🚀
👇 Share your view in the comments
Netflix Going to 82 or lower? Here is a quick analysis of the market of we are currently seeing, if you need further help and are struggling send me a DM more than happy to answer any questions you may have
Trade Smarter Live Better
Kris

AMD — [2D] WEEK 49 TREND REPORT | 12/04/2025AMD — WEEK 49 TREND REPORT | 12/04/2025
Ticker: NASDAQ:AMD
Timeframe: 2D
This is a reactive structural classification of AMD based on the weekly chart as of this timestamp. Price conditions are evaluated as they stand — nothing here is predictive or forward-assumptive.
⸻
1) Current Trend Condition [ Numbers to Watch ]
Current Price @ 217.20$
• Trend Duration : +27 Days (Bearish)
• Trend Reversal Level ( Bullish ): 226.29$
• Trend Reversal Level ( Bearish Confirmation ): 210.93$
• Pullback Support : 226.29$
• Correction Support : 194.27$
• Structural Support : 149.29$
⸻
2) Structure Health
• Retracement Phase:
Correction (approaching 61.8%)
• Position Status:
Caution (interacting with structural layers)
⸻
3) Temperature :
Neutral Phase
⸻
4) Momentum :
Coiling
⸻
Methodology Overview
This classification framework evaluates directional conditions using internal trend-interpretation logic that references price behavior relative to its structural layers. These relationships are used to identify when price movement aligns with the framework’s criteria for directional phases, transition points, or regime shifts. Visual elements or structural labels reflect these internal interpretations, rather than explicit trading signals or preset indicator crossovers. This framework is observational only and does not imply future outcomes.

Pre-Market Morning Levels & Setups: META • SPY • ZS • AMZN •NVDAQuick morning breakdown covering META, SPY, ZS, AMZN, and NVDA.
Touched on futures structure, overnight sentiment, key levels, and what I’m watching into the open.
Straightforward setups and the zones that matter.

Can United Spirits make a strong comeback?United Spirits Ltd. engages in the manufacturing, sale, and distribution of beverage alcohol. It operates through Craft Whisky and Luxury Spirits segments. The company offers brand portfolio of Scotch whisky, IMFL whisky, brandy, rum, vodka, and gin. It imports, manufactures, distributes, and sells various iconic Diageo brands such as Haig Gold Label, Captain Morgan, Johnnie Walker, J&B, Baileys, Lagavulin, Talisker, VAT 69, Black & White, Smirnoff and Ciroc. Closing price is 1429.40.
The positive aspects of the company are Companies with no Debt, Annual Net Profits improving for last 2 years and MFs increased their shareholding last quarter. The Negative aspects of the company are high Valuation (P.E. = 63.5), High promoter stock pledges, Increasing Trend in Non-Core Income, Declining Net Cash Flow: Companies not able to generate net cash and Companies with growing costs YoY for long term projects.
Entry can be taken after closing above 1436 Historical Resistance in the stock will be 1492 and 1547 PEAK Historic Resistance in the stock will be 1592 and 1656. Stop loss in the stock should be maintained at Closing below 1373 or 1338 depending upon your risk taking ability.
Disclaimer: The above information is provided for educational purpose, analysis and paper trading only. Please don't treat this as a buy or sell recommendation for the stock or index. The Techno-Funda analysis is based on data that is more than 3 months old. Supports and Resistances are determined by historic past peaks and Valley in the chart. Many other indicators and patterns like EMA, RSI, MACD, Volumes, Fibonacci, parallel channel etc. use historic data which is 3 months or older cyclical points. There is no guarantee they will work in future as markets are highly volatile and swings in prices are also due to macro and micro factors based on actions taken by the company as well as region and global events. Equity investment is subject to risks. I or my clients or family members might have positions in the stocks that we mention in our educational posts. We will not be responsible for any Profit or loss that may occur due to any financial decision taken based on any data provided in this message. Do consult your investment advisor before taking any financial decisions. Stop losses should be an important part of any investment in equity.

MAS Financial Services: Strong Case For Comeback. MAS Financial Services Ltd. engages in the provision of financial services. It offers micro enterprise loans, small-medium enterprise loans, two-wheeler loans, commercial vehicle loans, agri-based loans, loans to micro financial institutions, housing loans, commercial loans, and project loans for real estate projects to customers. Closing price is 309.25.
The positive aspects of the company are Attractive Valuation (P.E. = 16.6), Companies with Zero Promoter Pledge, Annual Net Profits improving for last 2 years, Company able to generate Net Cash - Improving Net Cash Flow for last 2 years, FII / FPI or Institutions increasing their shareholding and MFs increased their shareholding last quarter. The Negative aspects of the company are Stocks Underperforming their Industry Price Change in the Quarter and Increasing Trend in Non-Core Income.
Entry can be taken after closing above 311 Historical Resistance in the stock will be 316, 323 and 330 PEAK Historic Resistance in the stock will be 339 and 350. Stop loss in the stock should be maintained at Closing below 294.
Disclaimer: The above information is provided for educational purpose, analysis and paper trading only. Please don't treat this as a buy or sell recommendation for the stock or index. The Techno-Funda analysis is based on data that is more than 3 months old. Supports and Resistances are determined by historic past peaks and Valley in the chart. Many other indicators and patterns like EMA, RSI, MACD, Volumes, Fibonacci, parallel channel etc. use historic data which is 3 months or older cyclical points. There is no guarantee they will work in future as markets are highly volatile and swings in prices are also due to macro and micro factors based on actions taken by the company as well as region and global events. Equity investment is subject to risks. I or my clients or family members might have positions in the stocks that we mention in our educational posts. We will not be responsible for any Profit or loss that may occur due to any financial decision taken based on any data provided in this message. Do consult your investment advisor before taking any financial decisions. Stop losses should be an important part of any investment in equity.

Netflix (NFLX) - Elliott Wave Map to $25K📘 Netflix (NFLX) – The Final Act of Supercycle Wave III, Setting the Stage for Wave V to $25,000+
Symbol: NASDAQ:NFLX
Timeframe: Monthly
Published: October 2025
Current Price: ~$1,120
Framework: Elliott Wave | Fibonacci Extensions | Price Action | Smart Money Concepts (SMC) | Fundamentals
🔍 Structural Overview – Supercycle Journey
Netflix has been moving through a multi-decade Elliott Wave supercycle that began in the early 2000s. This structural roadmap is now approaching the final phase of Wave III, before setting up for a corrective Wave IV and ultimately a euphoric Wave V.
Supercycle Wave I completed in January 2004 — a powerful impulse that marked Netflix’s transition into a mainstream tech-growth story.
Supercycle Wave II followed, completing in 2008 with a healthy 50% retracement. This wave set the long-term demand foundation and concluded right as the global financial crisis unfolded.
We are now in Supercycle Wave III, which began in 2008 and is currently in its final macro wave — the most dynamic phase of the entire structure.
⚙️ Breakdown of Supercycle Wave III (2008–2026 est.)
Wave III itself subdivides into five clear macro waves, each respecting Fibonacci and structural principles:
Macro Wave 1 ran from the 2008 bottom into mid-2011, kickstarting the secular bull trend.
Macro Wave 2 ended in 2012 with a textbook 0.618 Fibonacci retracement , a classic sign of wave-based correction.
Macro Wave 3 , the most explosive move of the cycle, lasted until 2018 and terminated near a 2.618 Fibonacci extension — a key confluence area and institutional distribution point.
Macro Wave 4 then corrected from 2018 to 2022. However, this retracement was shallow, bouncing from the 0.236 level — preserving long-term bullish market structure and confirming continued institutional control.
We are currently in Macro Wave 5 of Supercycle III . This leg is itself subdividing into five micro waves. Micro waves 1, 2, and 3 have already completed. Micro Wave 4 is now unfolding and is expected to bottom inside the Golden Pocket — the critical Fibonacci zone between approximately $771 and $548 .
Once Micro Wave 4 completes, Micro Wave 5 will initiate. This final thrust is expected to target the region near $7,447 — the 2.618 extension from prior waves. This level aligns with structural channel tops and institutional profit zones. It would also mark the formal completion of Supercycle Wave III .
🧭 What Comes Next: Supercycle Wave IV and V
After Wave III completes at the ~$7,44 7 area, a significant correction is expected.
Supercycle Wave IV will be the most complex corrective structure since 2008 — possibly multi-year, combining flat, zig-zag, or triangle formations. This wave will likely retrace a large portion of Wave III and reset sentiment across the broader market.
But this correction is not the end — it’s the setup.
Supercycle Wave V will emerge from the Wave IV base and drive Netflix into its ultimate secular top . Based on the Fibonacci 4.618 extension from the base of the cycle, Wave V is projected to reach the $24,774 to $25,332 range.
This would be the euphoric blow-off move where fundamentals, monetary policy, and sentiment combine to form a parabolic top — consistent with historical market cycle conclusions.
📐 Fibonacci Confluence Zones
Each major wave has respected key Fibonacci ratios . Wave II retraced to 0.50, Wave III extended to 2.618, and Wave IV retraced to 0.236. Current projections place Wave V near the 4.618 extension level — a historically significant threshold for secular tops.
The current Micro Wave 4 pullback is unfolding into the Golden Pocket zone — the 0.618–0.65 retracement range — which has repeatedly served as the institutional reaccumulation zone across prior waves.
🧠 Smart Money Behavior
Smart Money Concepts further validate this wave count:
In 2018 , we saw classic signs of institutional distribution at the top of Macro Wave 3 — including high-volume price exhaustion, deviation from trend, and liquidity sweeps.
Between 2018 and 2022, accumulation returned during Wave 4, as institutional players re-entered at discounted levels and retested key demand blocks .
The 2022 breakout into Macro Wave 5 has been efficient, clean, and impulsive — with minimal resistance and wide-range bullish candles, signaling continued institutional participation.
The current Wave 4 micro correction may again serve as a liquidity grab — offering another accumulation window before the final markup toward the $7,447 zone.
🔍 Netflix Fundamentals – Fueling the Cycle
Netflix's fundamentals are now structurally aligned with the technical setup:
Diversified Monetization:
The shift from pure subscription to a multi-layered model (ad-supported tiers, gaming, IP licensing, live events) is broadening both revenues and engagement.
Ad-Supported Growth:
Netflix’s advertising business is scaling rapidly, offering higher ARPU and access to price-sensitive users — a major tailwind for Wave V.
Global Expansion:
With strong localization strategies, Netflix continues to dominate key international markets, boosting user stickiness and content ROI.
Strong Financials:
Consistent free cash flow, improving margins, and disciplined content spend are creating a sustainable growth engine.
These dynamics are not just supporting price — they are helping to drive the type of institutional confidence needed for Wave V to materialize.
🎯 Strategic Levels and Outlook
Watch the Golden Pocket between $771–$548 — this is the high-probability completion zone for Micro Wave 4.
Once Micro Wave 5 begins, price is expected to rally toward $7,447 — the projected top of Supercycle Wave III.
After a broad correction during Wave IV, the final Wave V is projected to target $24,774 to $25,332 — where the entire super-cycle would culminate.
🔚 Final Word
Netflix is moving through the final stages of a 20-year Supercycle Wave III — one of the strongest impulsive phases in equity history. The micro pullback underway now is not a sign of weakness, but a preparation for the final push.
Wave IV will offer the last major reset before a euphoric Wave V redefines valuations. If the fundamental narrative continues to align, the $25K target is not speculative — it’s structural.
📘 Disclaimer: This analysis is for educational purposes and is not financial advice. Always do your own due diligence and risk management.
#NFLX #Netflix #NASDAQ #ElliottWave #TechnicalAnalysis #WaveTheory #Fibonacci #Supercycle #PriceAction #LongTermInvestment
💬 Respected traders and analysts!
Your insights matter. Share your views, confirmations, or constructive criticism in the comments below. Let’s build a high-quality discussion around Netflix’s structural evolution and long-term investment context.
— Team FIBCOS

There might be sudden pump in $LKQ If we can stay above $31,10 we are about to go toward $34. Lets see how this will play out. Good luck for you all

Sold Half PYPL. Raised Stops.Trading Fam,
Recently, you may remember, my new indicator triggered a BUY alert on quite a few stocks. Paypal was one of them. I entered this trade at around $69 dollars with a moderate target of $79 for a 1:2 rrr. We've nearly reached that target today. So, I've sold half, taken profit, raised my stops, and I'll let the rest ride. You know where to track the remainder of my trades.
Congrats to those who followed me. We've now won the last 13 of 13 trades for an avg. profit of 37%. As I continue to grow in experience with my indicator, we will only get better.
✌️Stew

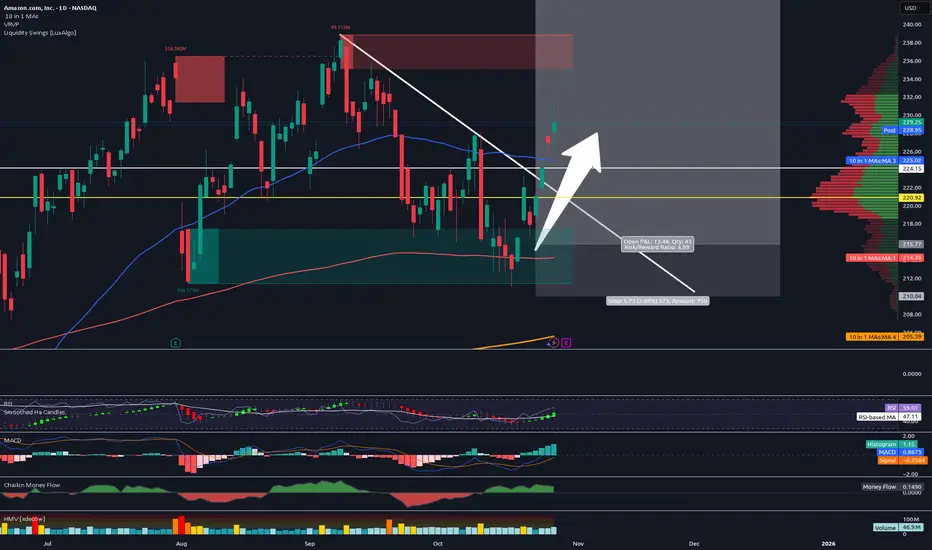
Sold Half Amazon - Raised Stops - Halfway to Final Target!Trading Fam,
We are halfway to my final target. I've been trading safe lately. So, I decided to sell half here, capture some profit, and raise my stops to $225, ensuring we're all in the money on this trade.
Congrats to those who followed me. We are 14 wins for the last 14 trades with an avg. of 33% profit per trade. Since implementing my new indicator just over a year ago, I continue to improve trade accuracy with each trade. Experience is growing and so are our wallets. Our portfolio is up 69% since we started with the indicator! Those are incredible stats for any trader, nevermind someone like me who just learned how to trade liquidity!
You guys know where to find me and all of my trades. 100% free to all of my followers.
✌️Stew
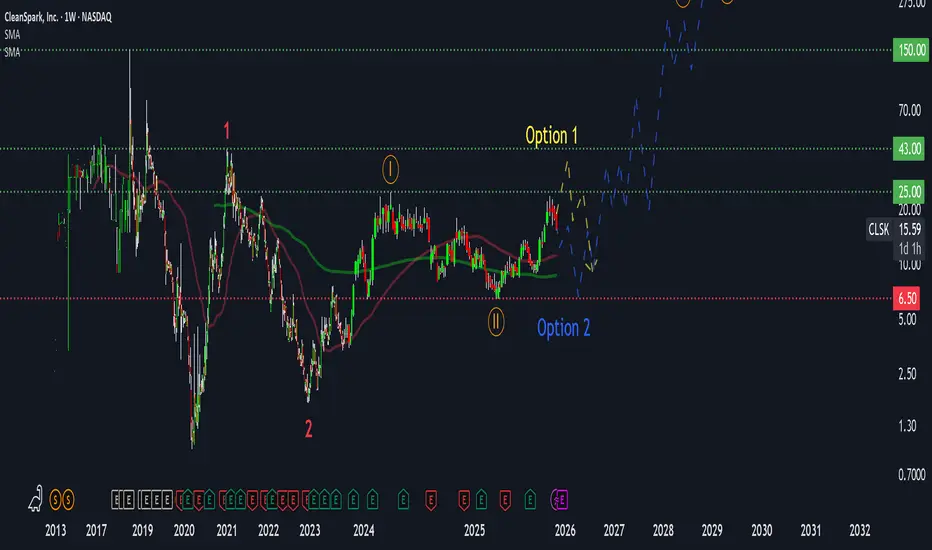
CleanSpark (CLSK): Strong Upside Expected After CorrectionWhy this matters now:
CleanSpark remains one of the strongest miners in the sector, but the current technical structure suggests a likely correction before the start of a major bullish cycle.
🔹 Main Thesis
Technically, CLSK is bullish, but a short-term correction to $8–10 is expected, after which the stock could launch a strong upward move toward $43 and beyond.
🔹 Key Arguments
Wave Structure:
Wave 1 is complete ✅, Wave 2 (correction) is underway. We are now in the final phase before the next impulse wave.
Resistance $25–43:
$25 is a key previous high. A short-term breakout with a small pullback is possible, followed by a retest and formation of the next upward wave. Targets: $43, then $150+.
Volume Cluster $8–10:
The main smart money cluster where significant positions were accumulated provides strong support. This is likely the bounce zone after the correction.
Fundamentals:
EPS growth ~50% YoY, forward P/E ~15. Cash flows are unstable.
Correlation with Bitcoin:
As a Bitcoin miner, CLSK is highly correlated with BTC. Historically, when BTC corrected 70–80%, CLSK tested lows in the $8–10 zone.
Currently, CLSK could first rise to $30–35 and then correct along with BTC by roughly 70%, aligning with the $8–10 support cluster.
Levels and Targets
Resistance: $25 - key level, possible false breakout
Support / Smart Money Cluster: $8–10 - likely bounce zone
Final Cycle Targets: $43 → $150 - breakout above $43 opens the path to $150+
🔹 Risk & Invalidation
Main Risk: strong BTC correction → CLSK tests $8–10 cluster.
Historically, four previous corrections in BTC were around 70–80%, matching the current structure.
❌ Invalidation: break and close below $6 → current wave structure would be invalidated and require reassessment.
🔹 Summary
CleanSpark is forming a strong bullish trend. After a possible correction to $8–10, a powerful upward impulse is likely, with targets at $43 and beyond. Potential from current levels: 10x+, but the path includes a consolidation phase.
🔹 Discussion
What’s your take on CLSK? Do you agree with the correction scenario, or do you see a different move?
💬 Comment below or suggest which ticker we should analyze next!
QUBT [Swing]: Double Bottom + Volume = Opportunity🎯 QUBT: The Quantum Heist Setup! 💎 Double Bottom Breakout Play
📊 Asset Overview
Quantum Computing Inc. (QUBT) - Riding the quantum wave with momentum! 🌊
🔍 Technical Analysis
The chart is screaming opportunity! 📢 We've spotted a volume-weighted moving average double bottom pattern with a clean retrace hitting the 786 MA line. Bulls are flexing their muscles 💪 and the setup looks primed for an upside explosion.
Key Technical Highlights:
✅ Double bottom formation confirmed
✅ Volume spike supporting the move
✅ 786 MA acting as dynamic support
✅ Momentum indicators turning bullish
🎯 The "Thief" Strategy Playbook
🚪 Entry Zone: The Layered Approach
Thief Strategy = Smart Layering 🧠
Instead of going all-in at one price, we're using multiple limit orders (layering strategy) to build our position:
💰 Layer 1: $19.50
💰 Layer 2: $20.00
💰 Layer 3: $20.50
💰 Layer 4: $21.00
Pro Tip: You can add more layers based on your risk appetite and position size! This approach averages your entry and reduces timing risk. 🎲
🛡️ Risk Management
🚨 Stop Loss: $18.00
Important Note: This is the Thief OG stop level, but remember — your capital, your rules! 👑 Every trader's risk tolerance is different. Adjust based on your own comfort zone and account size. Trade at your own risk!
🎯 Profit Targets
🏁 Primary Target: $25.00
Why $25? Because at $26.00, we've got a "Police Barricade" 🚔🚧 — a strong resistance zone where:
Overbought conditions likely
Bull trap potential
Heavy selling pressure expected
Smart thieves escape before the sirens! 🚨 Lock in profits at $25.00 and live to trade another day.
Another Important Note: This is a suggested target level. You make the money, you take the money — at your own discretion and risk! 💵
🔗 Related Pairs to Watch
Keep an eye on these correlated quantum/tech plays:
NYSE:IONQ - Pure-play quantum computing competitor
NASDAQ:RGTI - Rigetti Computing (quantum sector)
NYSE:IBM - Traditional tech with quantum division
NASDAQ:NVDA - AI/quantum chip correlation
NASDAQ:GOOGL - Google's quantum initiatives
Correlation Play: When quantum stocks heat up, they often move together. QUBT leading could signal sector-wide momentum! 🔥
⚠️ Disclaimer
This is the "Thief Style" trading strategy — designed for entertainment and educational purposes with a fun twist! 🎭 This is NOT financial advice. Always do your own research, manage your risk, and never trade with money you can't afford to lose. Past performance doesn't guarantee future results. Trade responsibly! 🎲
🎬 Final Words
The setup is there, the levels are marked, and the quantum play is heating up! Whether you're swing trading or day trading, this layered approach gives you flexibility and control.
Remember: Markets don't care about your feelings — stick to your plan, manage your risk, and let the probabilities work in your favor over time! 🎯
✨ If you find value in my analysis, a 👍 and 🚀 boost is much appreciated — it helps me share more setups with the community!
#QUBT #QuantumComputing #StockMarket #SwingTrading #DayTrading #TechnicalAnalysis #DoubleBottom #ThiefStrategy #LayeringStrategy #TradingSetup #BullishSetup #StockTrading #QuantumStocks #TradingIdeas #PriceAction #RiskManagement

Momentum building again in Uno Minda?UNO Minda Ltd. engages in the manufacture of auto components, including electrical parts and accessories; and provision of ancillary services.
Uno Minda Closing price is 1235.20. The positive aspects of the company are Companies with Zero Promoter Pledge, Annual Net Profits improving for last 2 years, Strong cash generating ability from core business, Companies with Low Debt and FII / FPI or Institutions increasing their shareholding. The Negative aspects of the company are high Valuation (P.E. = 68.9), Increasing Trend in Non-Core Income, Companies with growing costs YoY for long term projects, Promoter decreasing their shareholding and MFs decreased their shareholding last quarter.
Momentum can build further in the stock after closing above 1236 Historical Resistance in the stock will be 1273 and 1311. PEAK Historic Resistance in the stock will be 1348 and 1393. Stop loss in the stock should be maintained at Closing below 1153 or 1107 depending upon your risk taking ability.
Disclaimer: The above information is provided for educational purpose, analysis and paper trading only. Please don't treat this as a buy or sell recommendation for the stock or index. The Techno-Funda analysis is based on data that is more than 3 months old. Supports and Resistances are determined by historic past peaks and Valley in the chart. Many other indicators and patterns like EMA, RSI, MACD, Volumes, Fibonacci, parallel channel etc. use historic data which is 3 months or older cyclical points. There is no guarantee they will work in future as markets are highly volatile and swings in prices are also due to macro and micro factors based on actions taken by the company as well as region and global events. Equity investment is subject to risks. I or my clients or family members might have positions in the stocks that we mention in our educational posts. We will not be responsible for any Profit or loss that may occur due to any financial decision taken based on any data provided in this message. Do consult your investment advisor before taking any financial decisions. Stop losses should be an important part of any investment in equity.

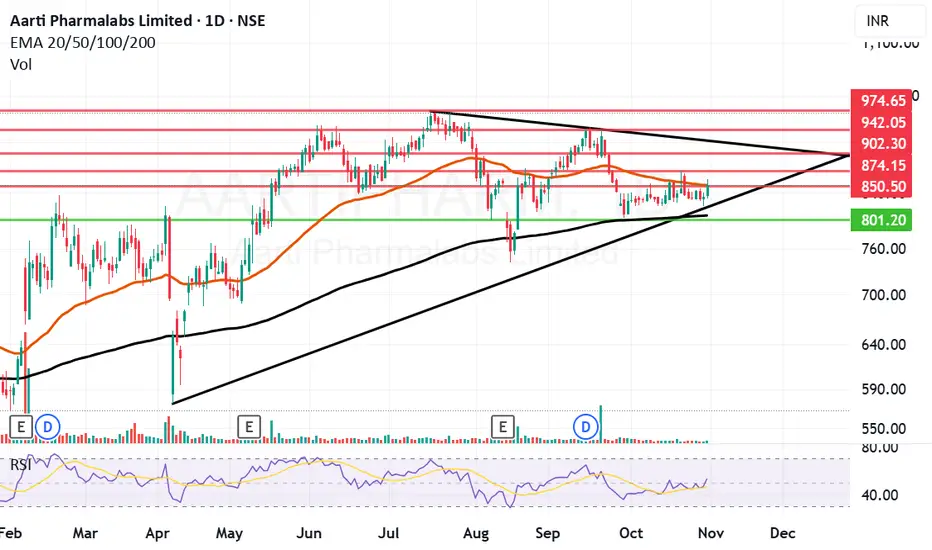
Aarti Pharmalabs trying to breakout after consolidation?Aarti Pharmalabs Ltd. engages in the manufacture and sale of pharmaceutical and nutraceutical products. It offers active pharmaceutical ingredients, pharmaceutical intermediates, new chemical entities, and xathine derivatives.
Aarti Pharmalabs Closing price is 851.95. The positive aspects of the company are Annual Net Profits improving for last 2 years, Companies with Low Debt and FII / FPI or Institutions increasing their shareholding. The Negative aspects of the company are high Valuation (P.E. = 26), High promoter stock pledges, Declining Net Cash Flow: Companies not able to generate net cash, Promoter decreasing their shareholding, Companies with growing costs YoY for long term projects and MFs decreased their shareholding last quarter.
The momentum in the stock can built if there is a closing above 851 Historical Resistance in the stock will be 874 and 902. PEAK Historic Resistance in the stock will be 942 and 974. Stop loss in the stock should be maintained at Closing below 801.
Disclaimer: The above information is provided for educational purpose, analysis and paper trading only. Please don't treat this as a buy or sell recommendation for the stock or index. The Techno-Funda analysis is based on data that is more than 3 months old. Supports and Resistances are determined by historic past peaks and Valley in the chart. Many other indicators and patterns like EMA, RSI, MACD, Volumes, Fibonacci, parallel channel etc. use historic data which is 3 months or older cyclical points. There is no guarantee they will work in future as markets are highly volatile and swings in prices are also due to macro and micro factors based on actions taken by the company as well as region and global events. Equity investment is subject to risks. I or my clients or family members might have positions in the stocks that we mention in our educational posts. We will not be responsible for any Profit or loss that may occur due to any financial decision taken based on any data provided in this message. Do consult your investment advisor before taking any financial decisions. Stop losses should be an important part of any investment in equity.
Sold Half CTSH. Raised Stops to Break Even.Trading Fam,
I feel that we are closing in on a local top here in the U.S. stock market for a while. My target on Cognizant Tech. may have been too aggressive above that 200 SMA and 350 SMA so, I've decided to sell half, capture any profits that I have, and raise my stops to break even on the remainder of this position. You know where to catch the remainder of my open positions.
This last move takes my portfolio up to 86% profit on the year. We've have closed the last 17 exits as profit with an average profit of almost 30%. Congrats to all those who have been following me and my new indicator over the past year. We've done well and I expect more to come, though, we may have to start looking at some shorts at this time.
✌️Stew

HIMX 1D - eyes back on the screen?Himax Technologies is shaping a strong setup: after breaking above the downtrend line, the stock is now retesting the $8.70–$9.00 support zone, aligning perfectly with previous resistance and short-term EMAs. It’s a textbook breakout + retest situation.
All moving averages (MA/EMA/SMA) are below the price, confirming that buyers are in control. The bullish targets are set at $10.41 and $12.49. As long as the $8.70 level holds, the uptrend scenario stays valid.
On the fundamental side, Himax remains a key player in display driver ICs, particularly for AR/VR and automotive applications. With the growing adoption of smart displays and head-up tech, the stock could light up again.
Tactical plan: watch $8.7–9.0 carefully. If buyers hold the line - it’s showtime. If not - let the chip cool down before the next rally.

Is Restaurant Brands International Burger King stock a buy?Burger King (QSR): Weekly Demand Gaining Strength
Now let’s look at Restaurant Brands International (QSR) — the powerhouse that owns Burger King, Popeyes, Tim Hortons, and Firehouse Subs. QSR has a weekly demand level in control around $63, which has recently produced a strong bullish impulse in the smaller timeframes.
That tells us demand is stepping in — no question about it. However, there’s a difference between having a weekly imbalance and having a monthly one. The weekly demand is shorter-term. It can create powerful moves, but it doesn’t hold the same institutional weight as a monthly imbalance.
Weekly demand means swing traders and shorter-term investors are active, while monthly imbalances indicate long-term capital allocation. So even though QSR looks healthy in the short term, its control zone sits one timeframe below McDonald’s, which automatically makes MCD the stronger and safer play from a structural perspective.

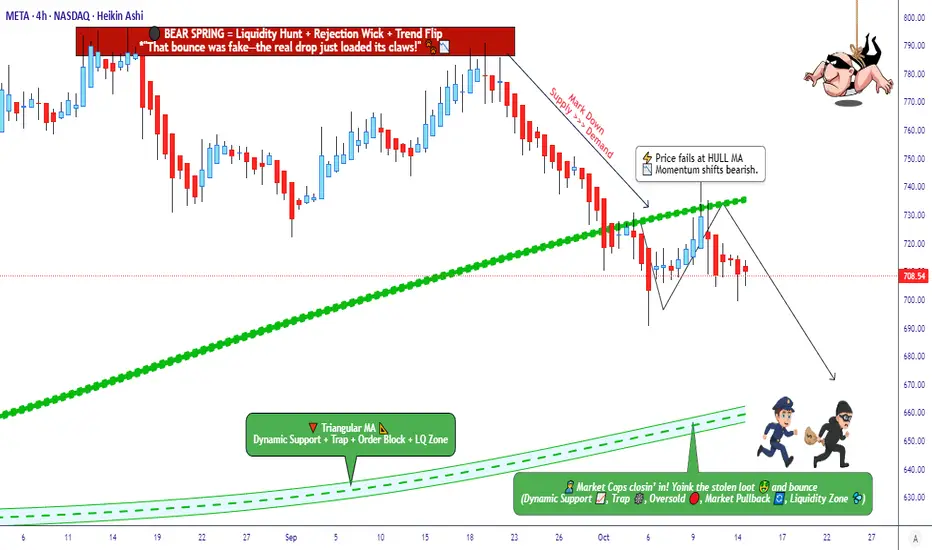
META Platforms Chart – Technical Reversal Signals Sell Momentum🎯 META's Bearish Heist: Time to Rob the Bears' Bank! 💰
📊 Asset Overview
META PLATFORMS, INC - The social media giant is about to get socially distanced from higher prices!
🔍 Market Analysis
Current Setup: Bearish Momentum Confirmed ⚠️
The Hull Moving Average just broke down like my New Year's resolutions! 🐻 Bears have grabbed the steering wheel and they're driving this bus downhill. The technical setup is screaming "SHORT" louder than your stop loss alerts at 3 AM.
🎭 The "Thief Strategy" Game Plan
🎯 Entry Strategy: Layer Like a Pro
The Layered Limit Order Approach (because catching falling knives is for amateurs!)
Layer 1: $740 🎯
Layer 2: $730 🎯
Layer 3: $720 🎯
Layer 4: $710 🎯
You can add more layers based on your risk appetite and portfolio size. Think of it as building a profit sandwich - the more layers, the tastier! 🥪
Alternative: Direct market entry at current price levels (for the adrenaline junkies among us)
🛡️ Risk Management
🚨 Stop Loss: $760
⚠️ IMPORTANT NOTE: Dear Thief OG's (Ladies & Gentlemen),
This is MY stop loss level based on my risk tolerance. This is NOT a recommendation - you MUST set your own stop loss based on YOUR risk management rules. Trade at your own risk, secure your own bag! 💼
🎯 Profit Target
💎 Target: $660
Why $660?
✅ Triangular Moving Average acting as Fort Knox-level support
✅ Oversold conditions brewing like a perfect storm
✅ Bull trap zone where buyers might step in
✅ Technical barricade stronger than a police checkpoint 🚓
⚠️ IMPORTANT NOTE: Dear Thief OG's,
This is MY take profit level. You can exit whenever you want - secure those gains at YOUR comfort zone. Take profits when you're happy, not when I tell you! Your money, your rules. 💵
📈 Related Pairs to Watch
Keep your eyes on these correlated assets:
🔗 NASDAQ:GOOGL - Fellow tech giant showing similar bearish pressure
🔗 NASDAQ:AAPL - Tech sector leader; weakness here confirms broader tech selloff
🔗 NASDAQ:MSFT - Big tech correlation play
🔗 NASDAQ:AMZN - FAANG/Magnificent 7 correlation
🔗 NASDAQ:QQQ - Nasdaq ETF; META's moves often mirror tech sector sentiment
Key Correlation: When META sneezes, social media stocks catch a cold! Watch NYSE:SNAP and NYSE:PINS for sympathy plays.
🎪 The Thief Style Philosophy
This isn't your grandpa's trading strategy - we're playing chess while others play checkers! ♟️ The "Thief" approach uses strategic layering to maximize entry opportunities while managing risk like a boss.
Remember: We're not thieves in the literal sense - we're just stealing profits from the market inefficiencies! 😎
📊 Technical Summary
✅ Hull MA Breakdown Confirmed
✅ Bearish Momentum Building
✅ Multiple Technical Resistance Overhead
✅ Risk-Reward Ratio Favoring Shorts
✨ If you find value in my analysis, a 👍 and 🚀 boost is much appreciated — it helps me share more setups with the community!
#META #MetaPlatforms #StockMarket #SwingTrading #DayTrading #TechnicalAnalysis #BearishSetup #ShortSetup #HullMovingAverage #ThiefStrategy #LayeredEntry #RiskManagement #TradingStrategy #StockTrading #MarketAnalysis #TradingIdeas #TradingView #FAANG #TechStocks #BearishMomentum