$UUUEntry : CMP
TP1 : 57.8
TP2 : 95.81
TP3 : 127.53
SL : If you wish
P.s. : note the levels on the bottom...
⚠️ Financial Disclaimer:
This post is not financial advice. I am not your financial advisor, your life coach, or your legally responsible adult.
Always do your own research and never trade based solely on internet comedy.
Stockstrading

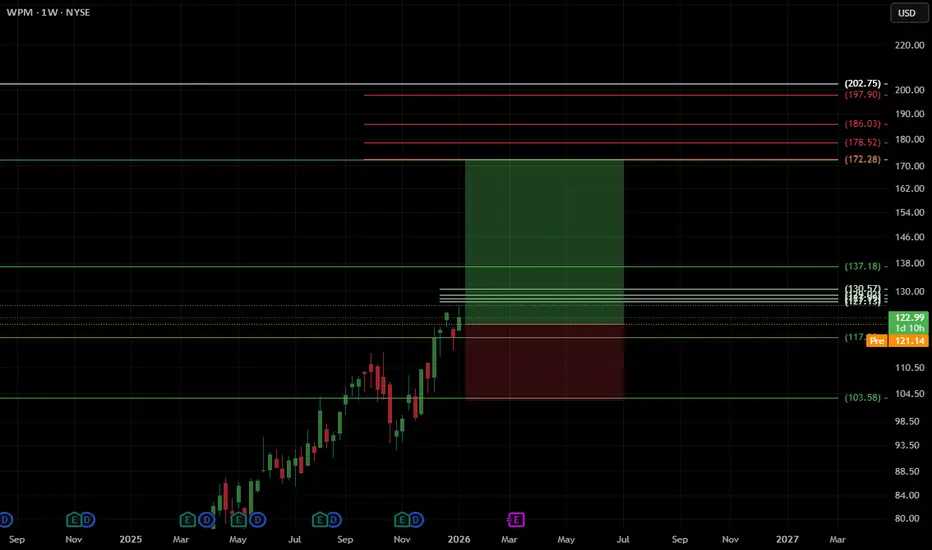
$WPMEntry : CMP
TP : 172.36
SL : if you wish
⚠️ Financial Disclaimer:
This post is not financial advice. I am not your financial advisor, your life coach, or your legally responsible adult.
Always do your own research and never trade based solely on internet comedy.
$LDI , SetupEntry : CMP
TP : 18.25
SL : If you wish
⚠️ Financial Disclaimer:
This post is not financial advice. I am not your financial advisor, your life coach, or your legally responsible adult.
Always do your own research and never trade based solely on internet comedy.

$BULL , SetupEntry : CMP
TP1 : 14.11
TP2 : 21.59
SL : If you wish
⚠️ Financial Disclaimer:
This post is not financial advice. I am not your financial advisor, your life coach, or your legally responsible adult.
Always do your own research and never trade based solely on internet comedy.
Also on:

$UA , SetupEntry : CMP
TP1 : 6.03
TP2 : 8.57
SL : If you wish
This post is not financial advice. I am not your financial advisor, your life coach, or your legally responsible adult.
Always do your own research and never trade based solely on internet comedy.

$IVN SetupEntry : CMP
TP1 : 29.51
TP2 : 35.11
TP3 : 41.81
SL : If you wish
⚠️ Financial Disclaimer:
This post is not financial advice. I am not your financial advisor, your life coach, or your legally responsible adult.
Always do your own research and never trade based solely on internet comedy.

$SOUNEntry : CMP
TP 1 : $27.61
TP 2 : $41.85
SL : if you wish only
On my stock setups, STOP LOSS are just levels to stop putting money and wait for better opportunity
Financial Disclaimer:
This is not financial advice. This is a technical perspective based on price action and market structure. Always manage risk, do your own research, and never trade solely based on a single chart or scenario.

BAC, Massive Descending-Triangle, Huge BREAKOUT-Expansion Setup!Hello There!
Welcome to my new analysis of BAC. In recent times I have spotted important value stocks within the market that have the potential to emerge with a major transformational reversal and indicate main expansional determinations once the appropriate confirmations have emerged. In this case, I have analyzed BAC with the current ongoing underlying dynamics and with BAC it has to be mentioned BAC is a stock that can unfold its full potential with the current Consumer Demand to appropriately increase further. More and more supply-chain disruptions are repaired again and are recovering now, if this dynamic holds on it sets up a crucial turning in the overall market sentiment. Also, the fact that CPI has declined now for a consecutive period of time builds an important market from where stocks as I have spotted in my watchlist confirm the necessary opportunities.
When looking at my chart now, BAC is forming an important structure, firstly as it is still trading within this gigantic ascending-trend channel in which it has the main supports within the lower boundary and already bounced several times within there. Secondly, BAC has the main support levels between the 26.3 and 27.5 area as it is marked in my chart. Thirdly, BAC is already bouncing within the areas and is forming an important support base within this zone. All these factors are building a determined support base from where BAC has considerable potential to emerge with a major reversal and increase the bullish edge.
The most important formation in this whole structure is the momentous descending triangle formation. Such a formation is leading to a meaningful substantial expansion reversal in almost all of the cases. Once the whole descending triangle formation has been completed with the final setup as it is marked in my chart this is going to activate the further bullish price-action accelerations into the upper directions and emerge with the major wave-C within the whole wave-count that BAC already established. The completion of the formation also means BAC is going to activate the target zones within the 62.50 and 66.50 areas.
Now, taking all these factors into consideration, currently, there is a massive digitization boom with digitization developments increasing within recent times and the growth rates in this sector are accelerating. When BAC moves further with the potential to transform their holdings into the newly developed ecosystem this is going to have a tremendous effect on the actual bullish sentiment prevailing here, especially in combination with the fact that the Consumer Expenditures in this sector are increasing. With such a backing and increase of these factors, this is actually indicating that the price-action accelerates in pace. Once the formation has been completed the next phase targets mentioned will be active.
Thank you everybody for watching my idea about BAC. Support from your side is greatly appreciated.
"With a prime perspective on stocks history, we can have a better understanding of the past and present, and thus a clear vision of the stocks future."
VP

DHR, Massive BULLISH Wedge-Formation, Major BREAKOUT Incoming!Hello There!
Welcome to my new analysis of DHR. The stock market is in a really important condition currently as there are many interesting stock gems within the market I have spotted in my analytics backend. One of the interesting gems I recently spotted for a major opportunity on the long side of the market is DHR. This gem has major underlying potential to increase a huge breakout dynamic in the upcoming times.
When looking at my chart now DHR is bouncing several times within the major ascending channel formation, this channel formation is a substantial origin of several support bounces from where DHR could increase with bullish momentum volatility. Now, DHR is bouncing within the range for the next consecutive time and is already marking the level as a main support from where the next main bullish expansion spike is likely to emerge.
What is so important within this whole newly developed formational structure is that DHR is now also forming this momentous descending wedge-formation in which it already completed the coherent wave count especially bouncing within the lower boundary of the wedge and is now building up the further determinations. The fact that DHR already completed the wave count and bounced within the lower boundary is already nearly completing the whole descending wedge formation.
With these main underlying confirmational developments, DHR is building a massive bullish base here. Putting this into perspective this means that DHR is likely to emerge with the final wedge-breakout within the next times which is going to form the completion-setup with the breakout above the boundary as marked in my chart. Once DHR has formed this completion-setup it is going to be the main origin of the bullish wave-expansion towards the upper directions and reaching the target zones with the wave-C extension.
Thank you everybody for watching my idea about DHR. Support from your side is greatly appreciated.
VP

$LIDR Setup on the daily TF .
Enter : 2.30
SL : 2.08
TP : 3.06
Possible 30% upside , ONLY if it goes above 2.30
Financial Disclaimer:
This is not financial advice. This is a technical perspective based on price action and market structure. Always manage risk, do your own research, and never trade solely based on a single chart or scenario.

$LAZR maybeGave a good thought about this one, I´ll put something in to it :
Entry : CMP
TP : 1.10
SL : 0.176
Liquidity zone at 0.18
A few more levels downward...
Be careful!
Financial Disclaimer:
This is not financial advice. This is a technical perspective based on price action and market structure. Always manage risk, do your own research, and never trade solely based on a single chart or scenario.

$DDOG - Quick SetupThis can be a quick one!
Entry : CMP
TP : 158.64
SPM (Stop Putting Money) : 136.4
Re-evaluate : 125
⚠️ Financial Disclaimer :
Nothing here is financial advice. If you trade based solely on internet posts, your wallet may experience high volatility — and possibly a full liquidation event. Always DYOR

$RKLB (NASDAQ) Weekly Structure & Possible ScenariosRKLB is currently trading around a key reaction zone after a strong impulsive move from the recent lows. The weekly structure suggests price is at an important decision point, with liquidity resting both above and below current levels.
At this stage, two primary scenarios stand out:
🟢 Bullish Continuation Scenario
Price holds above the mid-range support zone (~46–50).
A shallow pullback is followed by continuation toward higher-timeframe liquidity.
Upside targets are located around:
~97–100
~105
~112
These levels align with previous supply and inefficiencies on the weekly timeframe.
🟠 Pullback / Re-accumulation Scenario
Price rejects near current levels (~60–62).
Deeper retracement toward the demand cluster around 41–46.
This zone could act as a higher-timeframe support and offer better risk-defined long opportunities if structure holds.
Overall, the higher-timeframe bias remains constructive, but confirmation is needed at current levels. Patience is required to see whether price accepts above resistance or seeks additional liquidity below before continuation.
⚠️ Financial Disclaimer :
Nothing here is financial advice. If you trade based solely on internet posts, your wallet may experience high volatility — and possibly a full liquidation event. Always DYOR

$CRWV Almost therePrice remains in a bearish structure after rejecting higher supply. Previous support has flipped to resistance, and downside liquidity remains untested.
Key focus is on a continuation move toward lower demand zones if price fails to reclaim resistance.
🤡 Not financial advice. Just chart observations.

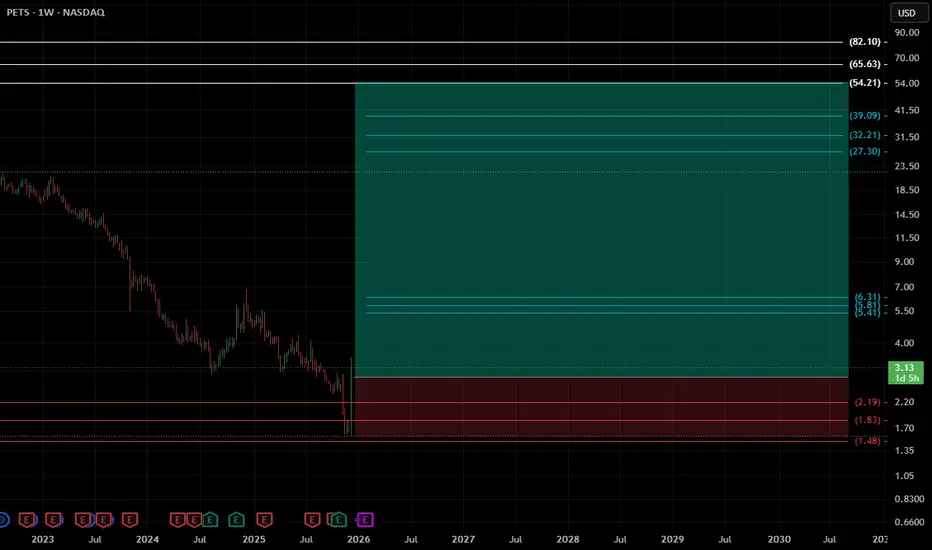
$PETS Macro Demand Zone ActivationAfter an extended multi-year downtrend, PETS is now pressing into a major macro demand zone on the weekly chart. Price has tapped into a long-standing gap region, an area that historically attracts aggressive re-pricing when reclaimed. Early signs of stabilization are emerging, though the structure remains heavily oversold.
🔹 Entry: CMP (Current Market Price)
🔹 Target (TP): 54.21
🔹 Stop-Loss (SL): 1.57
This setup outlines a high-timeframe swing opportunity with an outsized risk-to-reward profile. The TP aligns with stacked inefficiencies and former breakdown levels, representing the first major weekly supply cluster above. A structural shift above the mid-range would strengthen the bullish case dramatically, potentially initiating a long-term reversal phase.
However, failure to hold the demand floor below the gap could expose new lows, fully invalidating the bullish scenario.
⚠️ Financial Disclaimer (the funny one):
This is not financial advice — just a chart that hopes for better days. If you ape into weekly setups without risk management, your portfolio might go on a multi-year downtrend of its own. DYOR and protect your capital like it’s the last slice of pizza.
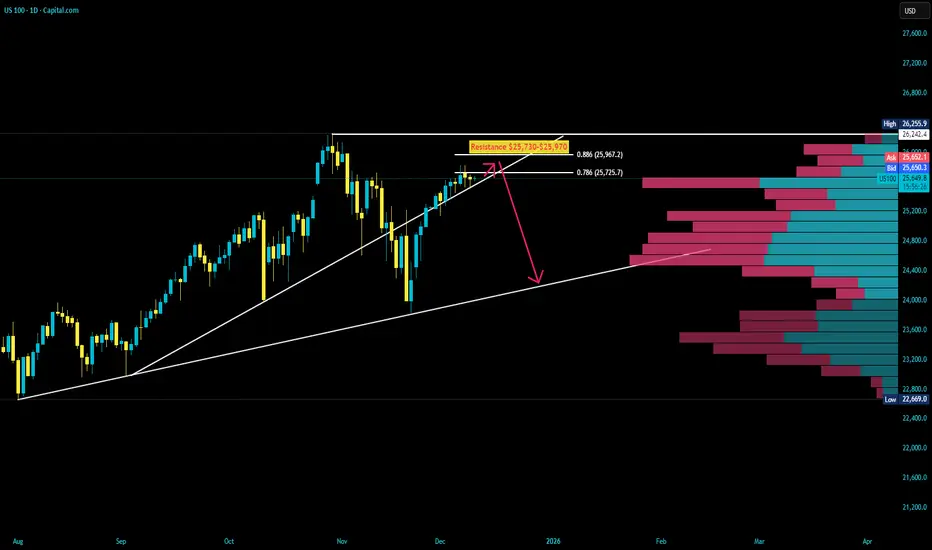
US100 Resistance AheadUS100: Tough resistance zone at 25,730–25,970. If price fails to hold above 25,730 after today’s FOMC decision, a sharp sell-off toward 24,200 becomes highly probable.
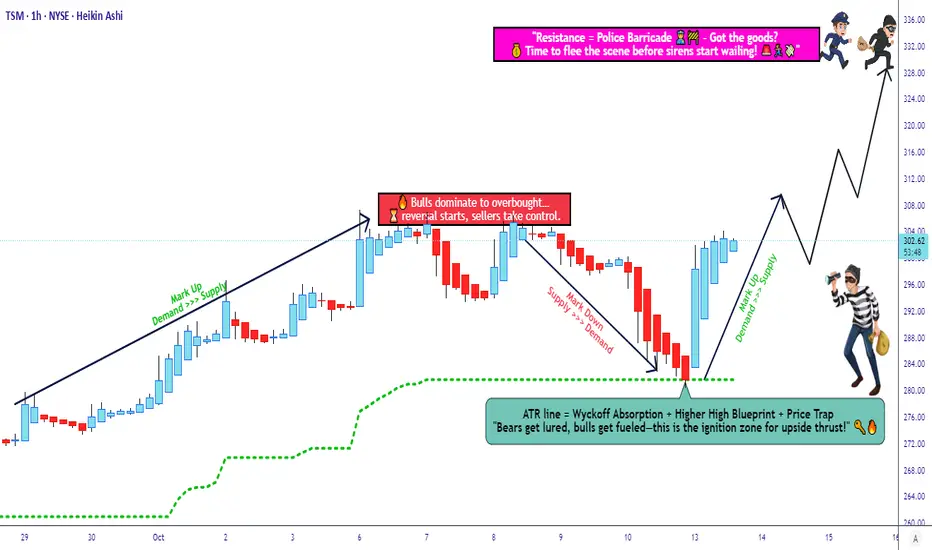
TSM Trade Setup — Strategic Entries and Risk Control🏦 TSM — “The Chip Heist: Thief Layers Up for the Big Loot” 💎
🎯 Market Setup:
TSM (Taiwan Semiconductor Mfg. Co., Ltd) is showing a bullish setup after a potential retest at the ATR line. The ATR retest will confirm buyer strength before momentum kicks in.
💰 Thief’s Master Plan (Layer Entry Tactics)
We scale in like a disciplined thief stacking gold bars:
Buy Limit 1 → 288
Buy Limit 2 → 292
Buy Limit 3 → 296
Buy Limit 4 → 300
(You can add more layers depending on your plan and risk appetite.)
🕵️♂️ Each layer reduces average entry cost and catches dips before the next move.
🧨 Stop-Loss Protocol:
Thief’s SL → 280
⚠️ This is my personal stop. Set your own stop according to your risk tolerance.
💎 Profit Extraction Zone (Target):
Target → 330 (Police Barricade / resistance zone + potential overbought trap)
Lock profits before the “trap” — that’s where pros exit quietly. 🚔💨
🧠 Key Cross-Market Links (For Confirmation)
Watch correlated tickers for better trade context:
NASDAQ:ASML → European semiconductor momentum
NASDAQ:NVDA → US chip leader, sentiment gauge
$SOX.X → Philadelphia Semiconductor Index, sector strength
NASDAQ:TSLA → Proxy for chip demand (AI + EV)
If NVDA and SOX are strong, TSM retest is likely to succeed. If they stall, be cautious.
📊 Trade Summary (Normal Format)
Confirmation: Retest at ATR line (momentum check)
Entry Plan: Layer buys at 288 / 292 / 296 / 300
Stop: 280 (adjust as needed)
Target: 330 resistance zone
Risk/Reward: Approx. 1:2.5+ depending on execution
💬 Side Note (For Thief OGs Only)
Not financial advice. We rob liquidity, not peace of mind. 😎
Trade it your way, manage risk, and protect your capital — that’s the real treasure.
✨ “If you find value in my analysis, a 👍 and 🚀 boost is much appreciated — it helps me share more setups with the community!”
⚠️ Disclaimer: This is a Thief-style trading strategy shared just for fun. Trade responsibly and DYOR before entry.
#TSM #Semiconductors #SwingTrading #DayTrading #TradingStrategy #StockMarket #BullishSetup #TradingView #ThiefTrader #LiquidityHunt #ATRstrategy #SmartMoneyConcepts #LayerEntry
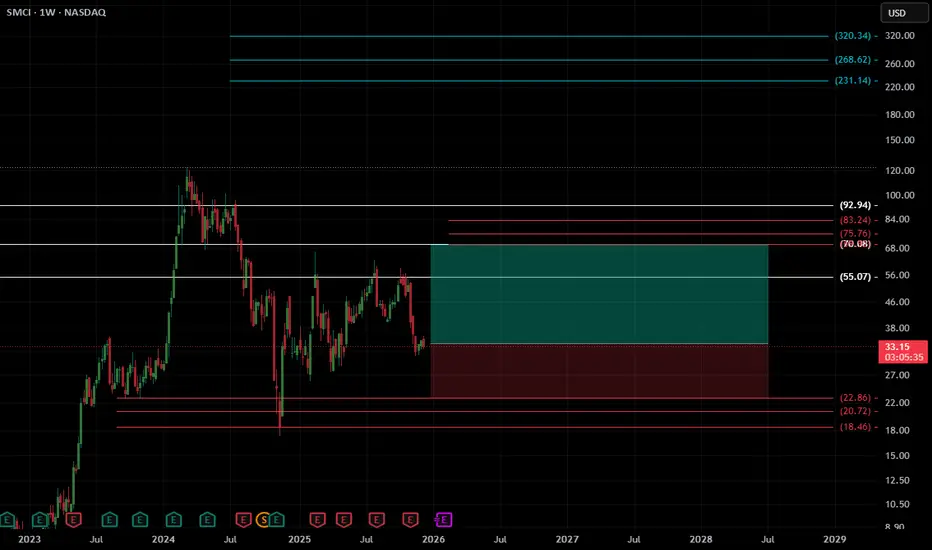
SMCI Weekly Rebound Setup (1W)SMCI has pulled back into a key higher-timeframe demand zone, where price has shown repeated reactions and absorption of sell-side pressure. After a long corrective phase, the weekly chart is now forming a potential base, suggesting the possibility of a broader recovery leg toward overhead inefficiencies.
Price is currently sitting at CMP, right on top of a structural support cluster that has historically launched strong rallies. With volatility compressing and wicks showing buyer defense, SMCI may be preparing for a macro rebound.
🔹 Entry: CMP
🔹 Target (TP): 69.65
🔹 Stop-Loss (SL): 22.95 (stop adding money here and wait)
This setup targets a move back toward the major weekly imbalance above, aligning with prior distribution structure and unfilled liquidity. A weekly close above 55–56 would strengthen the bullish case, potentially accelerating the move into the 70+ zone.
A breakdown below 22.95 would invalidate the idea and imply continuation of the larger downtrend.
Trade Management
Partial profits can be taken as price approaches 55–56, the first significant weekly resistance.
Momentum confirmation: a strong weekly close above 56 opens room for continuation toward 70+.
Hard invalidation: Weekly close below 22.95.
⚠️ Financial Disclaimer :
Not financial advice. Just chart art. If you go long because the lines look optimistic, SMCI may choose violence instead. Always DYOR and protect your capital.
$OLMA (NASDAQ) – Technical Setup UpdateOLMA has cooled off after its explosive upside move, and price is now hovering near the upper boundary of a developing distribution zone on the 15-minute chart. The recent rejection from the mid-range aligns with weakening momentum and a potential rotation back toward the major demand cluster below.
🔹 Entry: 25.81 or CMP
🔹 Target (TP): 12.85
🔹 Stop-Loss (SL): 29.73
This setup outlines a high risk-to-reward short opportunity, with the TP aligning precisely with a multi-layered demand zone and prior imbalance. A clean break below the micro-support could accelerate a move toward the 12–13 region, where several unmitigated liquidity levels converge.
A sustained hold above the stop region, however, would invalidate the short bias and hint at continuation toward the higher inefficiency bands.
⚠️ Financial Disclaimer (the funny one):
None of this is financial advice. If you trade solely because a chart on the internet looked convincing, your account may perform a dramatic reenactment of gravity. Always DYOR and protect your tendies.

XXI (NYSE) – Technical Setup Update - RISKYAfter the initial volatility following its first trading sessions, XXI is now showing early signs of stabilization within a developing intraday accumulation zone. Price has reacted positively near the lower liquidity pocket, forming a sequence of higher lows on the 1H timeframe.
🔹 Entry: CMP
🔹 Target (TP): 13.64
🔹 Stop-Loss (SL): 10.73
This setup offers a favorable 3:1 risk-to-reward, with the TP aligned with the next key inefficiency and previous supply cluster. A break and sustained hold above the mid-range would further support bullish continuation toward the target zone.
⚠️ Financial Disclaimer :
Nothing here is financial advice. If you trade based solely on internet posts, your wallet may experience high volatility — and possibly a full liquidation event. Always DYOR.

$CVNALadies and gentlemen, behold the weekly chart of CVNA — a stock that has already broken every rule of logic, technical analysis, and emotional stability… yet here we are again, plotting targets like optimistic maniacs.
Here’s the official battle plan:
📌 Entry: ~455
🛑 Stop Loss (SL): ~376
🎯 Take Profit Levels:
• TP1: ~639
• TP2: ~696
• TP3: ~768
• TP4: ~910
Yes — those are triple-digit percentage targets.
Yes — the R:R ratio is so beautiful it deserves its own Netflix documentary.
And yes — this chart has enough Fibonacci extensions to summon an ancient trading deity.
We’re talking about a potential +100% move that screams:
“Is this real analysis or pure hopium?”
Answer: Why not both.
CVNA has that special volatility that can send us to TP4 in style…
or wick us straight to SL before the market even opens.
Exactly the kind of chaos we live for. 🤝🔥
So buckle up — because if this plays out, we’re driving this Lambo to Valhalla.
And if it doesn’t?
At least we had a cool chart.
⚠️ Financial Disclaimer:
This is NOT financial advice. I’m not your advisor, your mentor, or your emotional stabilizer.
Trading involves risk — including losses, stress, overcaffeination, and the urge to “recalculate everything.”
Always DYOR and never trade solely based on memes, vibes, or attractive R:R setups.

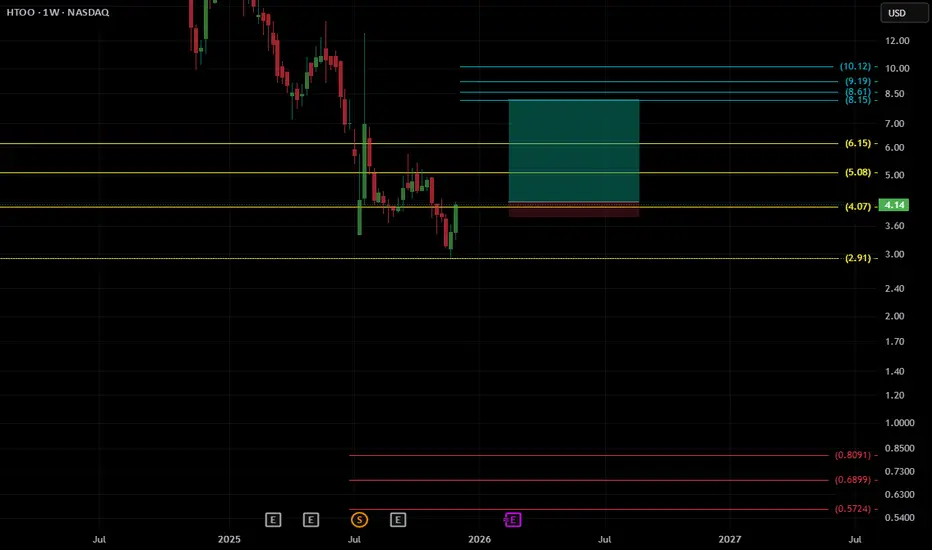
$HTOO: The Dip-Diving, Liquidity-Hunting, Emotion-Testing SetupAlright traders, gather around, because I’ve spotted something that looks like a chart…
but behaves like a roller coaster built by someone who’s never passed a safety inspection.
HTOO has officially entered that sacred zone where price either:
A) respects the levels like a well-trained student,
or
B) breaks through everything like it just got dumped and wants everyone else to suffer.
Entry : CMP
TP : 8,17
SL : 3.83
We’ve got liquidity, we’ve got weak lows, we’ve got upside targets that look like they were placed there by an optimistic toddler…
and yes — a risk-to-reward ratio that makes me feel things. Confusing things. 😵💫
Will this trade moon?
Will it tank?
Will it go sideways until my grandchildren graduate college?
Probably.
But hey — trading is 50% analysis, 50% psychology, and 100% hoping the market maker had a good breakfast.
⚠️ Financial Disclaimer:
This is not financial advice. I’m not responsible for gains, losses, emotional damage, broken keyboards, or sudden career changes.
Always do your own research, use proper risk management, and never trade based solely on posts that contain jokes.
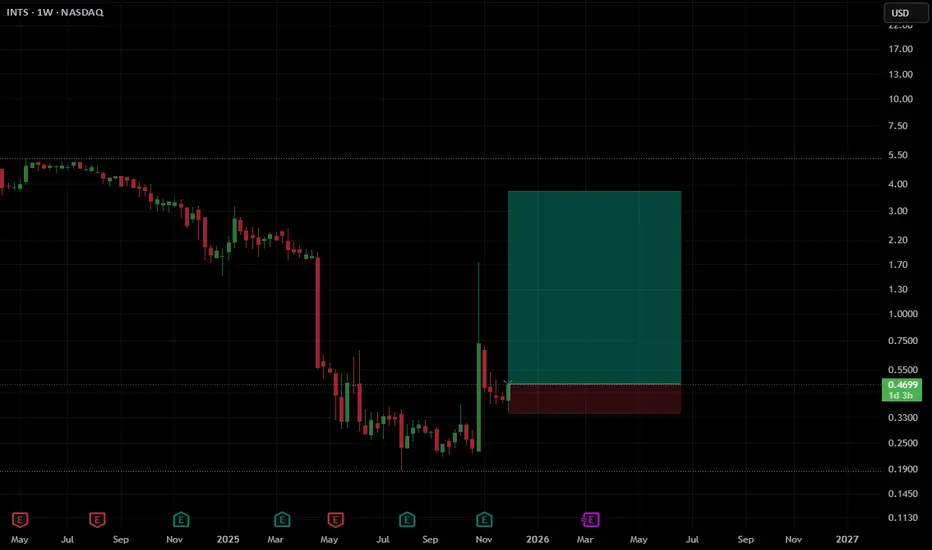
$INTS – Weekly Setup | High-Risk / High-Reward Swing PlayINTS remains heavily depressed after a long downtrend, but the recent weekly structure is starting to show signs of stabilization and potential accumulation.
This setup presents a very aggressive risk–reward, with substantial upside potential if price can hold above the recent support area.
📌 Entry
≈ 0.47 USD
📉 Stop-Loss
≈ 0.3445 USD
Below the most recent pivot — structure would be invalid if this level breaks.
🎯 Take-Profit (Main Target)
≈ 3.76 USD
Targeting prior imbalance + old liquidity zone around 3–4 USD.
📊 Risk / Reward
RR ≈ 1 : 6.8
Potential upside of over 680% if the target is reached.
📎 Technical Breakdown
Massive weekly selloff followed by compression and a strong impulse candle.
Potential CHoCH emerging.
Large liquidity pool above still untouched.
Highly speculative microcap setup; extremely volatile.
⚠️ Note
High-risk play. Valid only while price holds above 0.34 USD.