EURGBP | Retail 80% Long: Selling the RallyOn the daily timeframe, EURGBP continues to move inside a well-defined descending channel. The latest bearish impulse pushed price directly into the 0.865–0.860 demand zone, where we’re seeing an initial technical reaction — but still no clear signs of a full reversal.
RSI is hovering near oversold territory, which increases the probability of a corrective bounce. However, as long as price stays below the 0.872–0.878 supply area, the dominant bias remains bearish.
The COT report provides a more structural perspective:
institutional traders remain net long EUR and net short GBP, meaning that — in the medium term — the broader context still favors a bullish EURGBP. However, in recent weeks we’ve noticed:
• a slowdown in the growth of EUR long positions
• early signs of short covering on GBP
This does not invalidate the EUR>GBP narrative, but it does suggest that the euro’s advantage is weakening.
Seasonality in January is historically slightly negative for EURGBP: the month often starts with weakness and only stabilizes later. This is consistent with the current downside move.
Retail sentiment, on the other hand, is extremely skewed:
more than 80% of retail traders are long EURGBP.
From a contrarian perspective, this supports the idea of further downside.
Overall picture suggests:
• bearish technical structure
• COT still pro-EUR, but losing momentum
• unfavorable seasonality
• retail heavily exposed on the long side
For that reason, I currently treat EURGBP as a “sell the rally” market:
any rebounds into 0.872–0.878 (or mid-channel) may offer short setups with potential targets:
→ 0.860
→ 0.855
→ and, in extension, deeper liquidity pockets below
The bearish bias would be invalidated only by a daily close above 0.880–0.882, especially if supported by renewed COT strength and an improvement in sentiment.
Strategy!

GOLD | Pullback in the making? Watching the FVG and demand zoneGold continues to trade inside a well-defined bullish channel on the daily chart, but the last vertical expansion has created vulnerability to deeper pullbacks. The strong impulse followed by rejection signals profit-taking and a potential transition from momentum phase to corrective phase.
In the short term, price may complete a technical bounce toward the midline of the channel, before potentially rotating lower into the Fair Value Gap around 4.240–4.260. A breakdown below this area would open room toward lower demand zones, aligned with previous institutional order flow still unmitigated.
RSI has exited overbought territory, indicating waning momentum and consistent with a trend-normalization phase.
Positioning:
The COT report shows Non-Commercials increasing long exposure, supporting a medium-term structural bullish bias. However, the simultaneous expansion of shorts highlights growing hedging activity and the potential for corrective volatility.
Seasonality for January historically shows positive average performance, but often after interim drawdowns — reinforcing the idea of a technical pullback before any renewed extension higher.
Retail sentiment remains predominantly long. Typically, when most traders are positioned in the same direction, the probability of contrarian moves increases, adding weight to the short-term downside scenario.
Trading bias:
Medium-term bullish, but preference remains for entries on deeper pullbacks into value areas rather than chasing late breakouts.
Key levels:
• 4.560 — upper channel resistance
• 4.260 — FVG and first liquidity zone
• 4.170-4.200 — intermediate demand
• 4.000-4.070 — primary strategic demand zone
Plan:
Wait for a retracement into marked zones and look for clear accumulation patterns and bullish re-engulfing confirmations before considering new long positions.

The one thing that destroys tradersEmotional inflation is a measurable drag on trading performance, particularly in crypto where momentum cycles are short, liquidity is thin, and feedback loops are fast. After a trader strings together strong wins, confidence often expands faster than process. The trader begins to treat recent outcomes as a new baseline for risk. This leads to size increases, earlier entries, or skipping structural confirmation because the mind assumes the market will continue to cooperate. It feels logical in the moment, but it is not rooted in market behavior. The market eventually tests this inflated confidence through liquidity sweeps, compressed volatility, or reclaiming defensive structure. The result is capital giveback, distorted expectations, and emotional volatility that exceeds price volatility.
The cost of emotional inflation is not that it creates bad trades. The cost is that it removes the conditions that made your best trades possible. When confidence accelerates exposure before the market proves continuation through structure and liquidity, you are no longer trading opportunity. You are trading assumption. Crypto punishes assumption faster than most markets because liquidity leaves quickly, bid depth changes abruptly, and breakout traders provide easy fuel for counter moves.
Inflation becomes visible in three repeatable behaviors: increasing size during expansion phases instead of compression phases, entering at the first touch of a level instead of after a structural transition, and treating recent wins as proof of future market cooperation. These behaviors are not personality flaws. They are pattern loops that can be corrected with objective rules and sequencing.
To counter emotional inflation, you need guardrails that do not depend on feelings. The first guardrail is a fixed sizing model tied to volatility conditions, not P&L conditions. Size should increase only when volatility tightens, liquidity aligns cleanly, and structure confirms control. In expansion phases, size must stay anchored to predefined limits because invalidation distance widens when liquidity thins. This keeps risk mathematically stable while confidence psychologically fluctuates.
The second guardrail is daily narrative rebuilding. Bias is constructed from the higher timeframe story, not the previous trade’s outcome. If the weekly and daily structure have not changed, your job is to wait for liquidity incentives and micro-structural permission before expanding exposure. A trader who rebuilds bias every session stays psychologically neutral when the market is structurally neutral.
The third guardrail is retest discipline. A retest is not a candle. It is acceptance. The retest validates participation, reduces invalidation distance, and reveals whether the market internalized the structural break or sweep. Entering before the retest is entering during the liquidity hunt. Entering after the retest is entering after participation is proven. This is where professionals position, not because they are late, but because they are validated. Retests compress emotional cycles because they remove the need to hope a level will hold.
The fourth guardrail is execution quality scoring.
Track trades by sequence: liquidity taken first, structure broken second, displacement confirmed third, retest respected fourth. Grade your execution on fill precision, conditional sizing, and narrative alignment. This shifts confidence from results to behavior, which compounds careers instead of compressing them.
A journal becomes a solution only when it measures variables that lead to intervention, not reflection. Measure session volatility, invalidation distance, average R:R delivered, liquidity incentives present, and whether the entry occurred inside premium or discount relative to equilibrium. This reveals inflation risks before they hit your equity curve.
Emotional inflation loses its power when you treat streaks as feedback, not permission. The best funded crypto traders do not compound because they avoid risk. They compound because they only expand risk when the market contracts volatility, aligns liquidity, and confirms structure. Confidence should drive preparation, not replace it.
Calibration compounds. Inflation decays. Careers are built by traders who stay calibrated longer than they stay confident temporarily.

ICICI PRU | Weekly Bullish Options Setup | 27 Jan ExpiryTrade Structure (Text Format)
• Sell 680 PE
• Buy 670 PE
• Defined-risk bull put spread
Why this setup works
NSE:ICICIPRULI ICICI Prudential is holding above key support near the 675–680 zone after a healthy pullback. Price is stabilising above the lower band, RSI is holding the mid-zone, and put-side open interest is building around 680, indicating strong downside support.
With time decay in our favour and no immediate breakdown signals, this structure benefits if the stock simply stays above support.
View
Moderately bullish — expecting ICICI PRU to hold above 680 and consolidate higher into expiry.
This post is for education only. It’s not financial advice or a recommendation to trade.
#WeeklyOptions #BullPutSpread #ICICIPRU #OptionsTradingIndia #NSEOptions #ThetaGang #HighProbabilityTrades #DefinedRisk

PREMIERENE | Weekly Bearish Options Setup | 27 Jan ExpiryTrade Structure (Text Format)
• Sell 850 CE
• Buy 870 CE
• Defined-risk Bear Call Spread
Why this setup works
NSE:PREMIERENE PREMIERENE is facing strong supply near the 850–860 zone, with price struggling to sustain above resistance. Momentum is weakening, RSI is rolling over from the mid-zone, and upside attempts are getting sold into.
Call OI is heavy near 850, indicating capped upside. With stable IV, call spreads offer efficient risk-defined positioning for a bearish view.
View
Moderately bearish — expecting the stock to stay below 850 and drift sideways to down.
This post is for education only. It’s not financial advice or a recommendation to trade.
#WeeklyOptions #BearishSetup #OptionsTradingIndia #BearCallSpread #NSEOptions #PremiumDecay #PriceActionTrading #StockMarketIndia #RMInvestech

STRATEGY Is this a 2000 Dotcom crash all over?Strategy (MSTR) has been on a strong sell-off since its November 2024 All Time High (ATH). A little more than 1 year of downtrend is classified as a Bear Cycle and it may be no coincidence that this ATH was priced marginally above Strategy's previous ATH of March 2000.
That was at the peak of the infamous Dotcom Bubble and its subsequent collapse. So are we having a 2000 crash all over again? Well, with Strategy's core business being exclusively Bitcoin related, we are poised to have a big one (since it follows BTC's Cycle to a certain extent) but not just as enormous as 2000's, which exceeded -99%, dropping the company to the brink of extinction.
Technically, we can have a correction of -90% though, which is the decline that the previous Bear Cycle in 2022 suffered. After all the dominant multi-decade pattern since the Dotcom bottom, has been a Channel Up, with the recent ATH testing its top and the 1M MA200 (orange trend-line) marking its Lows, hence the best buy opportunities in the last 10 years.
As a result, our long-term Target on MSTR remains $60.00, which would be a -90% correction from the Top, while also making direct contact with the 1M MA200. P.S. Notice also the similarities between the 1M RSI sequences.
---
** Please LIKE 👍, FOLLOW ✅, SHARE 🙌 and COMMENT ✍ if you enjoy this idea! Also share your ideas and charts in the comments section below! This is best way to keep it relevant, support us, keep the content here free and allow the idea to reach as many people as possible. **
---
💸💸💸💸💸💸
👇 👇 👇 👇 👇 👇

2026 roadmap for gold xauusd with my strategy Trading Roadmap Based on a Proprietary Strategy
Introduction
As we look toward 2026, this analysis presents a comprehensive and well-structured roadmap for trading XAU/USD (gold) grounded in my proprietary strategy. The focus is on key market drivers, technical indicators, and geopolitical factors to provide traders with actionable insights and a clear vision of potential price trajectories for gold in the coming year.
Objectives of the Report
Delve into the fundamental and technical aspects likely to influence gold prices in 2026, including anticipated shifts in monetary policy, inflation trends, and global economic conditions.
Identify key support and resistance levels, chart patterns, and relevant indicators that can guide buying and selling decisions, with a particular emphasis on swing positioning.
Analyze the impact of external factors such as interest rates, currency fluctuations, and market sentiment on gold’s performance.
Provide a practical framework for implementing my strategy, equipping traders to navigate the complexities of the gold market and seize profitable opportunities in the year ahead.
Structure of the Analysis
Macro View and Market Catalysts for 2026
Monetary Policy: Anticipated changes in interest rates and policy measures that could influence gold.
Inflation and Economic Growth: Assess global inflation trends and their implications for gold as a safe-haven asset or inflation hedge.
Physical Demand and Supply: Considerations from key markets (jewelry, investment demand, ETFs) and their impact on price dynamics.
Technical Analysis and Key Levels
Key Supports: Identify price levels where reactions are likely.
Key Resistances: Areas where price may encounter resistance.
Important Chart Patterns: Triangles, channels, and other salient patterns guiding potential directional moves.
External and Internal Indicators: Moving averages, RSI, MACD, and other tools embedded in your proprietary strategy.
Geopolitics and Market Sentiment
Geopolitical events and policy decisions by major economies and their effects on fear/uncertainty and hedging demand for gold.
Currency volatility and its relationship with XAU/USD.
Execution Framework for 2026
Entry and exit considerations: Combine key levels with signals from your technical indicators.
Risk Management: Position sizing, stop-loss, take-profit, and risk controls aligned with your risk profile.
Roadmap for Positioning: How to adapt to evolving market conditions and optimize swing opportunities.
Key Takeaways for Maximizing Profitability
Rapid adaptation to economic news and central bank announcements.
Continuous monitoring of technical indicators and dynamic re-leveling of levels on breakouts or retests.
Maintain flexibility in the strategy to accommodate sudden market shifts.
2026 Market Outlook
Technical Analysis and Key Levels
Geopolitical and Sentiment Analysis
Execution Strategy with Actionable Steps
Risk Management and Capital Allocation
Conclusion and Final Outlook for Swing Trading
these levels in my chart are key levels for your swing trade

GBPUSD – Daily Bullish Channel While Specs Stay ShortOn the daily chart GBPUSD is still respecting a clear bullish channel from the November lows. Price just reacted from a previous imbalance / FVG around 1.34 and is consolidating inside a broader supply zone, but structure remains constructive as long as we hold the mid–lower part of the channel.
1. Daily structure
After the October–November selloff, GBPUSD has been making higher highs and higher lows inside an ascending channel. Current price is trading around the mid-range of that channel, with a small pullback into the daily FVG / demand around 1.3360–1.3430. As long as daily closes hold above this block and the lower trendline, the path of least resistance remains to the upside, with room into the higher supply layers between 1.3550–1.3600 and above.
2. COT data (GBP & USD Index)
GBP futures: non-commercials are still net short, but they have started to cover shorts (short positions decreasing while longs tick higher). This suggests the pain trade is still to the upside if price continues to grind higher. Commercials are net long GBP, which fits with accumulation into prior lows. USD Index futures: specs are slightly net short USD, which reinforces a softer-USD backdrop and supports a bullish bias on GBPUSD as long as risk sentiment does not deteriorate sharply.
3. Seasonality
Seasonality on GBPUSD shows that recent years (5–10Y and especially 2Y) tend to favour mild GBP strength into late December / early January, while the very long-term average is more neutral. I interpret this as a supportive, but not decisive, tailwind: seasonality aligns with the current bullish structure but is not a stand-alone signal.
4. Sentiment
Retail traders are slightly net short into a rising market – a contrarian bullish signal, but not yet at an extreme. This fits with the idea of buying dips while the crowd tries to fade the trend.

XAUUSD | HTF Support Buy | SMC Setup Bias: Bullish
Timeframe: 2H
Gold pulled back from ATH and is now reacting from a strong HTF demand zone after filling the 2H FVG. The move looks corrective, not a reversal.
Confluence:
LTF Market Structure Shift (MSS)
FVG mitigation complete
Strong reaction from $4,302 – $4,314 HTF support
Trade Setup: soon

The Most Common Entry Mistake Traders Never NoticeMost traders do not lose because their strategy is flawed. They lose because they enter trades before the market has actually shown its intent. This mistake is subtle, easy to justify in the moment, and repeated so often that it becomes invisible. Over time, it slowly erodes consistency and confidence.
The problem usually starts with anticipation. Price approaches a key level, a wick forms, or a candle closes in the expected direction. The setup looks familiar, so the trader assumes the market is ready to move. But at that stage, nothing has been decided. The market is still neutral. What feels like early positioning is often just guessing inside uncertainty.
Markets do not move to reward speed. They move to collect liquidity. Before any meaningful expansion, price typically sweeps highs or lows, triggers stops, and tests obvious areas of interest. Traders who enter too early place themselves directly in this process. When price reverses and stops them out, it feels like bad timing, but structurally the market was doing exactly what it needed to do.
A key misunderstanding is believing that a level being touched equals intent. It does not. A reaction alone is not direction. Real intent only appears after the market responds with structure. This means a clear break in micro structure, decisive movement away from the level, and follow through that shows one side has taken control.
Another common trap is confusing speed with strength. Fast candles into a level can feel convincing, but aggressive moves without confirmation often lead to exhaustion rather than continuation. Strength is not defined by how quickly price reaches a level, but by what it does after that level is tested.
Confirmed entries are patient. Liquidity is taken first. Structure shifts second. Momentum expands third. Often, price returns to retest the area and prove acceptance. This sequence lowers risk and removes emotional pressure from execution.
Early entries are built on hope. Confirmed entries are built on evidence. Waiting does not make you late. It keeps you out of trades that were never ready to work.

EURUSD: Extended rally into daily supplyOver the past few weeks, EURUSD has continued to extend higher, pushing deep into a daily supply zone that overlaps with a previous distribution area. The ascending channel is still intact, but I’m starting to see some loss of momentum and the first signs of selling pressure within the 1.1780–1.1850 range.
On the daily chart, price has left a potential imbalance open, with a more interesting demand structure sitting between 1.1700 and 1.1650. If recent lows are taken out, I would expect price to rotate back into that zone to fill liquidity and test buyer strength. Only a clean break and hold above 1.1850 would invalidate the corrective scenario and reopen the path toward higher highs.
The COT data shows:
Non-commercials remain net long on the euro, but positioning is not increasing as aggressively as in previous months.
On the Dollar Index, non-commercials still hold a meaningful short exposure, but they’ve been gradually reducing it.
In my view, this suggests a market that may have already priced in much of the pro-euro bias, creating room for a short-term technical reset.
Seasonality
Historically, December tends to be positive for EURUSD, but the final part of the month often brings volatility and rebalancing flows — consistent with the idea of a pullback before any renewed extension.
Retail sentiment
Current sentiment shows roughly 81% of retail traders short.
Typically, that’s a contrarian bullish signal. However, given that we’re trading inside supply and the structure is stretched, I interpret it as the uptrend is still alive, but the risk of a corrective phase is increasing.
Invalidation
This corrective view is invalidated with daily closes above 1.1850 and strong continuation inside the channel.

The Beginner's Blueprint to Custom Trading Indicators
Your First AI‑Assisted Indicator Doesn't Need to Be Perfect - It Just Needs to Be Yours
In the AI era, you don't have to be "a coder" to build tools that actually match how you see the market.
You just need:
A clear idea
Basic Pine Script concepts
AI to help with the heavy lifting, while you fine tune/debug it.
This post is about turning that first idea into a real indicator on your chart.
---
Step 1: Start With One Sharp Idea, Not Ten Vague Ones
Instead of:
"I want an indicator that tells me when to buy and sell."
try:
"I want a trend filter that only shows long signals when price is above a 200‑MA and volatility is not extreme."
The sharper your idea, the easier it is for both you and AI to build something useful.
---
Step 2: Break the Idea Into Building Blocks
Most indicators combine a few simple components:
Trend (moving averages, higher highs/lows)
Momentum (RSI, rate of change)
Volatility (ATR, bands)
Volume (OBV, volume filters)
Your job is to decide:
Which components matter for your idea
How they should interact (AND, OR, weights)
Then you can tell AI exactly what to code instead of saying "make me something cool".
---
Step 3: Talk to AI Like a Developer, Not a Customer
When you ask AI for Pine code, be specific:
"Overlay indicator on price chart"
"Inputs for fastMA, slowMA, ATR length, ATR multiplier"
"Plot trend filter as a colored background"
"Create longCondition and shortCondition booleans"
You can even sketch the structure:
indicator("My Trend Filter", overlay = true)
// 1. Inputs
// 2. Calculations
// 3. Conditions
// 4. Plots
AI will happily fill in the gaps.
---
Step 4: Understand Before You Trust
AI can write the code, but you are still responsible for:
Reading each block and asking, "What does this do?"
Checking signals on different timeframes and markets
Confirming the indicator behaves like your original idea
Think of AI as an ultra‑fast junior dev. You’re still the lead.

Why Most Backtests Fail in Live MarketsBacktests often look convincing because they operate in a world that does not exist in live trading. Historical data is clean, fills are perfect, and execution is assumed to be instant. In reality, markets are driven by liquidity, friction, and uncertainty, none of which show up properly in hindsight testing.
The first failure point is liquidity. Backtests assume you can enter and exit at any price shown on the chart. Live markets do not work that way. At key levels, price accelerates, spreads widen, and partial fills occur. What looks like a precise entry in a backtest often becomes slippage or a missed fill in real time, especially during news, session opens, or liquidity sweeps.
The second issue is spread and fees. Many strategies survive on thin margins. A few ticks of spread expansion or commissions per trade are enough to flip a positive expectancy into a losing one. Backtests that ignore realistic costs create false confidence and encourage overtrading systems that cannot survive friction.
Execution timing is the third blind spot. In hindsight, confirmation is obvious. Live, confirmation unfolds candle by candle. Strategies that rely on exact closes, perfect retests, or instant reactions break down when hesitation, latency, or human execution enters the process.
To stress-test ideas realistically, remove precision. Add slippage assumptions, widen stops slightly, delay entries by one candle, and test during different market regimes. If a strategy only works under ideal conditions, it is not robust. Robust strategies survive imperfection.
Backtests are not useless, but they are incomplete. They should test logic, not profitability. Live viability comes from understanding how liquidity, cost, and execution pressure reshape every idea once real money is involved.

$MSTR #Strategy Inc.Looks like NASDAQ:MSTR is due a bounce probably in Q1. It's current Book/sh around $182. So P/B ratio is at 0.87 for a stock usually runs at a premium of 1.5x : 2.5x.
Having said that, and since the stock is trading below its book value because equity investors are panicking more than crypto ones, the stock is priced as if bitcoin is around 60k.
Short term target @ $182, while medium term could be around $270. Analysts still have a target of $486!
#AHMEDMESBAH #MSTR #Strategy

$NG Volatility Remains high in Natty Natty continues to be whippy, keeping volatility historically high.
Tastytrade IVR = 77.9 as of 12/25/25
Selling OTM 30 Delta puts have been paying off directionally .
However, the real gains will come when the Vol collapses.
With Natty at these levels , will be looking at IRON CONDORS 20 deltas and less on the wings.
Will also be keeping duration rather short , staying in Jan & Feb 26 expo’s …

USD/CAD at a Turning Point: Smart Money vs Retail CrowdTechnical Context (Macro View)
USD/CAD has completed a distribution phase following the rally of recent months and is now rotating decisively back into a broad daily demand area between 1.3650 and 1.3550, a zone that has historically generated strong directional reactions. Short-term structure remains bearish, but price is now trading within a potential absorption area, with RSI compressed in the lower range, consistent with bearish momentum exhaustion. From a structural standpoint, this is not an environment to chase extended shorts, but rather to monitor for technical long reactions from high-value support.
COT Report (Commitments of Traders)
USD Index: Non-Commercials are net short, accompanied by a significant contraction in overall open interest, signaling a loss of structural strength in the US dollar following the previous bullish excess.
Canadian Dollar (CAD): Non-Commercials are heavily net short CAD, while Commercials continue to absorb, a classic setup often preceding a potential inversion or corrective rebound in CAD.
Retail Sentiment
79% of retail traders are long USD/CAD, while only 21% are short. This highlights a strong retail exposure positioned against the recent bearish move. However, context is key: sentiment is already at extreme levels, but price is now sitting at an institutional support area, increasing the probability of a short squeeze or technical rebound rather than an immediate continuation of downside extension.
Seasonality
Historical seasonality for USD/CAD shows that late December to early January often favors consolidation phases or rebounds. Data over 5, 10, and 20 years indicate a bearish pressure that progressively loses strength, with frequent mean-reversion dynamics.
Seasonal Conclusion: current timing aligns with a potential rebound or pause in the bearish trend, rather than the start of a fresh downside acceleration.

Mastering MACDTurning a Popular Indicator Into a Structured Decision Tool
Many traders use MACD as a simple signal generator. They see a crossover, enter a trade, and later realise the result does not match the expectation. MACD becomes useful only when it is applied inside a clear framework built on trend, momentum, and timing. Its real value lies in reading shifts in participation rather than delivering standalone entry signals.
Understanding what the indicator represents is the first step. MACD measures the relationship between two moving averages and reveals how fast price is accelerating or slowing down. The histogram shows the rate of change. When used with intent, MACD helps you read the strength behind a move instead of trying to predict direction. Momentum confirms structure and brings clarity to the decision process.
Define the market environment before looking at MACD. Trending markets and ranging markets produce different behaviours. In a trend, a rising histogram often supports continuation and helps you judge whether a pullback is healthy or the start of a deeper rotation. In a range, the histogram moves around the zero line and highlights areas where momentum is fading. Without this context, MACD signals tend to mislead more than they help.
The next step is aligning MACD with the locations your system already relies on. Use it as part of the confluence, not as a trigger. When price reaches a higher-timeframe level, a liquidity area, or a clear structural pivot, the histogram can show whether momentum is shifting in your favour. You are not asking MACD to discover the trade. You are using it to confirm the logic you have prepared.
With structure and location in place, create specific decision rules for MACD behaviour. Examples include shrinking momentum when price approaches a level, expansion that supports a breakout, crossovers that match the higher-timeframe direction, or divergences that signal exhaustion at important zones. Every rule needs to serve a practical purpose. Reacting to every crossover removes discipline and weakens the system. Well-defined conditions make MACD a reliable filter.
Risk management remains outside the indicator. MACD does not define stops, invalidation, or how much to risk. Those rules come from structure. Stops should respect swing highs or lows, well-defined invalidation areas, or volatility-based distances. Combining this approach with MACD’s momentum read protects you from chasing trades that lack strength and reduces over-engagement during slow conditions.
Validation closes the loop. Backtest the exact behaviours you rely on, not the indicator as a whole. Study how histogram shifts behave at your chosen levels. Compare momentum against structure. Track how timing improves when MACD is used to refine execution instead of generate entries. When the data confirms the rules across different market conditions, the system gains stability.
MACD becomes a valuable asset when integrated into a disciplined process. On its own, it produces too much noise. Inside a structured system, it sharpens momentum reading, filters out weak trades, and builds cleaner execution. Traders who use MACD to support their framework instead of driving it achieve far greater consistency over time.

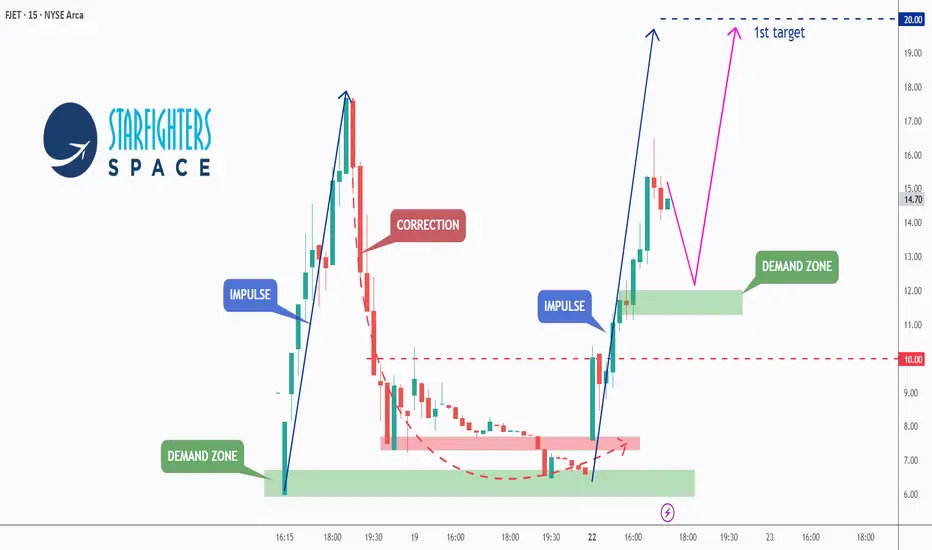
FJET - From Private Skies to Public Markets!!Most retail investors never had access to the biggest space winners.🌌
SpaceX went from a private valuation near $46B to over $800B without ever giving the public a chance to participate.
This time, the door is open❗️
Starfighters Space, Inc. AMEX:FJET has officially entered the public markets, giving everyday investors exposure to a real aerospace company… Not a concept, not a slide deck; but one already flying missions out of NASA’s Kennedy Space Center.
📊 Technical Analysis
Following its public debut, FJET delivered a strong impulsive move 📈, confirming aggressive buyer interest.
After a healthy correction into demand, buyers stepped in again, keeping the structure intact.
Price has now broken and held above the $10 area , confirming bullish continuation and validating the higher-timeframe structure.
🔁 From here, the expectation is a shallow pullback / consolidation , followed by continuation in line with the scenario marked in purple.
🏹 The $20 zone represents the first target , and upon reaching it, I will be watching for further upside , at which point I’ll post an updated outlook.
💡 Bigger Picture
This isn’t a speculative space idea, it’s an operating aerospace company 💼with rare credentials:
- World’s only commercial Mach 2-capable fleet of Lockheed F-104 Starfighters.
- Operating directly out of NASA’s Kennedy Space Center.
- Strategic validation from NASA, Lockheed Martin, GE, and the U.S. Air Force.🛩
- Pioneering a hypersonic air-launch platform designed to dramatically reduce the cost and timeline of microsatellite deployment.
- Successfully completed a $40M Regulation A+ raise , transitioning from private capital into the public markets.
Recent history shows that real aerospace IPOs tend to move early:
Voyager, Firefly, Karman, and AIRO all saw sharp post-listing expansions.
In this sector, the first phase after going public often matters the most.
📘 Bottom line
FJET offers something rare:
💎Early exposure to a credible aerospace company right after it entered the public markets, before full institutional positioning and before the story became widely crowded.
📡Whether you approach it as a technical setup, a newly public aerospace play, or a longer-term space infrastructure narrative, this is a name worth keeping on the radar.
⚠️ Always do your own research and speak with your financial advisor before investing.
📚 Stick to your trading plan, entry, risk management, and execution.
All strategies are good; if managed properly.
~ Richard Nasr
Disclaimer: I have been paid $800 by CDMG, funded by Starfighters Space, to disseminate this message.
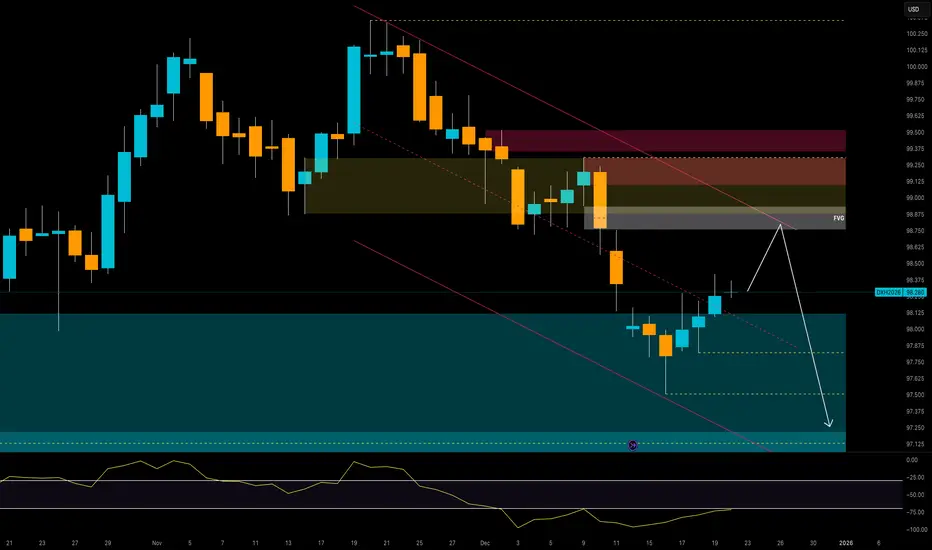
US Dollar Index – Temporary Relief Before Further Downside?The US Dollar Index continues to trade under structural pressure on the daily chart, following the strong downside impulse that broke November’s value area and pushed price into a key weekly demand zone around 97.90–97.30. After a clear momentum swing lower, the index is now showing early signs of corrective strength, but the broader context continues to favor weakness into year-end.
On the technical side, price has reacted from support and is attempting a corrective retracement toward the 98.75–99.00 supply zone. This zone aligns with:
– Daily bearish trendline resistance
– A fresh Fair Value Gap (FVG)
– Previous structure imbalance
If price completes this pullback, the zone provides a high-probability region for bearish continuation targeting new lows into 97.50–97.20. The RSI remains below the midline, indicating momentum has not fully shifted to the upside and that current strength is corrective, not impulsive.
Seasonality reinforces this bearish narrative. December historically records negative averages in the Dollar Index across virtually every timeframe. The 20-year average in particular shows strong downward pressure late in the month, with typical weakness accelerating into year-end. Current price action is consistent with this seasonal pattern.
From a positioning standpoint, the latest COT report shows Non-Commercial traders significantly net short, with shorts sitting at 28,652 vs. longs at 14,778. This imbalance continues to reflect confidence in downside continuation. At the same time, the Commercial category reduced long exposure and increased shorts, adding further weight to bearish bias. The aggregate positioning structure is clearly aligned with the existing downtrend.
Overall, the Dollar Index remains structurally bearish. A final upside correction into the 98.75–99.00 supply zone could precede the next leg lower. Only a clean break and close above 99.20 would weaken the bear case and signal a potential shift in directional bias. Until then, rallies remain sell-side opportunities.
Last Shot on #EURUSD 📌 Market Insight: {#EURUSD }
⚠️ Risk Assessment: {High}
🚀 Approach:
Not a Quality setup and its a NO NEWS DAY .
I don't wanna risk too much on these 2 days and just wanna chill .
EU couldn't be ok if and if we do have a MOMENTUM Structure ... just for QuickScalp
#Ash_TheTrader #Forex #GBPJPY #MarketAnalysis #TradingSetup #RiskManagement #GOLD #Scalper #NQ #EURUSD

GBP/USD Ready for a Year–End Breakout?Daily Technical Analysis
GBP/USD is currently trading around the 1.337 area, holding above a rising channel structure after breaking through the 1.322 demand zone at the start of December. Recent daily candles show slowing bullish momentum under a higher–timeframe supply zone extending toward 1.345–1.355 and potentially 1.360.
The technical outlook suggests a possible short–term pullback: a liquidity sweep below daily lows could bring price back toward the lower trendline and potentially into the 1.331–1.324 area before any continuation higher.
Bullish invalidation remains below 1.322.
The bullish continuation target remains 1.345, with potential extension toward 1.360 if momentum holds.
COT Positioning
Non–Commercials remain heavily short on the British Pound relative to longs (135,834 vs 60,319 contracts), indicating that most speculative positioning remains bearish on GBP. However, the latest weekly update shows a significant increase in long positions (+8,067) and a smaller increase in shorts (+3,402), suggesting a gradual sentiment shift with underlying bullish accumulation.
On the USD Index side, speculative positioning remains net short (28,652 short vs 14,778 long). Combined, this creates a medium–term directional bias supportive of GBP/USD upside: strengthening GBP + weakening Dollar Index is a potentially expansive backdrop.
Retail Sentiment
Retail sentiment currently shows 52% short and 48% long on GBP/USD. This is nearly neutral but slightly contrarian bullish, as the marginal majority of short positioning runs against the recent trend. Any pullback may encourage further retail short exposure, potentially setting up a bullish rotation afterwards.
Seasonality - December Bias
Seasonality confirms a historically bullish tendency in December:
– 20–year average: slightly positive
– 15–year average: positive
– 10–year average: slightly positive
– 5–year average: strongly positive
– 2–year average: strongly positive
This reinforces the potential for year–end upside continuation and supports a bullish narrative above 1.345 following any corrective pullback.
Trade Outlook
The base scenario remains a short–term pullback into key levels, followed by potential bullish continuation toward upper supply zones.
Short–term pullback zone: 1.331–1.324
Bullish continuation zone: 1.345–1.355
Primary extension target: 1.360
Conclusion
GBP/USD maintains a bullish daily structure. Despite heavy speculative short positioning, recent COT flows, positive seasonality, and balanced retail sentiment continue to support the idea of further upside into year–end. Technically, price is approaching a decision level below 1.345: I will be watching for a structured pullback before assessing the next bullish leg toward 1.360.
A break below 1.322 would invalidate the bullish structure and return price to a deeper accumulation phase.

GBPUSD - Relief Rally Into Resistance? Sellers Watching Closely📉GBPUSD remains overall bearish on the higher timeframe. Price is still trading within a descending structure, and the broader trend continues to favor sellers rather than buyers.
The recent upside move is best viewed as a corrective bounce, not a trend reversal. Price is now approaching a key confluence zone, where the former structure, horizontal resistance, and the descending trendline align.
This is the type of location where trend-following shorts become interesting. I’m not interested in selling blindly, but rather in waiting for lower-timeframe bearish confirmation once price reacts at this resistance zone.
⚔️As long as price remains below the descending trendline and fails to reclaim the range above, the bearish bias stays intact. A clean break and hold above this resistance would be the only thing that forces a reassessment.
For now, this looks like sellers getting another chance at a better price.
Will this resistance cap the move once again, or do bulls finally break the structure? 🤔
⚠️ Disclaimer: This is not financial advice. Always do your own research and manage risk properly.
📚 Stick to your trading plan regarding entries, risk, and management.
Good luck! 🍀
All Strategies Are Good; If Managed Properly!
~Richard Nasr

EUR/AUD: Is This Daily Rejection the Start of a Breakdown?1. COT Positioning
The latest COT data reflects a clear divergence between EUR and AUD positioning:
• EUR futures (Non-Commercial) continue to show strong net-long positioning, with +5,367 new long contracts added and the long/short ratio holding firm. This supports medium-term EUR strength.
• AUD futures (Non-Commercial) show an opposite movement, with +6,517 new short contracts added and a further reduction in speculative long exposure. This reinforces AUD weakness.
From a COT perspective, the gap between EUR strength and AUD weakness remains wide. This does not immediately justify a deeper EURAUD downside move unless commercial positioning begins to shift. However, extended net-long imbalances can sometimes precede corrective phases, meaning current EUR strength may be late-cycle rather than early-stage accumulation.
2. Seasonal Tendencies
December seasonality is notably skewed:
• The EUR historically performs well in December across all major lookback periods (20Y, 15Y, 10Y, 5Y, 2Y), creating a supportive seasonal tailwind.
• The AUD shows mixed to mildly positive seasonal behaviour at shorter timeframes, but lags the EUR significantly over the 10-year dataset.
Overall, seasonality favours EUR strength against AUD into year-end, adding a bullish seasonal bias to EURAUD.
3. Sentiment
Retail sentiment on EURAUD currently shows:
• 68% short
• 32% long
Such an imbalance typically acts as a contrarian bullish signal. As long as retail traders remain heavily short, upward pressure on EURAUD is likely to persist.
4. Daily Chart Structure
Price is currently rejecting a major daily supply zone after a sustained three-week upside rotation. The rejection aligns with key technical factors:
• descending trendline resistance
• previous distribution area
• RSI rejection from mid-range
Key levels:
• Daily supply: 1.7806 – 1.7921
• First downside target: 1.7558 demand
• Secondary liquidity zone: 1.7500 – 1.7440
The recent bearish move off supply suggests the start of a potential corrective phase. However, the higher timeframe structure remains bullish, and this decline may represent a pullback rather than a full structural reversal.
Macro factors (COT + seasonality + sentiment) lean bullish, which conflicts with the short-term downside impulse.
Short-term bias: Bearish corrective move toward 1.7558 demand
Medium-term bias: Bullish continuation unless 1.7440 breaks
The location is favourable for tactical shorts following the daily rejection, but aggressive management is required. Deep downside targets carry higher risk unless bearish momentum increases.
