Commodity Supercycles Don’t Start Where Most People LookOne thing I have learned over the years:
🥇Gold is usually first. (already done)
Not because the economy is booming, but because something feels off. Wars... Inflation... you name it. Gold reacts before the story is clear.
🥈Then silver starts waking up. (happening)
That’s usually when attention shifts from protection to opportunity. Silver doesn’t just follow gold, it magnifies it. It is cheaper and more convenient especially for those who missed gold's move!
🥉After that, the industrial metals come into play.
Copper, palladium, platinum. This is where the cycle starts to feel real. Demand is no longer theoretical. Growth shows up on the charts. (this feels just like altcoin season in crypto lol)
🛢Oil and gas tend to move later.
Not last by accident. By then, expansion is obvious and inflation pressures are already building.
🔄Most traders get this backwards.
They chase what’s already moving instead of asking why it’s moving.
The edge isn’t guessing the top or bottom.
It’s understanding what stage the market is in and positioning accordingly.
Honest question...⁉️
Are you reacting to what already moved… or paying attention to what’s just starting?
⚠️ Disclaimer: This is not financial advice. Always do your own research and manage risk properly.
📚 Stick to your trading plan regarding entries, risk, and management.
Good luck! 🍀
All Strategies Are Good; If Managed Properly!
~Richard Nasr
Supercycle

BTC: The 15-Year Prophecy (Hosoda Time & The Diagonal)There is a ghost in the machine.
For the last few months, amidst the noise of breakouts and new highs, a specific signal has been flashing a warning that defies the rules of a standard Bull Market. It is a "glitch" in the data—a silence where there should be noise.
Most are ignoring it. Some are confused by it. Today, we are going to try solving it.
Below is the full evolution of the Bitcoin setup, from the Daily traps to the Macro truth, revealing why the "Silence" is actually the loudest signal we have ever seen.
Part 1: The Micro Trap (1D Chart)
Zooming into the daily timeframe, the structure of the decline is textbook. We are currently navigating Wave (4), but the context provided by the previous move is critical.
The "Extended" Wave 3: The drop we just witnessed wasn't a standard correction; it was an impulsive sell-off where Wave 3 was extended. when the third wave extends, it confirming strong momentum in the direction of the trend. The bears are in control.
Current Status (Wave 4): We seem to be in the middle of a Wave (4) relief rally, potentially unfolding as an ABC correction.
Sub-waves 'a' and 'b' appear complete, with 'b' potentially establishing a local higher low.
What's Next: We are likely waiting for Wave 'c' to expand upwards to potentially complete the structure.
The Potential Resistance ($99k): If this structure holds, Wave 'c' might push towards the resistance confluence around $99,323. This area could serve as a ceiling for this corrective phase.
The Downside Risk ($79k): Traders should remain cautious. If Wave (4) finds resistance near $99k, the Elliott Wave guidelines suggest a Wave (5) decline could follow. If that scenario plays out, the market might target the major support zone near $79,000.
Part 2: The Time Anomaly (1W Chart)
While the daily chart showed us the immediate price action, the Weekly chart reveals the true scale of the move. As discussed in previous updates, we are navigating a large-scale Irregular Flat Correction, and we are currently at the tail end of Wave (1) of the 5-wave impulse that makes up the larger C-Wave.
So, the entire impulsive structure we just analyzed on the Daily chart? That was just the first leg of this Weekly move.
☁️ The Ichimoku Signal: Testing "Senkou Span B" Price action has now entered the Ichimoku Cloud (Kumo), a critical zone of turbulence.
The Level: you can see candles trading inside the cloud. We have already tested the bottom support, specifically the Leading Span B (Senkou Span B).
The Forecast: Hitting this level signals that Wave (1) is either ending or has already ended. However, the market rarely makes it easy. I am expecting a potential "False Breakout" below the Cloud to trigger panic, followed by a sharp reclamation. That fake-out would likely mark the bottom of Wave (1) and start of Wave (2).
⏳ The Time Anomaly: Why so fast? There is a strange disconnect in the "Time" dimension of this cycle compared to history (see picture).
2021 Cycle: In the previous bull run, the correction for Wave 1 typically took 70 days to cool the RSI down to 37.
Current Cycle: We have smashed down to an RSI of 35.8 in just 42 days.
The Question: Why is the market correcting nearly twice as fast as before? This "Time Compression" indicates the cycle is moving faster and more violently than we are used to.
The "BBWP Mystery" Finally, look at the BBWP (Volatility) in the below picture. This presents a genuine anomaly. Throughout this cycle, we have seen contractions many times, yet the spectrum never reached the extreme 90% expansion levels. Now, at the very end of the cycle, we are seeing another massive BBWP Contractions.
Why is this happening? Is it just noise, or is this contraction actually telling us the truth?
Part 4: The Truth (6-Month Macro Chart)
Why is the market moving so fast? And what is the "BBWP Signal" we mentioned Before? Look at the 6-Month Logarithmic Chart below.
The Big Picture: Elliott Wave Supercycle on 6M Log Scale
On the logarithmic chart, Bitcoin appears to be wrapping up a massive impulse wave that started from its early days:
Wave (I): Peaked around 2013 (~$1,200 high).
Wave (II): Bottomed in 2015 (~$200 low).
Wave (III): Explosive rally to the 2021 all-time high (~$69,000).
Wave (IV): The 2022 bear market low (~$15,500).
Wave (V): Ongoing since late 2022, but here's the twist—it's unfolding as an ending diagonal (wedge pattern with overlapping subwaves: 1-2-3-4-5).
2.Applying Hosoda Time Theory (Ichimoku Time Theory indicate potential future market turning point).
The vertical lines in the chart are not Fibonacci; they are Hosoda Numbers (9, 13, 17, 21...),
9: Marked the 2023 Bull Run start.
13: Exactly Marked the Jan 2025 Top as end of wave 3, which matches the irregular flat analysis on Weekly chart which states that Cycle top was on Jan 2025.
17 (±1): Matches our projection for the next major pivot—the end of wave IV and the start of the final Wave V run on Jul-2026 or Jan-2027.
The "Mystery": The BBWP Anomaly
BBWP is contracting sharply now on weekly chart—at what feels like the end of the cycle, not the start. This flips the script on historical behavior. Why? I tie it back to the higher-degree Elliott count: The ending diagonal's converging nature naturally squeezes volatility, compressing Bollinger Bands as momentum fades. Instead of signaling a fresh bull, this late-cycle contraction could be foreshadowing a reversal—think trend exhaustion rather than accumulation.
A Possible Explanation: If the macro structure is indeed an Ending Diagonal, then this volatility crunch (BBWP contractions) and the market correcting nearly twice as fast as before makes perfect sense. We would be squeezing into the apex of a 15-year wedge. The market might be running out of "oxygen".
The Verdict: With the 6-Month structure potentially squeezing into a corrective Wave IV, the weight of evidence suggests that the path of least resistance is down. Until the market touches the lower boundary of this diagonal (or invalidates the structure), the only logical macro view is bearish.

Is Friday May 1st 2026 is the Bottom of the Alt Market?Is History repeating itself?
Is 8 Month on Friday May 1. 2026 the next low in Alts?
Are we following the same setup as 2021?

Alts to make a move in Q1 2006The Altcoin market is still holding strong above the trendline.
Are we entering a supercycle? Your Thoughts?

BTC NEXT CYCLEFor BTC/USD, I have two plans for preparing for the next cycle. If the price is able to break through the FAIR VALUE GAP WEEKLY and turn it into an INVERSE FAIR VALUE GAP first, then it is highly likely that BTC/USD will enter a SUPER CYCLE. However, if the price breaks through the WEEKLY ORDER BLOCK first, BTC/USD will return to the 4-YEAR CYCLE. In this cycle, I will buy BTC/USD at the WEEKLY ORDER BLOCK or MONTHLY BALANCE PRICE RANGE. My TP target for both cycles is USD 229,780.00. However, I will partially take profit at 200,000.00 USD. I obtained this target from STANDARD DEVIATION - 4, which is the result of marking FIBBONACCI RETRACEMENT on the ATH cycle 2021 to SWING LOW cycle 2025. Why did I use this? because in the previous cycle, after BTC/USD touched around the STANDARD DEVIATION - 2 area, the price immediately dropped below and ended the cycle, so I use this as my reference for TP in this cycle. (DISCLAIMER ON)

Commodity Supercycle: Concept, Causes, and Global ImpactIntroduction
Commodities—such as oil, metals, agricultural products, and minerals—are the backbone of the global economy. They serve as essential inputs for industrial production, infrastructure development, and everyday consumption. However, unlike ordinary price fluctuations driven by short-term supply and demand changes, commodities sometimes experience prolonged periods of price booms and busts. These extended phases, often lasting decades, are known as commodity supercycles.
A commodity supercycle is a long-term trend during which prices of a wide range of commodities rise significantly above their long-term average, followed by a prolonged period of decline. These cycles are usually driven by massive structural shifts in the global economy—such as industrial revolutions, urbanization waves, technological breakthroughs, or geopolitical transformations—that create sustained demand for raw materials.
This essay explores the concept, historical examples, causes, consequences, and future outlook of commodity supercycles, highlighting their importance in shaping global economic trends.
1. Understanding the Concept of a Commodity Supercycle
A commodity supercycle is different from a normal business cycle or short-term commodity price movement. While a normal price cycle might last 2–8 years, a supercycle can extend for 20 to 40 years, characterized by long periods of rising and falling prices across multiple commodities.
In a typical supercycle:
The expansion phase witnesses strong global growth, industrialization, and urbanization, leading to increased demand for raw materials.
The peak phase occurs when demand and prices hit unsustainable highs.
The contraction phase begins when supply eventually catches up, and global economic growth slows.
The trough or bottom phase marks a prolonged period of low prices before the next upturn.
Supercycles involve broad-based commodity categories—such as energy (oil, gas, coal), metals (iron, copper, aluminum), and agricultural products (wheat, soybeans, corn). They are not limited to any single market but affect the entire global commodity complex.
2. Historical Commodity Supercycles
Economic historians have identified several commodity supercycles since the 19th century. Each was tied to a major transformation in industrial or technological development.
(a) The Industrial Revolution Supercycle (Late 19th Century)
The first recognized commodity supercycle occurred during the Industrial Revolution (1850s–1910s). Massive industrialization in Europe and the United States fueled unprecedented demand for coal, steel, iron, and agricultural goods. Urbanization and rail expansion intensified consumption, causing prices to rise across many commodities. However, as global production capacity expanded and industrial growth stabilized, prices eventually corrected.
(b) Post–World War II Supercycle (1940s–1970s)
The post-WWII reconstruction era marked another commodity boom. Rebuilding Europe and Japan required huge imports of oil, steel, and cement. The United States emerged as the dominant economic power, while infrastructure development surged worldwide. The 1950s and 1960s saw strong demand growth, but the 1970s oil crises and subsequent recessions ended the boom. By the late 1970s, high prices and energy shocks led to inflation, and the supercycle transitioned into a downturn.
(c) China-Led Supercycle (1998–2014)
The most significant modern supercycle began around the late 1990s, driven primarily by China’s rapid industrialization and urbanization. China’s entry into the World Trade Organization (WTO) in 2001 opened a new era of global trade and manufacturing. Massive infrastructure investment created immense demand for copper, iron ore, coal, and oil. Commodity exporters such as Brazil, Australia, and Russia benefited greatly.
By 2008, commodity prices had surged to record highs. Even after the global financial crisis, stimulus spending by China kept demand elevated until around 2014, when slowing Chinese growth and oversupply caused prices to collapse.
(d) Potential Green Energy Supercycle (2020s–2030s)
Many economists and analysts believe the world is currently at the beginning of a new commodity supercycle, this time driven by the global energy transition. The shift toward renewable energy, electric vehicles, and green technologies has increased demand for critical minerals such as lithium, cobalt, nickel, and copper. Simultaneously, supply constraints caused by underinvestment in mining and geopolitical tensions could sustain high prices in the years ahead.
3. Key Drivers of Commodity Supercycles
Commodity supercycles do not arise from random price surges. They are shaped by long-term macroeconomic and structural factors. The main drivers include:
(a) Industrialization and Urbanization
When countries undergo rapid industrialization, they require massive amounts of steel, cement, energy, and food to build infrastructure and support urban populations. Historical examples include the U.S. in the early 20th century and China in the early 21st century. Industrialization thus plays a central role in fueling supercycles.
(b) Technological and Structural Shifts
Major technological changes—such as the rise of automobiles, electrification, and digital industries—can increase the demand for specific commodities. For example, the current green energy revolution has boosted demand for battery metals and rare earth elements.
(c) Population Growth and Income Expansion
Rising populations and improving living standards in developing countries expand global consumption of food, energy, and consumer goods, increasing demand for base commodities.
(d) Supply Constraints and Resource Depletion
Unlike manufactured goods, commodities often face long lead times for production expansion. Opening new mines, oil wells, or farms takes years. When demand surges suddenly, supply cannot adjust immediately, pushing prices higher for extended periods.
(e) Global Monetary and Fiscal Policies
Periods of economic expansion often coincide with easy monetary policies, low interest rates, and high government spending—all of which can increase liquidity in commodity markets. Conversely, tighter monetary policies can end supercycles by reducing investment and consumption.
(f) Geopolitical Events
Wars, trade restrictions, sanctions, or political instability can disrupt supply chains and reduce production, contributing to higher prices. For instance, the Russia-Ukraine conflict in 2022 led to sharp increases in oil, gas, and grain prices.
4. Economic and Financial Implications of a Supercycle
Commodity supercycles have profound effects on the global economy, influencing everything from inflation to international relations.
(a) Impact on Commodity Exporters and Importers
Exporting nations (e.g., Australia, Brazil, Russia, Saudi Arabia) experience economic booms during commodity upswings, benefiting from higher revenues, employment, and foreign investment.
Importing nations (e.g., India, Japan, European countries) face inflationary pressures, higher production costs, and trade imbalances during the same periods.
(b) Inflation and Monetary Policy
Rising commodity prices contribute to cost-push inflation, prompting central banks to raise interest rates to stabilize prices. Conversely, when a supercycle ends and prices fall, deflationary pressures may emerge.
(c) Currency Movements
Commodity booms often strengthen the currencies of exporting countries, such as the Australian Dollar or Canadian Dollar, while weakening those of importers. This can alter global trade competitiveness.
(d) Investment and Speculation
Commodity supercycles attract speculative investment in commodity futures, mining stocks, and energy companies. During the 2000s, for example, institutional investors poured billions into commodity index funds, amplifying price trends.
(e) Environmental and Social Impacts
Sustained resource extraction can lead to deforestation, pollution, and social conflict in resource-rich regions. Balancing economic growth with environmental sustainability becomes a major policy challenge during a supercycle.
5. Indicators of an Emerging Supercycle
Economists monitor several indicators to identify potential supercycles:
Broad-based price increases across multiple commodities (not just one or two).
Structural demand shifts tied to technological or demographic changes.
Persistent supply bottlenecks due to underinvestment or geopolitical issues.
Rising capital expenditure in mining and energy sectors.
Global economic expansion led by industrial and infrastructure growth.
For example, from 2020 onward, prices of copper, lithium, nickel, and aluminum surged simultaneously—signaling early signs of a possible green-energy supercycle.
6. Challenges and Limitations
Despite their transformative impact, commodity supercycles are difficult to predict and manage.
(a) Volatility and Uncertainty
Commodity markets are extremely volatile. Unexpected events such as pandemics, wars, or policy shifts can reverse price trends abruptly.
(b) Overinvestment During Booms
High prices often encourage excessive investment in new capacity, leading to oversupply when demand slows—causing sharp downturns.
(c) Dependence on Global Growth
A supercycle depends heavily on sustained global economic growth. If major economies face recessions, commodity demand weakens rapidly.
(d) Environmental Transition Risks
While the green transition may drive a new supercycle, it also risks phasing out fossil fuels—potentially creating losses for countries and companies heavily invested in oil and coal.
7. The Future Outlook: Are We in a New Supercycle?
Analysts are divided on whether the world is entering a new commodity supercycle in the 2020s. Arguments for and against include:
In Favor:
Energy transition toward renewable technologies is boosting long-term demand for metals like copper, lithium, and nickel.
Underinvestment in mining and fossil fuel production over the past decade has constrained supply.
Geopolitical fragmentation is leading to supply chain disruptions and resource nationalism.
Fiscal stimulus and infrastructure spending in the U.S., India, and developing economies are supporting commodity demand.
Against:
Slowing global growth and technological efficiency may reduce long-term demand.
Recycling and circular economy models could limit raw material consumption.
Monetary tightening and higher interest rates could reduce speculative inflows.
Nevertheless, many experts believe the green transition and geopolitical realignments will sustain elevated commodity prices for the foreseeable future, marking the beginning of a structural uptrend akin to previous supercycles.
8. Conclusion
The concept of a commodity supercycle captures one of the most powerful long-term forces shaping global economic history. From the Industrial Revolution to China’s rise and the ongoing green energy transition, supercycles reflect humanity’s evolving relationship with natural resources.
Each supercycle brings both opportunities and challenges. For resource-rich nations, it offers economic prosperity and global influence. For import-dependent economies, it poses inflationary risks and policy dilemmas. Ultimately, the sustainability of future supercycles will depend on how effectively the world balances economic growth, resource management, and environmental responsibility.
As the 21st century progresses, the next commodity supercycle—driven by the energy transition, digitalization, and global reindustrialization—may redefine the global economy once again, just as its predecessors did in centuries past.
Grand Silver SupercycleI present the Grand Silver Supercycle. Silver has followed Elliott Wave Theory nicely through the years. The price hit a century low during The Great Depression, beginning what I believe to be the first wave of a supercycle. There is a clear five wave pattern up from this low, peaking in 1980. This is supercycle wave 1. Then, we see a five wave corrective pattern down, bottoming out in the early 90s. Alternatively, a three wave ABC pattern could be drawn. This is where supercycle wave 3 begins. Wave 3 is typically much more prominent than wave 1 in Elliott Wave Theory. For this reason, it makes sense that the next five wave pattern ending in 2011 is only the first subwave of supercycle wave 3. The second subwave corrected to the 2020 low, and we are currently on the third subwave. Within this subwave, we could either be starting a third wave (as shown in the chart) or still be on the corrective second wave. I believe the former is much more likely due to fundamentals.
Price targets within the current subwave were estimated as follows:
wave 3 length = 1.618 X wave 1
wave 3 target = $48
wave 4 length = 38.2% retracement of wave 3
wave 5 length = 1.618 X (wave 3 end - wave 1 start)
I'm more confident on wave 3 ending near $48 than I am of wave 5 ending near $95. There is strong resistance at $50, which coincides with the Elliott target zone. Wave 5 length can vary significantly. For silver at least, fifth waves have traditionally been long ones.
Fundamentals
Elliott Wave Theory is only a tool. It needs to be backed up by fundamentals when forecasting on long time frames. Silver is undervalued due to many years of supply outstripping demand, creating cheap prices. That is in the early stages of changing as now demand outpaces supply. Global silver demand was expected to hit an all time high of 1.21 billion ounces in 2022 (www.silverinstitute.org). This is largely due to increases in demand in both industry (Green Revolution) and personal investment (stackers hedging against inflation). Silver reserves currently stand at 530,000 metric tons (www.statista.com). The current demand is 38,000 metric tons per year. A simple calculation shows existing reserves could be depleted in 14 years. However, this calculation doesn't take into account new discoveries and recycling, which have so far kept pace with demand. Estimates of time to depletion of reserves vary wildly from a couple decades to a few centuries. At the moment, the prime driver of price (in addition to inflation) will be the deficit, not depletion of reserves.
Inflation is a totally different animal that is much harder to forecast long term due to its close relationship to government and Federal Reserve policy. It is more likely that when presented the choice, our leaders choose high inflation over debt default and depression. How this all is going to play out is anyone's guess. It seems for now our leaders are trying to kick the can down the road for as long as possible. If hyperinflation hits, the silver price will reach extraordinary heights.

ZEC Super Cycle - Good ContextA note:
It is not my norm to make posts like this, especially as long as it is. It's partially for my personal record, and also because I welcome discussion and other ideas for those who want to participate. This is highly speculative and as always do your own research.
Why Now?
ZEC (Z Cash) has existed since 2016, why is it just now gaining traction?
The privacy narrative is building strong within this market cycle, namely because it's becoming clearer and clearer that government entities have easy ways of tracking transactions on public ledger blockchains. Z-Cash is uniquely positioned in a way that appeals to long-time Bitcoin holders, and as privacy fears arise some have made a switch.
Usability, Zcash has made significant improvements to the utilization of it's privacy feature. Additionally, the fact that privacy is an optional form of transacting and not mandatory makes it more appealing, 85% of ZCash transactions done on the blockchain are via transparent transactions. New apps/wallet applications such as Zashi have also made it more appealing as they offer methods of off-ramping your zcash for direct spending.
A supply model that directly copies Bitcoin. (Well Almost)
Bitcoin Supply Limit: 21 Million
ZCash Supply Limit: 21 Million
Bitcoin Halving: Every 4 Years
Zcash Halving: Every 4 Years
Now here's some indepth differences in their supply model, and this is KEY to understanding why Zcash is going to go turbulent.
Something to understand first:
Bitcoin Block Time: 10 Minutes
ZCash Block Time: 75 Seconds
1 BTC Block = 8 ZEC Blocks for equivalent Supply Release
When Zcash First Launched in 2016 they released 12.5 ZEC per block mined, this was double the amount of new supply released that BTC First started with. Zcash corrected this with something called the 'Blossom' network upgrade in 2019, then it had another halvening in 2020, and most recently a third in 2024.
3 Halvings in 8 years.
Currently, ZEC emissions match that of Bitcoin's in 2016 (12.5 BTC per 10 min/12.5 ZEC per 10 min)
There's still one catch, 20% of the block rewards do NOT go to miners. Currently:
8% goes to the 'Electric Coin Company' - basically, focused on growth and partnerships involving Zcash.
7% goes to the 'Zcash Community Grants' used to fund development tools/infrastructure as well as marketing and community growth. There's been proof of this as new wallet/apps and options for zcash have become apparent in the last few years.
5% to the Zcash Foundation - nonprofit aimed at privacy research and maintaining zcash's node software.
The Technicals?
There is no solid reliable ZEC/BTC chart available, by reliable I mean with consistent volume. So I've created my own by pairing the ZEC/USD Kraken pairing to BTC/USD coinbase pairing, and I created a VWAP point from the beginning. In terms of BTC price alone, ZEC will hit just over 0.01 BTC, chart for reference (Logarithmic):
In terms of elliot wave theory, I'm already seeing extensions building into other wave extensions. Still in the midst of wave 3, and nowhere near it's end most likely.
I have 2 things to leave you with.
Even if you're super skeptical, if you don't have a lotta money in general and have a distaste for crypto/bitcoin in genreal, just get 1 ZCash, just 1.
Secondly, I strongly urge you to go on X (Formerly twitter) and lookup latest posts by CRYPTOCAP:ZEC , filter through the spam and see community talk/interactions just in the last hour, you will likely be surprised.
Just.
Get.
One.
Commodity Supercycles and Resource ScarcityIntroduction
Commodities—ranging from energy and metals to agricultural products—are the essential building blocks of the global economy. Their prices fluctuate based on demand and supply dynamics, technological progress, and macroeconomic cycles. However, history reveals that commodity markets often experience prolonged periods of rising and falling prices known as “commodity supercycles.” These cycles, typically lasting decades, reflect fundamental transformations in the world economy—industrial revolutions, rapid urbanization, or structural shifts in demand.
In recent decades, economists and investors have increasingly linked commodity supercycles to resource scarcity, the growing challenge of balancing finite natural resources with the expanding needs of humanity. As population growth, industrialization, and the transition to green technologies intensify, questions about the sustainability of resource use have become central to global economic planning.
This essay explores the concept of commodity supercycles, their historical patterns, causes, and implications, as well as the relationship between these cycles and resource scarcity. It also examines how emerging trends such as renewable energy, recycling technologies, and geopolitical tensions are shaping the next possible supercycle.
Understanding Commodity Supercycles
A commodity supercycle refers to a long-term, broad-based price boom across multiple commodities, driven by structural shifts in global demand. Unlike short-term price fluctuations due to seasonal or cyclical economic activity, supercycles typically last 20 to 40 years. They are usually tied to periods of rapid industrialization or technological transformation that cause sustained increases in commodity consumption.
For example, the post-World War II reconstruction era, the 1970s oil shocks, and the China-led industrialization of the 2000s each corresponded with major supercycles. These booms were followed by extended downturns as supply caught up with demand or economic growth slowed.
Economists identify three key phases of a commodity supercycle:
Expansion Phase – Rising demand, limited supply, and increasing investment in resource extraction.
Peak and Plateau Phase – Supply gradually expands, demand growth stabilizes, and prices reach their highest levels.
Contraction Phase – Oversupply, slowing demand, and technological changes drive prices down over a long period.
Each phase reflects deep economic transformations that go beyond traditional business cycles, often linked to the rise and fall of global powers, demographic shifts, and major infrastructure booms.
Historical Overview of Commodity Supercycles
1. The 19th Century Industrial Revolution Cycle (1850–1914)
The first recognized supercycle was driven by the Industrial Revolution in Europe and North America. Rapid urbanization, rail expansion, and mechanized manufacturing led to soaring demand for coal, iron, steel, and agricultural commodities.
Technological innovation in steam engines, metallurgy, and transportation created a massive pull on global resources. Colonization expanded access to raw materials, but prices still rose sharply due to unprecedented demand. This cycle ended with the onset of World War I and the Great Depression, which collapsed trade and industrial output.
2. The Post-World War II Boom (1945–1973)
The second major supercycle followed World War II, driven by reconstruction in Europe and Japan, the rise of suburbanization, and the U.S. economic boom. Infrastructure projects, automobiles, and consumer goods required steel, copper, oil, and agricultural commodities. The Bretton Woods system, which stabilized exchange rates, and the establishment of multilateral trade institutions like the IMF and World Bank, supported global growth.
The cycle peaked with the 1973 oil crisis, when OPEC’s embargo sent oil prices skyrocketing, causing inflationary pressures and economic slowdown.
3. The China-Driven Supercycle (2000–2014)
The most recent supercycle was fueled by China’s industrialization and urbanization after joining the World Trade Organization (WTO) in 2001. Massive infrastructure spending, steel production, and construction caused an extraordinary demand surge for iron ore, copper, aluminum, coal, and oil.
Prices of most commodities reached historic highs between 2008 and 2011. However, by 2014, a slowdown in China’s growth and global oversupply brought the cycle to an end. The collapse in oil and metal prices marked the beginning of a prolonged downturn.
Causes of Commodity Supercycles
Several structural forces interact to create supercycles. The most significant include:
1. Industrialization and Urbanization
Periods of intense industrial expansion, such as in 19th-century Britain or 21st-century China, lead to sharp increases in commodity demand. Infrastructure development, housing, and manufacturing all require raw materials, creating upward pressure on prices.
2. Demographic Growth
Population booms in emerging economies increase demand for food, energy, and housing. For example, post-war baby booms and the rise of the global middle class have repeatedly expanded resource consumption.
3. Technological Innovation
Technological revolutions both create and destroy demand for commodities. The internal combustion engine increased oil demand; renewable technologies now increase demand for lithium, nickel, and copper. These transitions often reconfigure global trade flows.
4. Supply Constraints
Commodity supply is slow to adjust due to long investment cycles, geological limitations, and political instability. For instance, developing a new copper mine can take over a decade. Limited supply elasticity amplifies the impact of demand shocks.
5. Geopolitical and Policy Factors
Wars, trade restrictions, or resource nationalism can tighten supply and intensify price cycles. The 1970s oil crisis and recent Russia-Ukraine conflict illustrate how geopolitics can trigger commodity surges.
Resource Scarcity: A Growing Challenge
Resource scarcity refers to the limited availability of natural resources relative to human demand. This scarcity is not only physical but also economic—driven by rising extraction costs, environmental degradation, and geopolitical constraints.
1. Physical and Geological Limits
Many commodities, especially fossil fuels and certain metals, exist in finite quantities. As high-quality reserves are depleted, extraction becomes more expensive and energy-intensive. For example, new oil discoveries have declined steadily since the 1980s, raising concerns about “peak oil.”
2. Environmental Constraints
Mining, deforestation, and fossil fuel extraction cause environmental damage and carbon emissions. Climate change policies now restrict resource exploitation, creating a trade-off between economic growth and sustainability.
3. Economic and Political Constraints
Resource access is often limited by political instability, nationalization of assets, and export controls. Countries with critical resources may use them for strategic leverage, increasing global scarcity risk.
4. Water and Food Scarcity
Beyond metals and energy, water and arable land are becoming increasingly scarce. Global warming, desertification, and pollution threaten agricultural productivity, leading to food security challenges and potential social unrest.
The Link Between Supercycles and Resource Scarcity
Supercycles often exacerbate resource scarcity. During expansion phases, intense demand leads to rapid depletion of reserves, environmental damage, and overexploitation. As production costs rise, prices increase, creating feedback loops that sustain the cycle.
Conversely, resource scarcity can trigger new supercycles by increasing extraction costs and limiting supply. For example, the transition to renewable energy requires massive amounts of critical minerals like lithium, cobalt, and rare earth elements—resources that are themselves scarce and geographically concentrated.
This dynamic interplay means that resource scarcity is both a driver and a consequence of commodity supercycles. As one resource becomes scarce, economies adapt by shifting demand to substitutes—sometimes triggering new cycles in different commodities.
Case Studies: Resource Scarcity in Action
1. Oil and Energy Scarcity
Oil remains the world’s most important commodity. Periods of high prices, such as during the 1970s and 2000s, reflected both demand surges and fears of resource exhaustion. While technological innovations like fracking temporarily alleviated scarcity, geopolitical risks and environmental constraints continue to threaten long-term supply stability.
2. The Green Energy Transition and Critical Minerals
The global push toward decarbonization has created massive demand for metals such as lithium, nickel, cobalt, and copper. Electric vehicles (EVs), solar panels, and batteries rely on these inputs. However, these minerals are heavily concentrated in a few countries—such as the Democratic Republic of Congo (cobalt) and Chile (lithium)—raising concerns over future bottlenecks and new forms of resource dependency.
3. Water Scarcity and Agricultural Commodities
Climate change-induced droughts are reducing freshwater availability for irrigation. In regions like South Asia and Africa, this threatens food production and could trigger volatility in agricultural commodity markets such as wheat, rice, and soybeans. As populations grow, the risk of food inflation and social instability rises.
The Emerging 21st-Century Supercycle
Many analysts believe the world may be entering a new commodity supercycle, driven by structural transformations such as green industrialization, digital infrastructure, and geopolitical realignments.
Key Drivers:
Energy Transition – The shift from fossil fuels to renewables increases demand for transition metals and critical minerals.
Geopolitical Fragmentation – Resource nationalism, trade wars, and sanctions are disrupting supply chains, raising production costs.
Reindustrialization in the West – Efforts to “reshore” supply chains and reduce dependency on China are spurring domestic infrastructure investment.
Global Population and Urban Growth – With the world population surpassing 8 billion, resource demand for housing, energy, and food remains robust.
However, this new supercycle differs from past ones—it is shaped by sustainability imperatives, technological advances, and decarbonization policies. While demand for green metals is booming, fossil fuel demand may plateau or decline, making this supercycle more selective and diversified.
Economic and Market Implications
1. Inflationary Pressures
Sustained commodity price increases can fuel inflation, especially in emerging economies reliant on imports. The 2021–2023 period illustrated how energy and food shortages contributed to global inflation spikes.
2. Investment Opportunities
Supercycles create profitable opportunities in mining, energy, and infrastructure sectors. Investors anticipate long-term demand by financing exploration and extraction. However, volatility remains high, requiring risk management strategies.
3. Shifts in Global Power
Resource-rich nations—such as Australia, Chile, and Saudi Arabia—gain geopolitical leverage during supercycles. Conversely, resource-dependent importers face economic vulnerability and trade deficits.
4. Technological Innovation
Scarcity stimulates innovation. Rising commodity prices encourage investment in recycling, substitution, and efficiency technologies. For example, advances in battery chemistry aim to reduce reliance on cobalt.
Managing Resource Scarcity: Sustainable Pathways
To mitigate the risks of resource scarcity and stabilize future supercycles, policymakers and industries must pursue sustainable resource management strategies.
1. Circular Economy
Recycling and reusing materials can reduce pressure on primary extraction. The shift toward a circular economy—where waste becomes input—offers a long-term solution to resource depletion.
2. Technological Substitution
Innovation can replace scarce materials with more abundant ones. For instance, sodium-based batteries may reduce dependence on lithium, and carbon composites may replace steel in some applications.
3. Diversification of Supply
Developing multiple sources for critical materials reduces geopolitical dependency. Collaborative international frameworks can ensure more equitable resource distribution.
4. Resource Efficiency
Improving energy and material efficiency across industries can lower demand growth. Smart grids, energy-efficient buildings, and sustainable farming techniques play key roles.
5. Global Governance and Cooperation
International institutions must coordinate policies for resource management, ensuring fair trade, transparent supply chains, and environmental protection. Initiatives like the Extractive Industries Transparency Initiative (EITI) promote responsible mining and investment.
Conclusion
Commodity supercycles are more than economic phenomena—they are reflections of humanity’s evolving relationship with the planet’s resources. Each cycle marks a phase of industrial transformation, technological progress, and social change. Yet, they also expose the vulnerabilities of a world dependent on finite natural assets.
As we enter a new era defined by climate imperatives, energy transitions, and population growth, resource scarcity is likely to be the defining economic and political challenge of the 21st century. Whether this results in instability or innovation depends on how effectively societies manage the delicate balance between consumption and conservation.
Future supercycles may not be characterized by endless extraction, but by smart utilization, circular economies, and technological breakthroughs. In this sense, the path ahead requires not only economic foresight but also environmental responsibility—because managing resource scarcity wisely will determine the sustainability of global growth itself.
Why its bullishGrayscale's GBTC outflows, often perceived as selling, are actually bullish for Bitcoin's market cycle. These outflows reflect investors redeeming shares from a high-fee trust (GBTC) and rotating into lower-cost ETFs like BlackRock's IBIT, which has absorbed massive inflows (e.g., ~$900M on October 8, 2025). This shift represents smart money reallocating capital efficiently, not abandoning Bitcoin. Meanwhile, strong institutional buying—BlackRock holding 770K BTC and whales accumulating at dips—signals confidence in future price appreciation. Historically, such rotations have preceded rallies, as seen post-ETF launch in 2024 when Bitcoin surged ~150%. This dynamic suggests a healthy market, not a top, with capital flowing to stronger hands.
Say it back $DOGE
Dogecoin, the pioneer of the super memecoin cycle, is entering its parabolic phase.

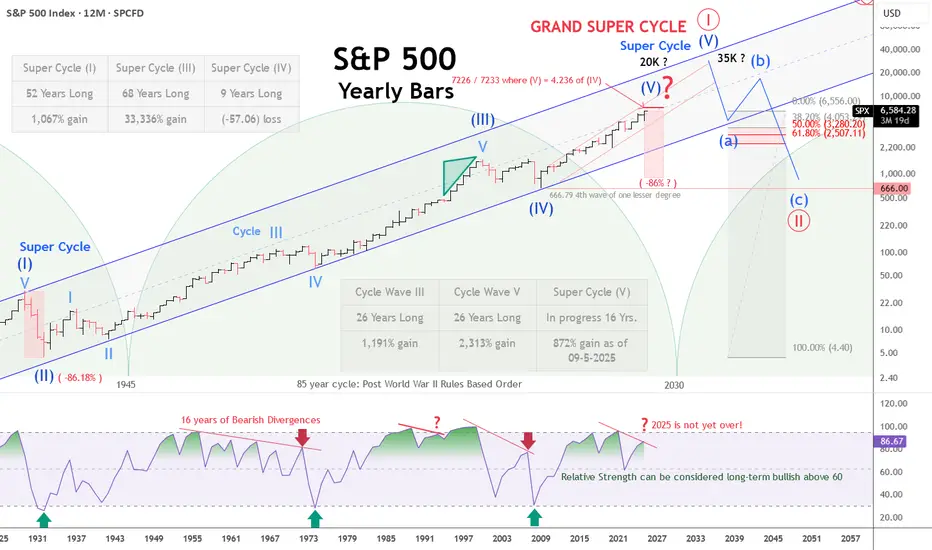
Crack-Up BOOM and BUSTHey everyone, Wave-Tech here. Join me on a historic journey as I reconstruct the Grand Super Cycle while diving into the historic and captivating world of Elliott Wave Theory!
This was to have been my maiden video cast—it didn't turn out as well as I hoped. Time got away from me, and the video ended abruptly before I could finish.
Rather than redoing it, I decided to keep the first and most authentic take intact for better or worse.
I made it private so that I could review it before publishing; however, I let too much time pass and was unable to change the setting back to public from private .
You can view the private video HERE :
The accompanying text is beneath the chart below:
In the simplest terms, Elliott Wave Theory is a measure of market psychology and sentiment coupled with Fibonnaci ratios designed to create a structural framework for determining at what stage of advance or decline a given market is in.
The basic premise for inherent advance and progress is three steps forward (impulse waves 1, 3, and 5) and two steps back (corrective waves 2 and 4).
According to Elliott, there are 9 degrees of trend, all of which are fractal in nature. The largest is the Grand Super Cycle, and the smallest is the Sub-Minuette.
Today, we’re exploring a yearly bar chart of the S&P, which covers trends at the Super Cycle and Cycle degree, revealing the pending culmination of a Grand Super Cycle—a colossal trend spanning centuries.
Buckle up as we unravel the rhythms of the stock market's epic ride!
The SUPER CYCLE:
Let’s start with the big picture: five waves of advance at the Super Cycle degree.
According to Ralph Nelson Elliott, with the sole exception of the GRAND SUPER CYCLE, the Super Cycle is the largest of all trends, a monumental set of impulsive and corrective waves that will set the tone and punctuate Grand Super Cycle terminals for Centuries to come—or at least through the fall of Empires or Civilizations.
Each of these waves tells a story of growth, correction, and renewal. The current Grand Super Cycle has been shaping markets and Nations for over a century. We can see this Grand Super Cycle unfolding in waves of Super Cycle dimension.
WAVE COUNTS:
The chart highlights five waves at Super Cycle degree: the first lasted 52 years with a gain of more than 1000%, the third stretched 68 years with a staggering 33,336% gain, and the fourth, a shorter 9-year span, saw a -57.06% loss, which marked the GFC low in 2009.
We are currently in the fifth Super Cycle wave, which is still unfolding and could mark the end of this Grand Super Cycle at any moment.
In contrast, the post-GFC "everything bubble" Crack-Up BOOM can persist to the upper trend channel boundaries noted near 18k and 35k.
Zooming in, we encounter the fractal Cycle degree waves comprising Super Cycle (III). Take Cycle Wave III and Cycle V, both 26 years long, delivering gains of 1,191% and 2,313% respectively.
And from the Super Cycle wave (IV) low in 2009, we are 16 years into Super Cycle Wave V, with an impressive 872% gain as of September 5, 2025.
This current wave could easily extend further, but its length is sufficient to suggest we may be nearing a pivotal turning point that might end the Grand Super Cycle with a sufficient black swan trigger.
The Fourth Turning:
Now, let’s touch briefly on the 85-year cycle, a rhythm that syncs beautifully with the concept of the "fourth turning"—a period of crisis and transformation.
The last one kicked off in 1945, post-World War II, ushering in the rules-based order that America and the West thrived in—an order that is arguably destined to end by 2030 if it hasn't already. This turning cycle hints at a historic shift on the horizon, or one that is currently already underway.
THE RSI:
Glance at the lower pane of the chart, where the Relative Strength Index (RSI) reveals a tale of caution. Since 1955, we’ve endured 16 long years of multiple bearish divergences—times when the market’s price and momentum didn’t align, signaling trouble ahead.
I like to call this the bearish divergences that cried wolf for nearly a generation! Note that it wasn't until the RSI closed beneath the mid-line that the sell-off into the 1974 low registered an oversold reading.
We saw the RSI fail again upon the new highs in 1993-94 following the highs in 1987.
1995 kicked off the infamous five years of irrational exuberance, which led to the tech bubble peak and subsequent crash into the 2002 low.
Not to be outdone by the 2000 blow-off top, the 2002 low ushered in yet another five years of irrational exuberance, culminating right in time for the 2008 Global Financial Crisis. This time, the RSI finally got it right on the first go round.
Currently, against the highs printed in 2021, the V-shaped snap-back rally following the mini bear market of 2022, the move to new highs in 2024 has flagged a bona fide bearish divergence. It will be interesting to see how the RSI looks after the close of 2025.
These divergences are like red flags, whispering that the party might not last forever, even though it may.
Price Targets:
So, where might this Super Cycle Wave V take us in terms of price? Let’s apply a Fibonacci projection—specifically, where Wave V equals 4.236 of Wave IV.
Doing the math, from the Wave IV base at 666.79, we’re looking at a target of around 7,226-7,233 on the S&P 500.
That’s only about 10% upside from recent highs—not quite the blow-off top of 18K or 35K, but a target to approach with eyes wide open.
Now, let’s consider a sobering scenario:
If Super Cycle Wave V ends here, or north of 7K, signaling the close of Grand Super Cycle ONE, history might repeat itself with a bear market akin to 1929’s four-year plunge.
An 86% decline could drop the S&P to around 917—still well above the Wave IV low of 666.79, another common target, but a stark reminder of the cycles’ power.
In Closing:
Thank you all for listening and reading if you've gotten this far. This was my first video. I got blindsided and cut off by the time constraint, so I apologize for the abrupt ending.
The market’s cycles and waves are a dance of numbers and human spirit, and we’ve only scratched the surface of their grandeur and implications.
Stay curious, stay informed, and keep your life vests on while riding these waves, okay!
#SUPER/USDT The End of Pullback ?#SUPER
The price is moving within a descending channel on the 1-hour frame, adhering well to it, and is heading for a strong breakout and retest.
We have a bearish trend on the RSI indicator that is about to be broken and retested, which supports the upward breakout.
There is a major support area in green at 0.5800, which represents a strong support point.
For inquiries, please leave a comment.
We are in a consolidation trend above the 100 moving average.
Entry price: 0.5930
First target: 0.6035
Second target: 0.6123
Third target: 0.6257
Don't forget a simple matter: capital management.
When you reach the first target, save some money and then change your stop-loss order to an entry order.
For inquiries, please leave a comment.
Thank you.

SUPER/USDT – Ready for a Massive Rebound or a Sharp Breakdown?Market Overview
SUPER is currently trading around 0.6025 USDT, sitting right above the 0.42–0.62 historical demand zone (yellow box). This area has acted as both accumulation and distribution since 2021 — a key battleground where long-term buyers and sellers fight for dominance.
---
Weekly Structure
Major Support: The 0.42–0.62 zone is a multi-year demand zone. Price has tested it multiple times without a confirmed breakdown, signaling strong buyer defense.
Layered Resistances: If buyers hold the line, the next hurdles are 0.9004 → 1.5754 → 2.1851 → 2.6703 → 3.2979 → 4.77 (ATH).
Range-Bound Market: Since early 2024, price action has been sideways, suggesting accumulation or distribution in progress.
---
Price Action & Patterns
Lower Highs: Sellers remain in control in the short-to-mid term.
Demand Zone Rejection: Buyers continue to defend the yellow box, keeping this zone highly relevant.
Liquidity Sweep Potential: A false breakdown below 0.42 followed by a strong rebound could be the catalyst for a bullish reversal.
---
Possible Scenarios
Bullish Case (Rebound & Breakout)
Confirmation: Weekly close above 0.9004.
Targets:
T1 = 0.9004 (+49% from current price).
T2 = 1.5754 (+161%).
T3 = 2.1851 → 2.6703 → 3.2979 (extended targets).
Narrative: If buyers defend the demand zone and break 0.90, SUPER may enter a markup phase, potentially triggering FOMO-driven rallies.
Bearish Case (Breakdown & Capitulation)
Confirmation: Weekly close below 0.42.
Targets:
T1 = 0.25 (psychological support).
T2 = 0.07 (all-time low).
Narrative: A breakdown of this demand zone would signal buyer exhaustion. Sellers could then push price into deeper liquidity zones.
---
Trading Strategy & Risk Management
1. Aggressive Traders
Consider entries within 0.42–0.62 with tight stops below 0.42.
Conservative target: 0.90 (Risk/Reward ≈ 1:1.5).
2. Conservative Traders
Wait for a confirmed breakout above 0.90.
Entry on retest of 0.90 → Target 1.57 (Risk/Reward >1:4).
3. Risk Notes
Never go full size at support without confirmation.
Limit risk per trade to 1–2% of portfolio.
Watch volume and weekly close for confirmation.
---
Conclusion
SUPER is at a make-or-break level. As long as 0.42–0.62 holds, the potential for a +100% move toward 1.57 remains strong. But if this zone fails, a deeper drop to 0.25 or even 0.07 becomes possible.
Key takeaway: Weekly close above 0.90 = bullish phase. Weekly close below 0.42 = bearish phase.
---
Price is consolidating at the 0.42–0.62 demand zone.
Bullish: Hold & break 0.90 → targets 1.57+.
Bearish: Breakdown <0.42 → targets 0.25 → 0.07.
This zone = “do or die” for SUPER.
---
#SUPER #SUPERUSDT #Crypto #Altcoin #TechnicalAnalysis #PriceAction #SupportResistance #BullishScenario #BearishScenario #SwingTrading

#SUPER/USDT#SUPER
The price is moving in a descending channel on the 1-hour frame and is adhering to it well and is heading to break it strongly upwards and retest it
We have a bounce from the lower limit of the descending channel, this support is at a price of 0.7300
We have a downtrend on the RSI indicator that is about to break and retest, which supports the rise
We have a trend to stabilize above the moving average 100
Entry price 0.7624
First target 0.7835
Second target 0.8057
Third target 0.8280

SUPERUSDT 1WSUPER ~ 1W Analysis
#SUPER Buy gradually from here if you still have a Conviction on this coin with a short -term target of at least 20%+.

BTC, Fibs, Market Psychology, and You: A Primer The Setup
I've identified a compelling technical setup that suggests BTC could be heading toward the $9,000-$9,850 range. This isn't just another bearish call - it's based on a rare convergence of multiple technical factors that I've rarely seen align so perfectly in my 18 years of trading markets.
Technical Confluence Zone
What makes this setup particularly compelling is the convergence of multiple independent technical factors around the same price zone:
1. Unfilled CME Gap : The Bitcoin futures chart shows a persistent unfilled gap from 2020 between $9,655 and $9,850. This gap has survived multiple market cycles without being filled, making it increasingly significant.
2. Key Fibonacci Level : The 0.382 Fibonacci retracement level sits at $9,024.11, remarkably close to the lower bound of the CME gap when accounting for the typical futures premium over spot.
3. Elliott Wave Structure : The current price action suggests we're in Wave 4 of a larger Elliott Wave pattern. Wave 4 corrections often retrace to previous Wave 1 territory, which aligns with this target zone.
4. Fibonacci Time Cycles : The time component is equally important - Fibonacci time extensions suggest we're approaching a potential inflection point in the current cycle.
Market Context Supports the Technical Picture
The technical setup doesn't exist in a vacuum. Several market conditions increase the probability of this scenario playing out:
1. Market Saturation : The crypto ecosystem has expanded dramatically, with thousands of tokens diluting liquidity that was once concentrated in major cryptocurrencies.
2. Retail Exhaustion : Retail investors who entered during previous hype cycles feel unrewarded despite price recoveries, leading to diminished enthusiasm and buying pressure.
3. Institutional Distribution: Wall Street and institutions have made their presence known, which historically signals they've distributed their high-priced holdings to retail while preparing short positions.
4. Concentrated Leverage Risk : MicroStrategy's position of 499,500 BTC at a $66,000 average purchase price, funded almost entirely by massive debt issuance, creates a significant systemic vulnerability. A move toward our target zone would put extreme pressure on their balance sheet.
Broader Market Context
This analysis also coincides with what looks to be a tired stock market following the 2024 US presidential election. With Donald Trump winning his second term, we have seen significant policy shifts that are actively impacting both traditional and crypto markets. Historically, markets often experience increased volatility during transitions of power, and the confluence of this political shift with our technical setup creates an even more compelling case for caution.
Additionally, price precedes news. The news is created on price. If you're hearing about an event, the trade has already been made. There is too much talk of unprecedented institutional participation. This is another sign that retail is being distributed to for the next meltdown. Bags were already offloaded. It's time to drop the anchor.
Historical Perspective
Having traded through multiple market cycles since 2007 I've seen this pattern before. Large players often target overleveraged positions to acquire assets at distressed prices. Michael Saylor experienced a leveraged meltdown once before during the dot-com crash - history doesn't repeat, but it often rhymes. Saylor is a designated whipping boy. A patsy. He will be rewarded well for his participation in fleecing you, so don't worry about what kind of skin he has in the game.
With that said, I believe an undetermined Black Swan event will be necessary to complete the rug pull. What that is, I cannot know.
Trading Implications
This analysis suggests several potential trading strategies:
1. Risk Management : Reduce exposure to Bitcoin and high-beta altcoins until this technical target is reached or invalidated.
2. Opportunity Preparation : Build dry powder positions to capitalize on what could be an exceptional buying opportunity if BTC reaches the $9,000-$9,850 zone.
3. Watch for Triggers : Monitor for breakdowns below key support levels that could accelerate the move toward our target zone.
4. Time-Based Entries : Use the Fibonacci time cycle extensions to refine entry timing if the price approaches our target zone.
Conclusion
While Bitcoin's long-term prospects remain strong, the confluence of technical factors pointing to the $9,000-$9,850 range suggests a significant correction may occur before the next sustained bull run. The catalysts to reach what should be a $250k range this cycle simply do not exist, and with waning macroeconomic strength, the odds of this cycle being anything other than a massive bulltrap are low. This setup represents one of the strongest technical cases I've seen. I also don't care to share my ideas often, but with everyone expecting a typical crypto market cycle, I feel compelled to offer my take on a public forum--for whatever it may be worth.
I am not shorting this market. I have removed my capital and taken an observant position. While I feel strongly about my idea--Clown World has fully taken hold and I don't dare test its resolve to break me.
Remember that no analysis is guaranteed - always manage risk accordingly and be prepared to adapt as the market evolves.
*Disclaimer: This analysis represents my personal view of the markets based on technical analysis and market observations. It should not be considered financial advice. Always do your own research and trade responsibly.*

Are we building a possible Super-Cycle & leave the 4-year cycleChart shows comparison to the last two cycles which have been scaled to match this cycle.
With all the differences this cycle has offered, the early run before the halving, the long drawn out mini bear market retracements, but yet all the bullish news for Bitcoin and Crypto from here on out in the U.S.A, might we not experience a traditional bear market and instead play out a Super Cycle instead? It seems to me like this is, or could be playing out like the beginning of a Super Cycle. A move that takes Bitcoin into the millions. Just the same large parabolic run, similar when you zoom out and view the traditional Dow/S&P Stock Market as a whole since the 1980s. I suppose the absence of a deep and long bear market could be another clue that indicates this theory, until then it's just a theory and time will tell all....

SMCI BONANZA HOW SUPERMICRO GOES BANANA-STANDING AGAINThe Great Banana Republic of Bananadom
🍌 In a world where sunshine dripped like honey and the very air smelled of sweet ripeness, lay the Great Banana Republic of Bananadom. Here, houses were carved from colossal banana peels, their smooth yellow surfaces gleaming. The roads? Paved with dried banana chips, providing a satisfying crunch with every step. The citizens, known as Bananadomites, were a cheerful bunch, their skin naturally tinted a warm yellow. They wore clothes woven from banana fiber, adorned with intricate patterns of banana leaves and blossoms.
🍌 Our protagonist was Bananabelle, a spirited Bananadomite with a crown of woven banana leaves atop her head. Bananabelle wasn't just any Bananadomite ; she was the Royal Banana Baker, famed throughout the republic for her innovative banana-based delicacies. From banana bread that sang sweet melodies when sliced to banana smoothies that granted temporary flight, her creations were legendary.
🍌 Life in Bananadom was idyllic, a continuous cycle of harvesting, baking, and celebrating the glorious banana. But one day, a shadow fell upon this sunny paradise. The Great Banana Tree, the source of all bananas in Bananadom, began to wither. Its leaves drooped, its fruit shriveled, and the air lost its sweet fragrance. Panic gripped the republic. Without the Great Banana Tree, Bananadom would cease to exist.
🍌 Bananabelle, known for her courage and ingenuity, stepped forward. She proposed a daring quest: to venture beyond Bananadom, into the uncharted lands rumored to exist beyond the seemingly endless banana plantations that surrounded their republic. Legend spoke of a mystical Banana Oasis, a hidden paradise where the first banana seed sprouted, and where the secret to eternal banana growth resided.
🍌 Gathering a team of brave Bananadomites– a strong banana farmer named Bananabert, a wise old banana leaf weaver named Nana, and a nimble banana monkey named Chip – Bananabelle set off. Their journey was fraught with peril. They navigated through jungles of giant banana slugs, crossed rivers of banana pudding, and outsmarted grumpy gorillas guarding banana hoards.
🍌 Along the way, Nana shared ancient Bananadomite lore, revealing that the Great Banana Tree's decline was linked to a growing apathy among the Bananadomites. They had become complacent, taking the banana’s bounty for granted and forgetting the importance of gratitude and respect for nature.
🍌 Finally, after weeks of travel, they reached the Banana Oasis. It was a sight to behold: a lush valley teeming with every variety of banana imaginable. At its heart stood a shimmering waterfall of banana nectar, nourishing a single, glowing banana seed.
🍌 As Bananabelle approached the seed, a voice echoed through the valley. It was the spirit of the Great Banana Tree, reminding her of the importance of cherishing their blessings. Bananabelle, humbled, vowed to reignite the spirit of gratitude and respect in Bananadomite. She carefully collected a vial of the banana nectar and, with a renewed sense of purpose, led her team back home.
🍌 Upon their return, Bananabelle poured the nectar onto the roots of the Great Banana Tree. Slowly, miraculously, the tree began to revive. Its leaves unfurled, its fruit plumped, and the air filled with its sweet fragrance once more. The Bananadomites rejoiced, their hearts filled with gratitude. Bananabelle's bravery and wisdom had saved their republic. From that day on, the people of Bananadom celebrated the Banana Oasis Quest, a reminder to always cherish the gifts of nature and the power of community. And Bananabelle? She continued to bake her legendary banana treats, each one a testament to the enduring spirit of the Great Banana Republic of Bananadomite.
🍌🍌🍌 What's a Banana-tastic adventure 🍌🍌🍌

$DOGE ushers in memecoin Supercycle season! Like the previous bull run, #Dogecoin is starting to ignite the supercycle season by leading the memecoin trend!

Memecoin SuperCycle started with $Doge #Dogecoin is the pioneer of memecoin culture, Supercycle will witness further sharp rises with #doge

All eyes on 69000!Once again, all attention is directed towards one area: 69k, the ATH from the last cycle. It's the zone with the trendline, order block, and Fib attention area.
If this zone becomes support, there's only one way - up.
During this consolidation in the range, liquidity has been taken only from below the consolidation. Next, the liquidity from the upper side, 73-80k, will be targeted.
Altcoin season? Very close.
However, there's a chance some may make another low in this consolidation, and with liquidity taken from there, a larger climb might begin. The market sentiment has quickly shifted from bearish to bullish with just a small pump.
It might be wise to place buy orders a bit lower as a precaution.
Overall? I'm very bullish.
Institutions, Pension Funds, Investment Funds, the world's most powerful countries (not Germany :))), ETFs (Bitcoin and Ethereum, and maybe soon Solana), Donald Trump (almost a certainty as the future US president): BUY BITCOIN/crypto and promote it.
Super cycle is coming! 🌟

Bull Market in Housing to continue till 2027It would surprise many.
So far House prices have been holding up with rates going parabolic
Strong economies can usually handle a few years of stable rates in around 5%
Supercycle's generally last 16-18 years
As we saw in the great Bull run of 1982 to 2000
A repeat of this cycle timeframe: would mean
#Bitcoin top 2025 (2009 inception)
#Stocks 2026 (march 2009)
#property 2027 due to lag and time to make a sale. (End of 2011)
