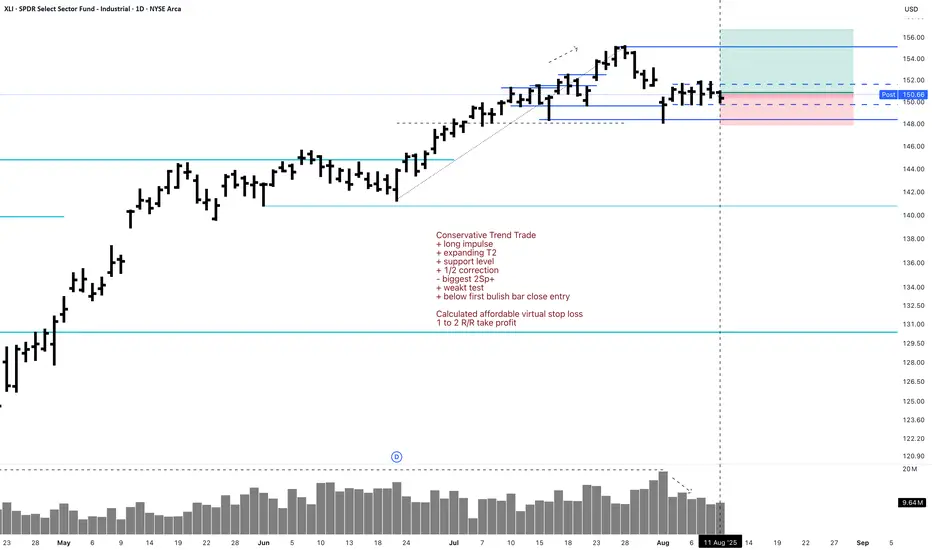
XLI 1D Long Investment Conservative Trend TradeConservative Trend Trade
+ long impulse
+ expanding T2
+ support level
+ 1/2 correction
- biggest 2Sp+
+ weakt test
+ below first bulish bar close entry
Calculated affordable virtual stop loss
1 to 2 R/R take profit
Monthly Trend
"+ long impulse
+ long volume distribution
= neutral zone"
Yearly trend
"+ long impulse
+ neutral zone"
Supply_and_demand
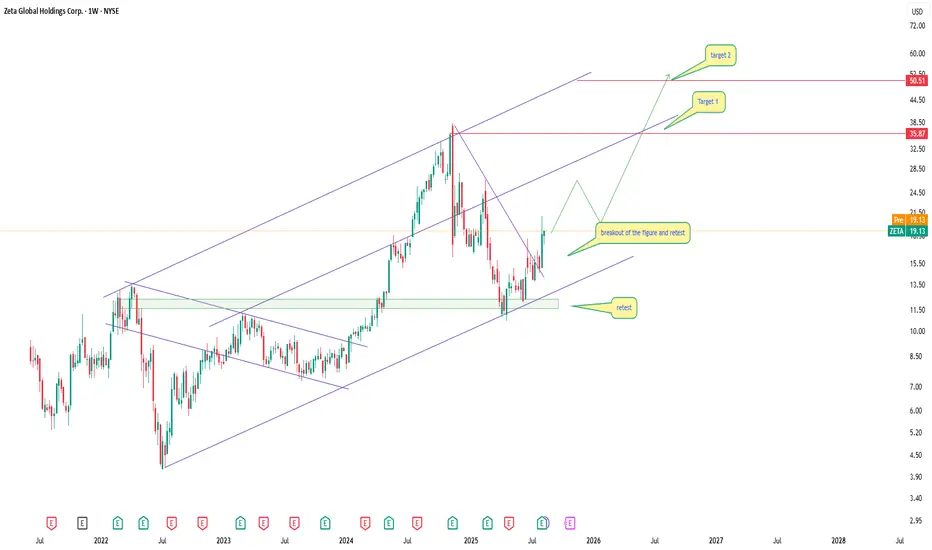
ZETA: when data-driven ads strap on a rocketTechnical analysis:
On the weekly chart, ZETA trades inside an ascending channel. After a deep pullback to the lower channel boundary (14–15$), the price bounced and consolidated above 19$, breaking the descending trendline. The nearest resistance is at 35.87$, and if broken, the next target lies at 50.51$.
EMA and MA on lower timeframes have turned upward, MACD shows a bullish crossover, and volumes are increasing. The upside potential remains strong as long as support at 15–16$ holds.
Tactical plan: buy from current levels and add on a retest of 18–19$, targeting 35.87$ and 50.51$.
Fundamental overview:
Zeta Global is a marketing and data-driven advertising company leveraging AI for targeted campaigns. The business benefits from the global digitalization trend and rising corporate spending on data analytics. Recent earnings showed revenue growth, improved margins, and reduced debt. Rising demand for adtech and institutional interest could further boost the stock.
Conclusion:
If ZETA breaks above 36$, it could jump into a higher price range, turning clients’ ad budgets into rocket fuel.
GBP/USD Buys from 1.35000 back up to 1.36000This week’s focus is on the continuation of the bullish trend, with the main opportunity being a retracement back down into the recent demand zone left behind. From there, I’ll be looking for signs of a Wyckoff distribution to confirm an entry.
If price decides to push higher without retracing, I’ll instead look for a Wyckoff accumulation to form near the 5H supply zone that I’ve marked above current price.
Confluences for GU Buys:
- Recent break of structure to the upside confirms bullish intent.
- DXY has been bearish, supporting a bullish GU outlook.
- A retracement would allow price to re-distribute near the 5H demand zone.
- Clear liquidity above that still needs to be taken.
P.S. If price breaks structure to the downside, it could form a new supply zone — giving earlier sell opportunities. But if nothing confirms, then staying patient and waiting on our hands is also a valid option.

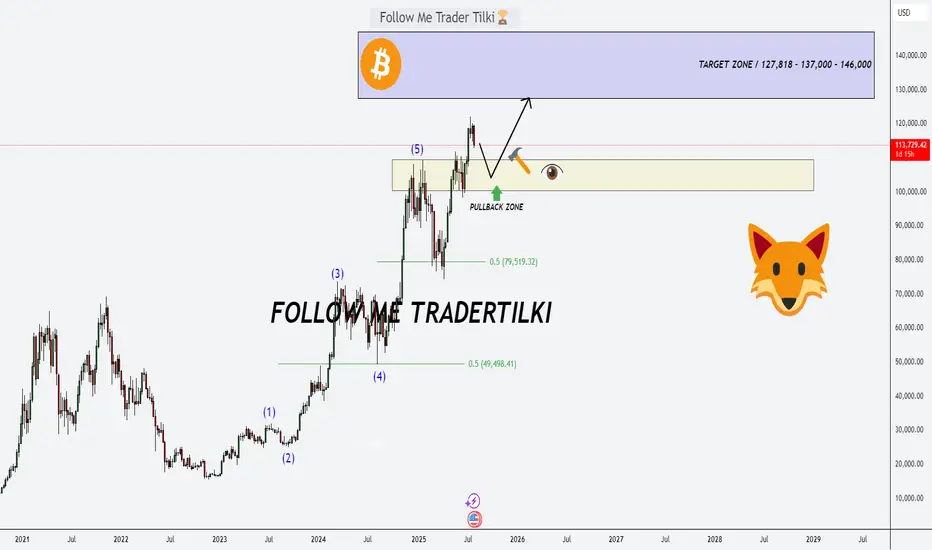
Bitcoin’s Game Has Changed: Fresh Support Zone, Targets Sky-HighHey Dear Friends,
Until recently, Bitcoin had been stuck in a range between 112,331 and 105,344 for quite some time. But that range has now been clearly broken. So, what does this mean? This zone, which used to act as resistance, is now expected to flip and act as support.
According to my weekly trading model, the long-term target levels I’m tracking for Bitcoin are: 127,818 – 137,000 – 146,000.
Since this is a weekly setup, it might take a while for these targets to play out. Even if we see pullbacks to the 112K, 105K, or even 100K levels, I expect to see strong buying pressure from that zone.
I’ll keep sharing regular updates as this setup develops.
To everyone who’s been supporting and appreciating my work—thank you, truly. Your encouragement means the world to me and keeps me motivated to keep showing up. Much love to all of you—I’m grateful we’re in this journey together.
AUDUSD Breakout Setup: Ready for Lift-Off!Hey Guys,
I’ve analyzed the AUDUSD pair for you. If the 0.65245 level breaks to the upside, my target will be 0.65416.
If it doesn’t break, I’ll be looking to buy around 0.65047 or 0.64954.
Either way, my final target remains 0.65416.
In this analysis, I’ve highlighted two key levels and shared my target. I’m planning to buy from these zones.
Every single like from you is my biggest source of motivation to keep sharing these analyses. Huge thanks to everyone who supports by liking!

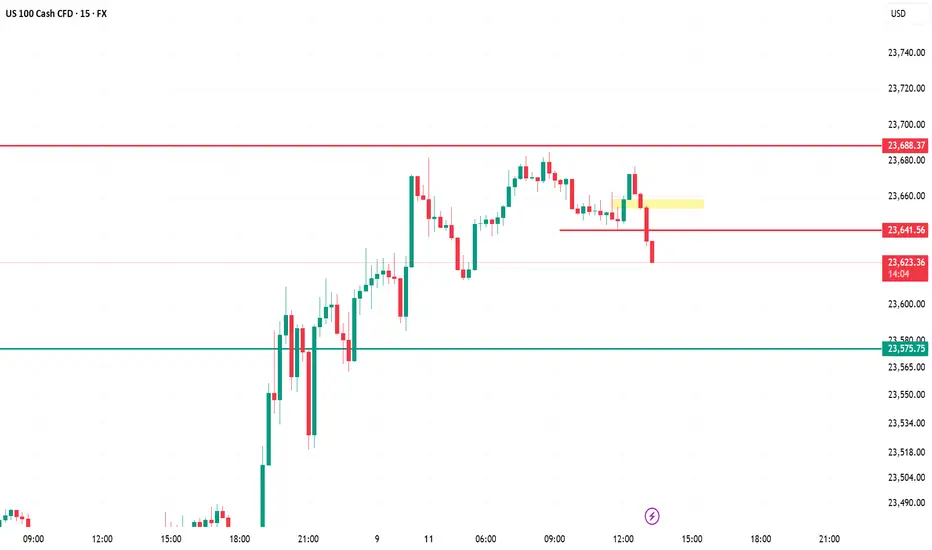
US100 (5m) – AnalysisKey Breakdown – Price has broken below the 23,641 support (red line) after failing to hold the yellow retest zone, signaling short-term bearish momentum.
Immediate Resistance – 23,641 is now flipped into resistance; any pullback toward it could attract sellers.
Downside Target – Next major support sits at 23,575; if broken, deeper liquidity may be targeted below 23,550.
Market Structure – Shifted from intraday uptrend to lower highs & lower lows; momentum favors short trades until structure flips.
Trading Approach – Look for short entries on retests of 23,641 with stop above yellow zone, target 23,575, then trail for possible extended drop.
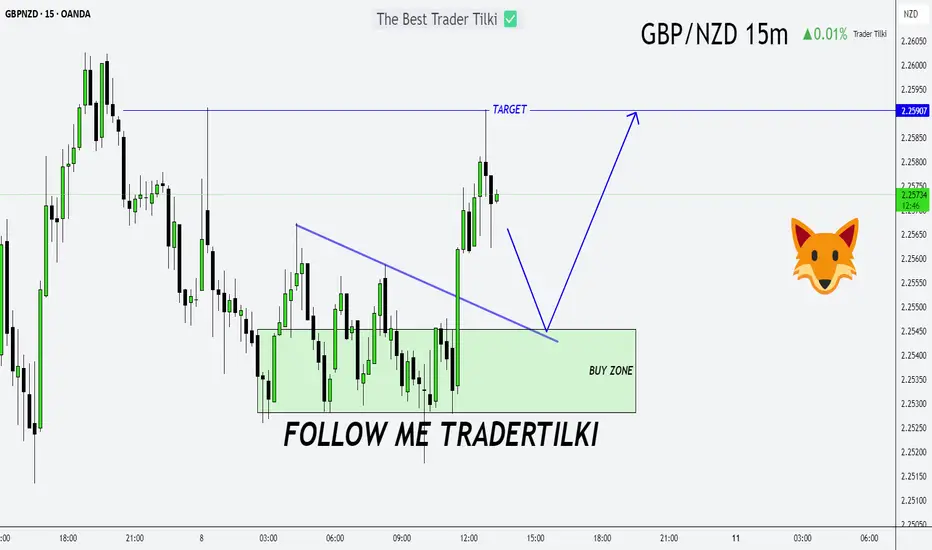
Forecast in, Profits Out: GBPNZD Entry & Target RevealedHello my dear friends,
I’ve prepared an analysis for the GBPNZD pair. I share these insights to help you earn money from the markets.
First and foremost, let’s remember this: as traders, we only forecast market structure. We prepare our analysis and trade based on predictions. But in the end, whatever the whales want—*that’s* what happens. Never forget that.
From time to time, we may be wrong in our analysis, and that’s perfectly okay. What truly matters is that our losses never exceed our gains.
Now, let’s get to the point:
I plan to open a buy position on GBPNZD around the 2.25455 or 2.25282 levels. After entering the trade, my target will be 2.25907.
Every single like you send is my biggest source of motivation to keep sharing these analyses. Thank you so much to everyone who supports me with a like!
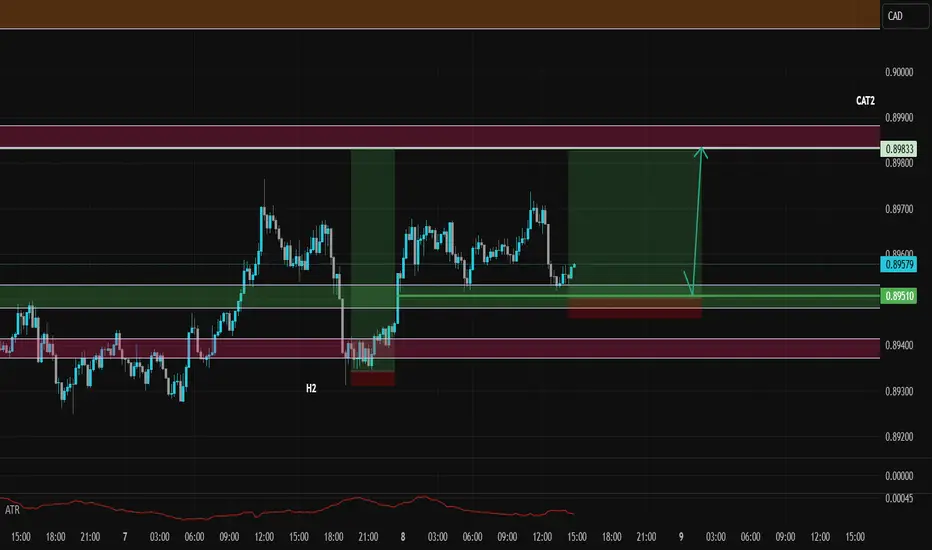
Sniper Entry on AUDCAD - SMC Concepts - Trade Code RevealedAlright snipers, here it is!
From today onwards, I will publish my live trades. My A+ setups.
In this one, I follow the H2 game ( Bullish) as there is no other game played at the moment on this pair contradicting my story.
Story says, H8 bullish, H2 bullish, BOS confirmed. Now market is mitigating towards an imbalance left behind and visible on m15/m8.
I am expecting this last point of true mitigation to be reached, inducing the last swing buyers who believe the market has to go up.
Also a very important info: market will break through the low of Asia and low of Europe sessions before taking off (0.89519)
No sign of reversal move either, H8 candles are closing above the H8 S/R. No sign of H2 or m30 reversal candlestick pattern (Rejection + Acceleration or Supply Zone). So we're good to go.
Enjoy this trade! See you on the one...
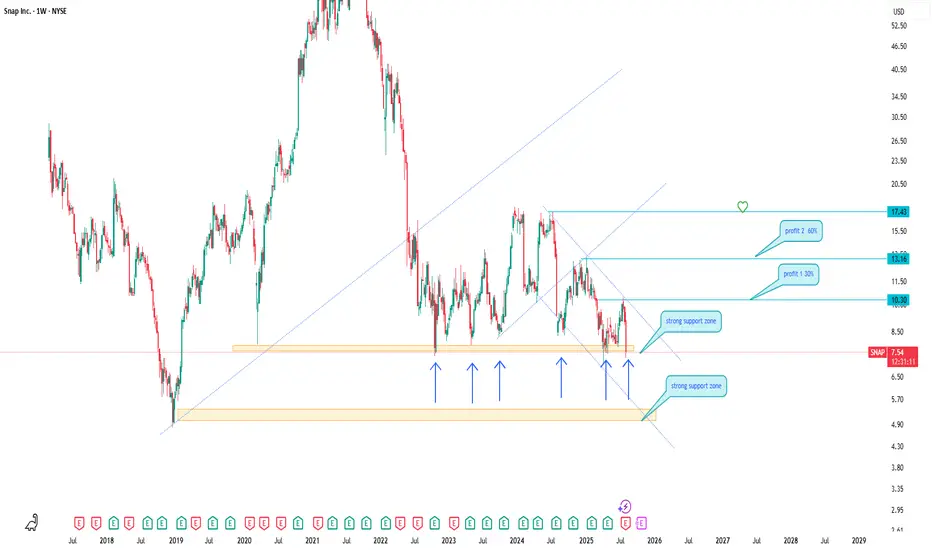
Snap Inc. — key weekly support area for long positionsSnap Inc.
Regularly Pays Cash as Salaries
Price is testing a strong support zone near 6.00–7.00 USD, held since 2022.
Bullish reversal signals are forming. First target: 10.30, second target: 13.16 to 17.43.
Potential upside exceeds 60 percent.
The area is attractive for mid-term investors if the support holds. If price dips lower, I will average the position at 5.50 USD within the extended support zone.
"simple deal that makes money"
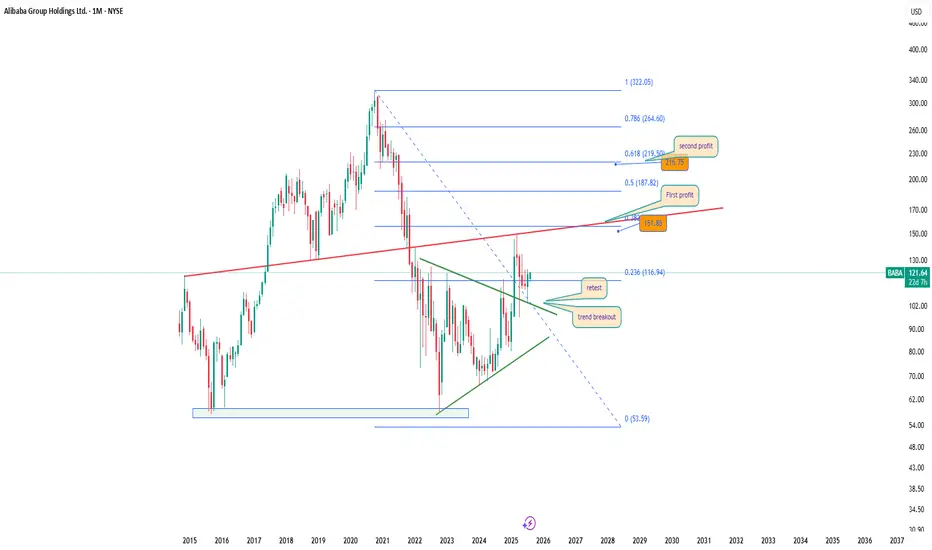
BABA 1M: Chinese favorite rising againTechnical setup:
Breakout from long-term triangle
Retest of trendline confirmed
Price holds above Fibo 0.236 (116.94)
First resistance: 151.85
Fibo targets:
→ 0.5: 187.82
→ 0.618: 219.50
Trade plan:
→ Hold after successful retest
→ Add on dips to 116–118
Targets: 151.85 / 187.82 / 219.50
Fundamentals:
Alibaba is restructuring around cloud and AI. Regulatory pressure from China is easing, and earnings are stabilizing. Buybacks and renewed institutional interest provide strong mid-term support.
Conclusion:
Alibaba may fall seven times, but rise eight — especially when Fibo and price action agree.
Major U.S. News Ahead—Will EURUSD Pivot?Good morning, my friends 👋
Here’s my EURUSD market analysis 📉
Currently, the pair is in a downtrend. I expect this downward move to end around 1.14899 or 1.14536, where a potential buying opportunity may emerge. I personally plan to enter a buy position once price reaches those zones 💼
Also, keep an eye on major U.S. economic reports being released today—they could trigger increased volatility 🔔
Every like you send is a huge source of motivation for me to keep sharing high-quality analysis 🙏 Thanks to everyone supporting the channel 💙

Double Trap on USTEC: Sell Zones Locked In!Hey Guys,
I’ve prepared a NASDAQ 100 / USTEC 100 analysis for you. I’m planning to open sell positions from two key levels:
🔹 First entry: 23,290 or 23,164
🔹 Second entry: 23,397 – 23,450
🎯 Target levels:
TP1: 22,800
TP2: 22,666
Every single like from you is my biggest source of motivation to keep sharing these analyses. Huge thanks to everyone who supports with a like! 🙏

XAU/USD Intraday Plan | Support & Resistance to WatchGold is holding above the $3,369 level after rejecting from the $3,387 resistance zone. Price action remains bullish for now, with structure supported by the rising 50MA, which is acting as dynamic support.
To extend higher, bulls need a clean break and hold above $3,387, which would open the path toward $3,422 next.
If price fails to hold above $3,369, we could see a pullback into the $3,358–$3,344 zone, which remains the first key support. Below that, the next area of interest is the Pullback Zone at $3,329–$3,313 — a former resistance turned support, and a likely area for dip-buying interest.
A break below that would shift focus to the Secondary Support Zone at $3,295–$3,281, where price last launched its breakout.
📌 Key Levels to Watch
Resistance:
‣ $3,387 ‣ $3,422
Support:
‣ $3,369 ‣ $3,358‣ $3,344‣ $3,329–$3,313‣ $3,295–$3,281
🔎Fundamental Focus:
No high-impact data today, but markets may remain reactive.

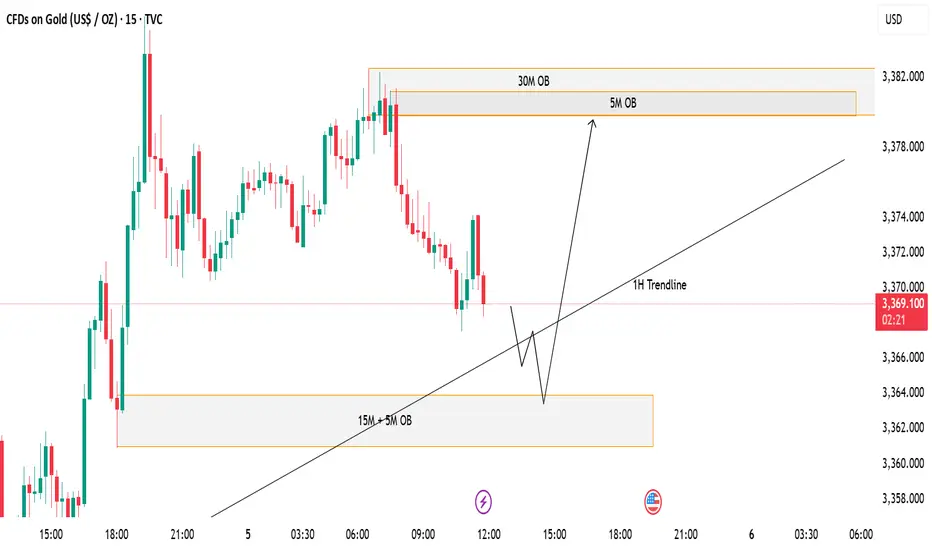
GOLD (XAUUSD) - Potential Bullish Reversal from Demand ZonePrice is currently trading around the 3,368–3,370 area after a steady decline. I’m watching two key zones for a potential reaction:
✅ Demand Zone (15M + 5M OB) – This confluence zone sits near 3,360–3,364. If price taps into this area and shows bullish rejection, I expect a bounce in line with the 1H Trendline support.
📈 Scenario:
A liquidity sweep into the 15M/5M Order Block zone followed by a bullish reaction.
Continuation to the upside targeting the 5M and 30M Order Blocks around 3,380.
⚠️ Invalidation:
If price closes strongly below the demand zone, this bullish setup will be invalidated and further downside could follow.
DXY Just Broke Through the Lock… Where’s the Market Headed Now?🌅 Good Morning, Friends!
A few days ago, I marked 98.950 as a key threshold for the DXY index. As of today, that level has officially been broken—and the bullish momentum we anticipated is now kicking in. 📈
The next target? 101.000.
That said, it’s crucial to remember: DXY is heavily influenced by fundamental data. Stay alert and keep a close eye on key economic developments—they’re essential for navigating this move.
This breakout validates the analysis I shared with you all. And it wasn’t just about charts—it was about discipline, precision, and timing.
Every single like from you is a huge boost to my motivation. Thanks from the heart—your support drives me to keep sharing these insights! 💙

Gold Market Update: Major Support at and Supply atGold is recovering after a strong drop from the previous range high. Price is approaching a 4H Order Block near the 3300–3310 zone, which may act as a supply area. A minor liquidity zone has just been tapped, suggesting a potential short-term rejection.
The major support lies at 3269, which sparked the recent bullish move. If price rejects from the OB zone, a pullback toward this support is likely. However, a clean break and hold above the OB may signal further upside.
📌 Key Levels:
Supply Zone: 3300–3310
Support: 3269
🧠 Wait for clear confirmation before executing trades.

Gold Alert: Key Levels for Potential Sell Setup!Good morning, my friends 🌞
Here’s today’s gold analysis. I'm expecting a decline in gold prices, specifically from the 3,383–3,420 level.
Once a correction starts around that zone, my target will be 3,310. Gold has been riding a strong uptrend, and if we reach those levels, I’ll be expecting a pullback and opening a sell position accordingly.
Please set your stop loss based on your personal margin preferences.
Your likes and support are my biggest motivation for continuing to share these analyses. Thank you to everyone showing appreciation 🙏

A New Day, A New Opportunity: USDCAD Buy StrategyGood morning Traders,
USDCAD has reached a key support zone between 1.37531 and 1.37592.
I'm opening a buy position from this level, aiming for the 1.37887 target.
Feel free to adjust your stop-loss based on your own margin and risk tolerance.
Your likes are my biggest source of motivation when sharing analysis. Thanks to everyone who supports with a simple like!

DOGE/USDT Technical Analysis – Breakout AnticipationDOGE/USDT Technical Analysis – Breakout Anticipation
As of the current market structure, DOGE/USDT is showing signs of a potential bullish reversal from the demand zone (support), aiming toward the projected target at 0.27253 USDT.
🔍 Chart Structure & Price Action
Support Zone (0.21873 – 0.22568): The price has previously respected this area, making it a strong demand zone where buyers stepped in.
Resistance Zone (0.27756 – 0.29000): A key supply zone where previous rallies halted. This is the ultimate test for bulls after the breakout.
Current Price (0.23743) is showing consolidation above the support, suggesting accumulation before a move.
🧠 Technical Indicators
Supertrend Indicator: Currently flipping to bullish (10,3 settings), indicating potential upside continuation.
Volume Profile (VRVP): Shows high volume nodes around the support level, confirming strong interest from institutional players or large orders.
Market Structure: A higher-low is forming, indicating early signs of a bullish market shift.
🎯 Target
The projected move towards 0.27253 USDT aligns with previous price action and supply zone interaction. A clean breakout from the current consolidation could fuel momentum toward this level.
🎓 Educational Insight
This setup reflects the principles of Smart Money Concepts (SMC):
Price tapping into demand before impulse moves.
Liquidity grab at lows.
Break of structure (BOS) to the upside could trigger continuation.
Traders can learn the value of combining structure-based trading with volume analysis to improve entry precision and confidence.

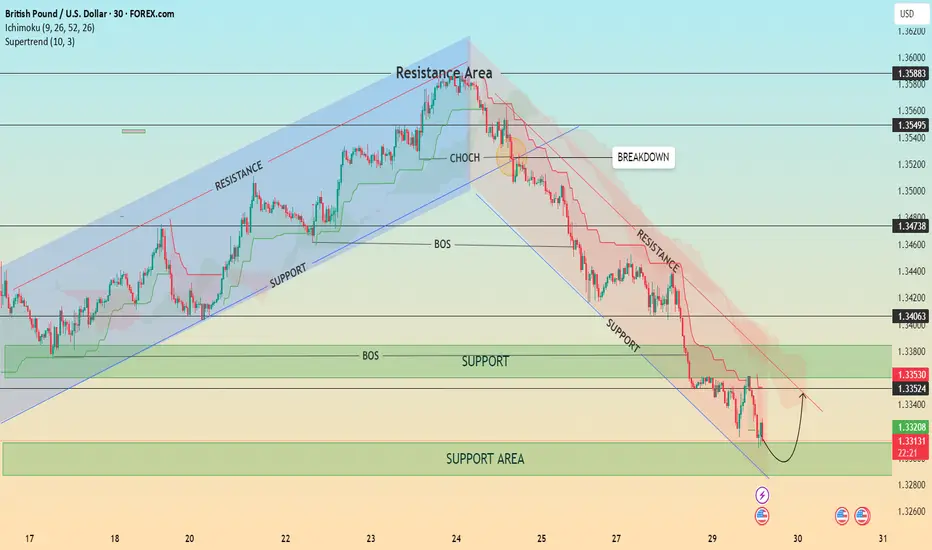
GBP/USD – Bearish Structure with Possible Short-Term Pullback📊 GBP/USD – Bearish Structure with Possible Short-Term Pullback
Timeframe: 30-Minute | Date: July 29, 2025
Price action recently broke down from a well-respected ascending channel, confirming a shift in market structure with a Change of Character (CHOCH) followed by a Break of Structure (BOS). Since then, GBP/USD has been respecting a descending trend channel, forming consistent lower highs and lower lows.
🔍 Current Setup:
Price is testing a major support area around 1.3300–1.3320.
A minor pullback is expected as indicated by the bullish wick rejections.
However, the overall bias remains bearish unless we break and hold above the 1.3353–1.3406 resistance zone and the descending trendline.
The Ichimoku Cloud and Supertrend both show bearish momentum.
📈 Potential Scenario:
Price may bounce from the support area and retest the upper boundary of the descending channel before resuming the bearish trend.
⚠️ Key Levels to Watch:
Resistance: 1.33530 / 1.34063 / 1.34738
Support: 1.33200 / 1.33000
💡 Structure Notes:
CHOCH = Trend Reversal Signal
BOS = Confirmation of Downtrend
Cloud = Dynamic Resistance
XAU/USD Intraday Plan | Support & Resistance to WatchGold remains under pressure, currently trading around 3,312. Price is holding just above the 3,309–3,289 Support Zone, but remains below both the 50MA and 200MA, which continue to slope downward—indicating short-term bearish pressure.
As long as price remains below the 3,334–3,348 resistance zone, the bearish momentum is intact. A clean break above this area would be the first sign of recovery, opening the path toward 3,362 and 3,373, where the next round of supply may emerge.
If price fails to reclaim 3,334 and breaks below 3,309, the 3,289–3,267 Support Zone becomes the next key downside target. Failure to hold that level would expose the HTF Support Zone (3,241–3,208).
📌 Key Levels to Watch
Resistance:
‣ 3,334
‣ 3,348
‣ 3,362
‣ 3,373
Support:
‣ 3,309
‣ 3,289
‣ 3,267
‣ 3,241
🔍 Fundamental Focus – Tuesday, July 29
Heads up — today’s focus is on 4:00pm, when we get JOLTS Job Openings 🟥 and CB Consumer Confidence 🟡
⚠️ Stay light and nimble — bigger moves may come tomorrow with red-folder data stacking up.

"XAU/USD Hits Major Demand – Is a Relief Rally Brewing?"🟡 XAU/USD (Gold) – Demand Zone Rejection in Play | Bullish Correction Ahead?
Timeframe: 30-Minute | Date: July 25, 2025
Created by: AllyPipsExpert
Indicators: Ichimoku Cloud, BOS (Break of Structure), Dynamic S/R, Trendlines
---
🔍 Technical Analysis & Key Insights:
🔸 1. Market Recap – Distribution & Downtrend Confirmation:
After the Break of Structure (BOS) near 3385, gold confirmed a bearish reversal following the distribution phase at the top resistance zone around 3445–3460.
Bearish momentum was sustained by a descending trendline, paired with a bearish Kumo (Ichimoku cloud) crossover.
🔸 2. Major Zone Tagged – Key Demand Area Tested:
Price has now reached the critical demand block at 3320–3340, a zone that previously initiated bullish impulse on July 18–19.
The current bullish projection (in blue) reflects potential short-term recovery or correction phase, following oversold conditions and historical support strength.
🔸 3. Bullish Reversal Potential – Short-Term Retracement?
The blue arrow reflects a likely bullish retracement toward 3360–3380, aligning with trendline retest and potential Kumo rejection.
Expect sellers to re-enter if price retests former BOS/imbalance zone, creating scalp or swing sell setups on confirmation.
---
🔧 Confluences & Technical Highlights:
Confluence Point Description
Demand Zone Strong previous accumulation at 3320–3340
BOS Retest Area Key liquidity level now acting as resistance
Ichimoku Cloud Price below cloud = bearish bias maintained
Descending Trendline Reinforces bearish structure unless broken
Price Action Rejection wick at demand + potential short squeeze
---
🎯 Trade Outlook:
🧭 Bias: Short-Term Bullish Rebound → Long-Term Bearish Continuation
🟩 Support: 3320 – 3340
🟥 Resistance: 3360 – 3385 (BOS & Trendline zone)
🔁 Scenario: Bounce → Retest → Continuation lower (unless breakout confirmed)
---
📘 Why This Chart Could Be Featured:
✅ Multi-layered Analysis: BOS, zones, cloud, price action, and psychological zones used together.
✅ Forward-Looking: Projects the next logical market reaction instead of just explaining the past.
✅ Clean, Structured, Educational: Layout and visuals guide the viewer through logical trade steps.
✅ Value-Packed: Provides actionable levels and flexible scenarios — helpful to traders of all levels.

EURUSD - Next Buy Zone? This one has some nice potential
We will see how it plays out if we get tagged in
