Ethereum Outlook – Key Levels in Play Amid Market JittersAfter a turbulent week across the crypto space—with volatility even bleeding into traditional equities—it's clear just how fragile sentiment remains. We’re seeing the usual overreactions: every minor selloff triggers calls that the bull market is over, despite the broader structure holding up... for now.
🔍 ETH Technical Outlook
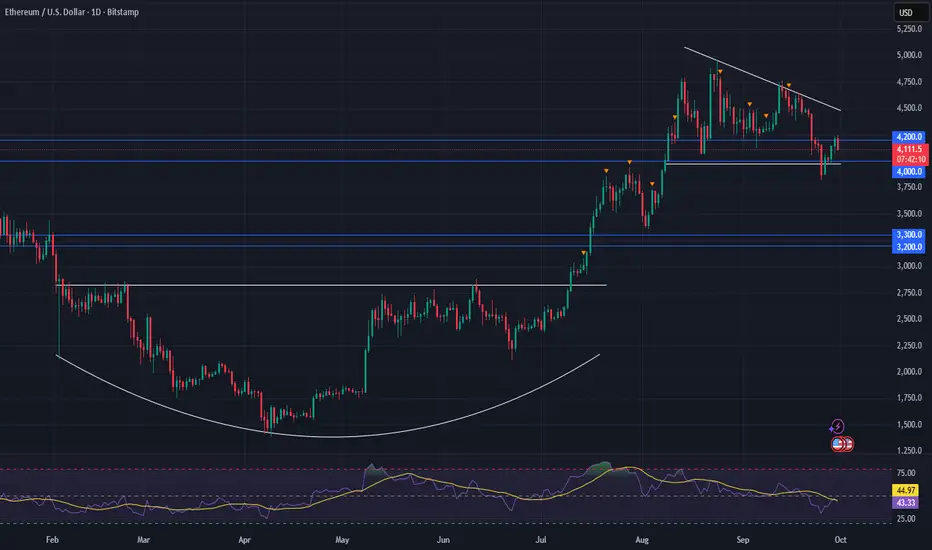
Ethereum is retesting a major support zone between 4000–4200. This area has acted as a springboard before, but if it breaks decisively, it could flip to resistance, introducing more headwinds for bullish momentum.
Still, this may be shaping up as another dip-buying opportunity—if macro conditions remain stable and Bitcoin doesn't lead a broader breakdown.
🧱 Next Support Zone
If 4000–4200 doesn’t hold, the next major support zone is 3200–3300. This aligns with previous accumulation levels and would likely draw interest from larger buyers if price gravitates down there.
🔺 Chart Pattern Watch: Triangle Shift
We’ve been tracking a triangle formation, which now appears to be shifting from a symmetrical triangle to a descending triangle—a change in tone, but not yet a deal-breaker for the bulls.
The longer-term target remains intact: we’re still eyeing the 5700–5800 range, assuming structural support zones continue to hold and volume confirms any breakout.
Support
Will BTC come out of the downward channel?• In the chart you can see how we are close to the upper limit of the downward channel. This is a key signal - if the breaking persists, it may mean a change in the trend.
• We have several support levels from below (marked with red lines):
• 112,238 USD
• USD 108,981
• USD 107,040
• From the top you can see resistance (green lines):
• 115,266 USD (local resistance - the course is just approaching)
• 117 395 USD
• 119 404 USD
⸻
🔹 Medium walking (SMA/EMA)
• You can see EMA Cross 50/200 (yellow label) - a classic signal "Golden Cross" / "Death Cross". It seems that the average is raised recently, which the market often interprets as a signal of a potential change of trend.
• SMA #1 and #2 (red and green lines) - the course tries to stay above the average, which is positive.
• SMA #5 (blue line below) shows long -term support ~ 107k USD.
⸻
🔹 MacD (below)
• The histogram shows reversal - red posts decrease, and the lines (blue and orange) are approaching each other → possible buy signal.
• If the signal line is intersected up, this will be confirmed by the growth moment.
⸻
🔹 RSI (Relative Strength Index)
• RSI is currently around 40-50 →, i.e. a neutral level (neither purchase nor selling).
• It slightly reflects from below, which suggests that there may still be space for further growth before we enter the purchase zone (> 70).
⸻
📌 Summary
• Short -term (1-7 days): it looks like BTC is trying to stand out from the downward trend. If it pierces 115,266 USD and persists above, subsequent goals are 117 395 USD and 119 404 USD.
• Medium -term (weeks): support levels 112K - 108K are key. A decrease below 107k would negate a bull scenario.
• Technical signals: MacD and RSI give the first signs of reflection. The course balances on the border of breaking the trend.
👉 It looks at the beginning of a potential growth movement, but it will be crucial whether BTC will stay above 115K.

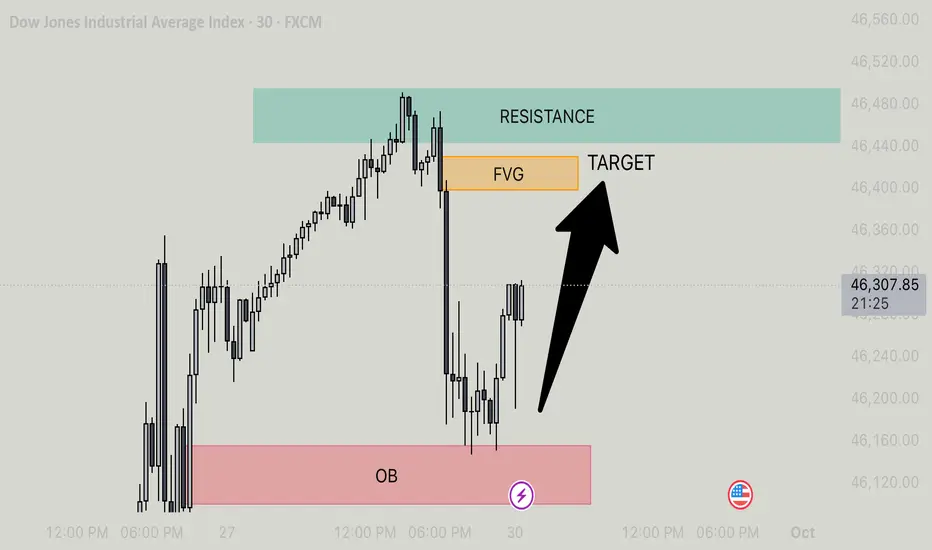
US30 - BULLISH MOMENTUM TARGETING FVG AFTER OB REJECTION Price is currently in a clear bullish phase following a strong reaction from the marked Order Block (OB) zone. This OB acted as a high-probability demand area, where institutional buying likely stepped in, reversing the prior bearish move and initiating a shift in market structure. The subsequent price action has formed a series of higher lows and bullish candles, indicating sustained buying pressure and a potential continuation toward the upside.
The next key area of interest is the Fair Value Gap (FVG), which represents an inefficiency in price where no trading occurred. These imbalances are often targeted by institutions to rebalance the market, and price tends to gravitate toward them. In this case, the FVG is positioned just below a well-defined resistance zone, creating a high-probability target for the current bullish move.
Given the lack of immediate overhead resistance before the FVG, and the presence of strong bullish momentum, price is expected to continue climbing until it reaches the FVG zone. Once this area is filled, we may see a reaction or potential rejection, but for now, the structure supports a move upward. Traders should watch for continuation patterns, such as bullish flags or breakouts, as confirmation that price will tap into the FVG before any significant reversal occurs.
ETH/USD - BUILDING MOMENTUM FOR NEXT BULLISH LEGOn the 15-minute ETH/USD chart, we can clearly observe that price action has shifted into a bullish structure after forming a strong impulse move from the lower demand zone. The market respected the higher timeframe liquidity area around 4,140 – 4,150, where buyers stepped in aggressively, creating a solid base for the upward push. From there, a clean series of higher highs and higher lows started to establish, indicating strong bullish momentum in play.
Currently, ETH is respecting the ascending trendline that has been guiding the price upward. Each retest of this trendline has been met with bullish rejections, confirming that buyers remain in control. The price is now consolidating just above the minor supply-turned-demand zone near 4,170, which shows that the previous resistance has flipped into support — a positive sign for continuation.
If the price manages to sustain above this intraday support and trendline, we can expect a potential continuation toward the upside target. Any minor pullback into the demand zone would likely attract buyers again, keeping the bullish structure intact. As long as price stays above the 4,160 zone and does not break below the trendline with strong bearish candles, the bias remains bullish.
Overall, the structure suggests that ETH is preparing for another leg higher, with the projected target in sight. Traders should monitor the price behavior around the support and trendline for confirmation before entering, as clean candle closures above these levels will add confidence to the bullish scenario.

mrmoney limited BTC/USD swing trading ideaprice approached a key level of support zone on the weekly timeframe which is giving a buy signal

BTC/USDT - BREAKOUT Or BREAKDOWN AHEADThe price is currently trading around the 112,112 USDT level with slight intraday fluctuations. The chart highlights a key horizontal support and resistance (S/R) structure with two red horizontal lines marking these zones.
1. Resistance (R) Zone
The upper red horizontal line, marked as “R,” is acting as a resistance level around the 112,400 USDT region. Price has tested this level multiple times in the recent sessions. A clear breakout above this resistance could signal further bullish continuation.
2. Support (S) Zone
The lower red horizontal line, marked as “S,” is situated around the 111,600 USDT level. This zone has provided a strong demand base for buyers. If the price retraces, this level will act as a critical support.
3. Current Price Action
At the time of observation, Bitcoin is consolidating right above the resistance zone, suggesting a possible breakout attempt. The candlesticks indicate bullish momentum leading into the resistance, with a series of higher lows forming before the test of resistance. This pattern reflects increasing buying pressure.
4. Possible Scenarios
• Bullish Scenario: If the price successfully breaks and holds above the resistance zone (R), it may trigger a move towards the next target to the upside, projected around the 112,800 – 113,200 USDT region. The structure suggests the possibility of forming a bullish continuation pattern, with traders targeting higher resistance levels.
• Bearish Scenario: If the breakout attempt fails and Bitcoin gets rejected at resistance, price could retrace downward. A move below the support zone (S) at 111,600 USDT would likely signal bearish momentum, with the next target projected around the 111,200 – 110,800 USDT range.
5. Market Sentiment
The price action is consolidating in a range-bound structure between support and resistance. This often reflects market indecision before a breakout. A breakout from this range, either above resistance or below support, will provide a clearer directional bias.
⸻
Conclusion:
The BTC/USDT 15-minute chart is currently at a critical juncture. Traders should closely monitor whether Bitcoin sustains above the 112,400 resistance to confirm a bullish breakout, or if it fails and drops back below support at 111,600, signaling bearish continuation. Patience and confirmation of breakout direction are key before entering new trades.

SOL/USDT 1D chart review 1. General trend
• A strong upward trend has been underway since June (orange trend marked).
• Recently, we had a very strong rally to around USD 250, but there was a violent correction.
2. Support and resistance
• resistance:
• USD 214 (local resistance, the market has bounced down here).
• 230 USD (strong resistance).
• USD 250 (peak, main resistance).
• Support:
• USD 193 (here the price is currently fighting).
• 176 USD (another strong support - earlier consolidation).
• USD 158 (key support, fracture could mean a change in the trend).
3. STOCHASTIC RSI
• Currently in the sales zone (nearly 0) → may suggest that the market is approaching a local hole and a potential reflection.
4. Scenarios
• Bullish:
If support is supported at 193 USD, possible reflection in the direction of USD 214, and after breaking this level - an attack on USD 230.
• Bearish:
If the price pierces $ 193 down, the next goal is 176 USD, and below even USD 158.
5. Summary
• The market is in correction after strong height.
• At the moment, the key level is 193 USD. Maintaining this support can be reflected.
• However, breaking 193 will open the road to 176.
• RSI shows the sale → short -term relief.

BTC: Reclaim 110.4–111.1k or lose 108.7k — the pivot__________________________________________________________________________________
Market Overview
__________________________________________________________________________________
BTC is in a corrective phase after the 117–124k top, still holding the HTF demand at 108,713–107,286. Price is highly level‑driven, with a mild risk‑off tone capping rebounds near 110.4–111.1k.
Momentum: 📉 Slightly bearish below 110,402–111,135, with a low‑range structure holding above 108,713.
Key levels:
• Resistances (1H/4H/1D) : 110,402–111,135 (major lid), 114,471, 117,971.
• Supports (12H/1D/1W) : 108,713–107,286 (demand zone), 98,330 (weekly base).
Volumes: Very high on the sell‑leg in 4H/2H/1H; normal to moderate on 1D.
Multi-timeframe signals: 1D/12H filters stay up, while 6H/4H/2H lean down; 1H/30m/15m show tactical long windows on support. A reclaim of 110.4–111.1k would align TFs higher.
Risk On / Risk Off Indicator: Reading NEUTRAL SELL → confirms capped rebounds and slightly contradicts the HTF up filter.
__________________________________________________________________________________
Trading Playbook
__________________________________________________________________________________
Strategic stance: HTF trend still up but fading; stay opportunistic and disciplined around key levels.
Global bias: Neutral‑bearish below 110,402–111,135; bias invalidated if a daily close above 111,135 holds.
Opportunities:
• Reclaim buy: Go long on breakout + held retest of 110,402 toward 111,135, targeting 114,471 next.
• Tactical sell: Fade clean rejections at 110,402/111,135 if risk‑off persists, targeting 109.0k then 108,713.
• Breakdown sell: Short confirmed loss of 108,713 (≥2 closes + failed retest) toward 107,286.
Risk zones / invalidations:
• A break of 108,713 likely opens 107,286 and raises downside momentum risk.
• Reclaim of 111,135 invalidates tactical shorts and unlocks 114,471.
Macro catalysts (Twitter, Perplexity, news):
• PCE in line: supports “higher‑for‑longer” and a firm USD → mild headwind.
• Fed “data‑dependent”: restrictive but flexible; market guided by levels.
• Spot ETFs: negative daily flow, 7‑day near neutral → cautious near term, MT adoption intact.
Action plan:
• Long (reclaim): Entry 110,450–110,650 / Stop < 108,713 / TP1 111,135, TP2 114,471, TP3 117,971 / R:R ~2–3.
• Short (rejection): Entry 110,100–110,300 / Stop > 111,135 / TP1 109,000, TP2 108,713, TP3 107,286 / R:R ~1.8–2.5.
__________________________________________________________________________________
Multi-Timeframe Insights
__________________________________________________________________________________
Overall, HTFs remain constructive while MTF/intraday manage a base‑building range under nearby resistance.
1D/12H: Up filters softening; 108,713–107,286 defended; a reclaim above 111,135 would target 114,471.
6H/4H/2H: Down sequences with notable sell volume; 110,402 caps rebounds; loss of 108,713 likely opens 107,286.
1H/30m/15m: Tactical long windows on support (absorption/wicks), yet need a sustained push >110,402; otherwise the low range persists.
Major divergences/confluences: HTF support confluence (108,713–107,286) vs mild risk‑off impulse; clearing 110.4–111.1k aligns TFs higher.
__________________________________________________________________________________
Macro & On-Chain Drivers
__________________________________________________________________________________
Macro is slightly constraining but not shocking, while on‑chain/flows set the tactical pivot.
Macro events:
• PCE in line and firm USD: reinforce “higher‑for‑longer” → mild risk‑off bias.
• Fed data‑dependent: restrictive yet flexible; elevated sensitivity to levels.
• New US tariffs: potential near‑term inflation impulse → possible risk‑off spillovers.
Bitcoin analysis:
• STH Cost Basis ~109.5–111k: a key psychological/technical pivot; fast regain fits bull‑market behavior if held.
• Options/futures: post‑expiry “cleanup” and positioning reset; snapbacks likely if levels are reclaimed.
• ETFs: daily outflows, 7‑day near neutral; MT adoption intact, but caution short term.
On-chain data:
• Sentiment washed out (low Fear & Greed) with improving hashrate: structurally supportive backdrop.
• Stablecoins: recent issuance indicates “dry powder,” not guaranteed to deploy.
Expected impact: Without a reclaim of 110.4–111.1k, mild risk‑off weighs; above it, MT/flow confluence favors a squeeze toward ~114.5k.
__________________________________________________________________________________
Key Takeaways
__________________________________________________________________________________
BTC is basing in a low range atop HTF supports, with a mild macro headwind.
- Overall trend: neutral‑bearish below 110.4–111.1k, yet 12H/1D filters remain up.
- Most relevant setup: reclaim buy above 110.4–111.1k toward 114.5k; conversely, loss of 108.7k targets 107.3k.
- One key macro: PCE in line and a data‑dependent Fed keep a mild risk‑off tone.
Let the levels lead: wait for a confirmed reclaim above 110.4–111.1k or a breakdown of 108.7k before committing risk. ⚖️

4H IDEA FOR GBPJPY 26TH SEP, 2025.The British pound is still moving up, but choppy on the higher timeframes, but the trend is clear but more on the lower time frames. Price may continue higher in the coming session, but we sit on our hands and watch as my Bia is based on a bullish move.
As usual, my calls or analysis are based on what we see, the current Bias, and from a probability standpoint, meaning that this projection may be or may not be validated, so tread carefully, and as usual, this is not financial advice, trade responsibly

GBP/USD - Multi Timeframe Forecast🕰 Weekly View
Weekly is looking toppy near that 1.38–1.39 rejection zone.
Big weekly BOS already in play → momentum pointing down.
Liquidity targets sit way lower at 1.28–1.29 (weekly demand + swing range).
📉 Daily Structure
Daily broke structure → now printing lower highs.
A daily supply zone sits heavy overhead near 1.36–1.37.
If sellers keep pressing, the magnet is clear: 1.30–1.31 daily demand (stacked with fib + HV buy zone).
Any bounces are likely just snack stops for liquidity 🍟 before rolling lower.
⏱ 4H Breakdown
Price is hunting between two short-term options:
1️⃣ Option 1: Tap into the 4H supply around 1.3450–1.3500, reject hard → continuation down.
2️⃣ Option 2: Push a bit higher into the high-volume sell zone at 1.3550–1.3600 → then dump to new lows.
Below, key demand sits at 1.3200 → 1.3000, so that’s the landing pad 🎯.
🎯 Summary
Bias : Bearish until proven otherwise.
Weekly → Failed top, heading toward deeper demand.
Daily → Lower highs into supply, eyes on 1.30.
4H → Watch for rejection at sell zones before shorting.
Big picture → GBP/USD looks like it’s loading up for a multi-week selloff 📉 unless buyers defend hard at 1.32.

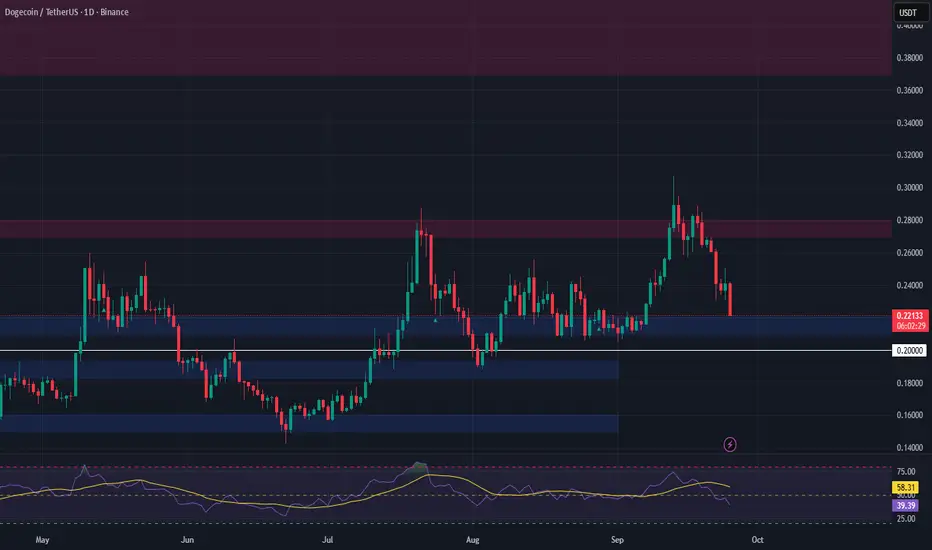
DOGE — Watching for a Relief Bounce from SupportDogecoin has pulled back into a key support zone at $0.21–$0.22, a level that has historically acted as both resistance and support. With the broader market showing signs of consolidation, this area could offer a short-term bounce opportunity.
That said, this is likely a relief rally within a broader downtrend, so managing risk is critical. A failure to hold this support could lead to a deeper correction later this month.
🔹 Trade Plan:
• Entry Zone: $0.21–$0.22
• Targets: $0.27–$0.28, $0.37–$0.44
• Stop Loss: Below $0.20
This is a spot-only setup with an asymmetric risk-reward profile if the bounce materializes. Avoid overleveraging and stick to your plan.
USD/JPY - 4H forecast (sell side Imbalance to fill)🔥 USD/JPY – 4H Forecast 💵💴
Dollar-Yen just pulled a slick liquidity grab and is loading for another leg higher. Let’s map it out 👇
🕰 Market Context
Price cleaned up the 8H demand and launched with a monster impulse 🚀.
Structure flipped bullish with a strong Break of Structure (BOS).
We’re consolidating right under buy-side liquidity (BSL), teasing the breakout.
📈 Bullish Flow
4H Imbalance (IMB) has been filled → confirms buyers are still strong.
71% retrace + strong support zone aligning at 147.8–148.0 → golden buy zone 🎯.
Swing range shows room for expansion into new highs above 149.5–150.0.
⚡ Key Levels
Support / Buy Zone:
148.0 → ideal retrace entry
147.5 (deep discount if we sweep liquidity)
Resistance / Targets:
149.2–149.5 (first stop)
150.0+ (big figure liquidity magnet)
🎯 Forecast Path
Expect a dip into 148.0 zone for liquidity grab 🔄.
From there → bullish continuation into 149.5–150.0 🚀.
If 147.5 cracks → deeper retrace into 146.8 swing low support.
📝 Trade Idea
Bias: Bullish (structure flip + demand respected).
Plan : Longs on 148.0 retest.
Targets : 149.5 → 150.0.
Invalidation : 4H close below 146.8 kills the long bias.
📌 Summary : USD/JPY just reloaded off demand and is primed for a push into 150. Dips into 148.0 are gifts for buyers, unless 146.8 breaks.

S&P500: Flash dump continues, short bias remains!
📝 1. Market Context
BLUEBERRY:SP500 Yesterday’s analysis highlighted the weakness after the market failed at resistance. Today, that scenario was confirmed with a flash dump and a sequence of strong red candles, signaling sellers remain firmly in control. The short-term structure continues to print lower highs and lower lows, which clearly reflects the dominance of the bearish trend.
🟥 2. Resistance Zone
The 6,651 – 6,658 area (red zone on the chart) continues to act as a critical resistance. This zone is reinforced by 4 levels of resistance combined with moving averages (MA). Moreover, the latest bounce is still contained within a large red candle, signaling that buyers lack the strength to shift momentum.
Each time price tested this zone, it faced strong rejection. As long as the market trades below this red zone, the dominant trend remains bearish.
📉 3. Bearish Trend & Downside Targets
Currently, the market has confirmed the bearish trend by consistently forming lower highs. This is already the third bearish leg since the downtrend began – and according to wave logic, the third leg often turns out to be the strongest one, provided resistance at 6,658 holds.
• Immediate target: 6,629 – 6,615 (a key support cluster that previously rejected price).
• If broken: selling pressure could push the market further down toward 6,578 and even 6,560 – both strong technical and psychological support levels.
✅ 4. Conclusion
The S&P500 has confirmed its bearish trend with a flash dump. The 6,651 – 6,658 area remains the critical resistance, and as long as price stays below this zone, sellers have the upper hand. The bearish scenario remains valid with the first target at 6,629 – 6,615, and if this support fails, the move could extend toward 6,578 – 6,560.
Please like and comment below to support our traders. Your reactions will motivate us to do more analysis in the future 🙏✨

ETHUSDT 1D chart Review1. Trendline (orange) - was clearly pierced down → it is a signal of weakening the growth moment.
2. Horizers of support / resistance:
• Resistance: $ 4,604 (strong), above $ 4,960.
• Support: $ 4 150 (currently tested), next $ 3,958 and $ 3,696.
3. Price - currently ~ 4 169 $, i.e. right with the support of $ 4 150.
4. Candles - a strong inheritance candle after piercing the trend → weakness signal.
5. STOCHASTIC RSI - in the sales zone (<20), which may suggest the possibility of short -term reflection.
⸻
🔹 Application:
• Short date: possible reflection from $ 4 150 thanks to the sale (technical bounce).
• average date: If level $ 4 150 breaks and the candle closes below → the road opens to $ 3,958 and even $ 3,696.
• Only a return above $ 4 272 and a retest trendline from below would give a signal of buyers.
⸻
👉 To sum up: The market is in the critical zone - support $ 4 150 decides.
• Bull: keeping the defense of this level + reflection from the sale.
• Bear: loss $ 4 150 = greater correction in the direction of $ 3 950–3 700.

BTCUSD 4h ShortTerm Chart1. Main Trend
The chart clearly shows a descending channel – the recent upward breakout failed to hold, and the price has returned to resistance.
The pattern of lower highs (LH) and lower lows (LL) continues, likely indicating a break to a lower low.
The recent high at ~$118.3k has been rejected, and the market is heading down.
2. Key Levels
Support (red lines):
$111.426 – currently being tested.
$109.408 – stronger support, previous local lows.
$108.100 and $107.356 – further potential targets if the decline deepens.
Resistance (green lines):
$115.775 – the nearest significant resistance.
$118.322 – the upper boundary of the channel and the previous LH.
USD 122,367 – a key breakout level that would reverse the trend.
3. EMA/SMA
The 50 and 200 EMAs (blue/yellow) show a bearish cross, with the price below the averages → a negative signal.
The 200 SMA (~USD 114,137) acts as strong resistance, currently unbroken.
4. Indicators
MACD: lines strongly below the line, histogram rising in the negative zone → a downtrend with a predominance of supply.
RSI: ~33, close to the oversold zone (<30), which could result in a short-term rebound, but there is no upside divergence yet.
5. Scenarios
🔴 Bearish (more likely)
Continuation of the downward move towards 109.4k → 108k → 107.3k.
A break below 107k opens the way to 103–105k (LL2 on the chart).
🟢 Bullish (less likely)
A defense of 111.4k and a return above 114.1–115.7k.
A break above 118.3k would negate the downtrend and open the way to 122k+.

BTC/USD 12H local downtrend📊 Chart structure
• BTC price: ~ 112,765 USD (decrease -2.18%).
• Trend: after prior reflection from the holes (~ 107k), BTC is approaching the resistance zone.
• Inheritance channel: The marked yellow line suggests that the price is still in a medium -term inheritance trend
⸻
🔑 levels of support and resistance
• Support:
• USD 111,461 (close to support - if it falls, a quick test below).
• USD 107,346 (key support - its loss opens the road towards 103-105k).
• resistance:
• USD 118.004 (important level of resistance).
• USD 124.619 (strong resistance - local peaks).
⸻
📈 indicators
• SMA (movable average):
• Red (SMA #1) - short -term, currently acts as dynamic resistance.
• Green (SMA #2) - average, the price fights around it.
• Blue (SMA #5) - long -term, still above the price, which means inheritance pressure.
• MacD:
• You can see a slight weakening of the growth moment. If there is no strong demand, it is possible to cut the signal down (inheritance signal).
• RSI (12H):
• fell from the level close to buying (~ 70) to ~ 45–50.
• Neutral, but with a slight tendency to further weakness.
⸻
🧭 Scenarios
1. Bullish:
• Support defense 111,400 USD → Reflection up.
• If $ 118,000 stands out, the next target is USD 124,600.
• Breaking over 125K will negate the inheritance channel and can open the road to 130K+.
2. Bearish:
• Support loss 111,400 USD → test 107,300 USD.
• If the 107K does not stand, a further decrease is possible to 103-105k.

Shriram Finance at Crossroads: Breakout or Breakdown..?
* CMP: ₹633
* Resistance: ₹640 (important barrier)
* Support: ₹630 (trendline + price support)
* Trend: Short-term uptrend
---
🔼 Bullish Scenario
* If price breaks and sustains above ₹640, it may extend the uptrend.
* Upside targets:
* 🎯 ₹648
* 🎯 ₹655
🔽 Bearish Scenario
* If price breaks below the trendline and loses ₹630 support, downside pressure likely.
* Downside targets:
* 🎯 ₹624
* 🎯 ₹620
📌 Conclusion
* As long as ₹630 holds, buyers have control.
* A breakout above ₹640 will strengthen the bullish case.
* A breakdown below ₹630 shifts sentiment bearish, opening room for deeper correction.

GBP/USD - 1H Forecast - YoYo Trade Setups🇬🇧🇺🇸 GBP/USD – 1H Breakdown
Cable’s been wildin’ 🤯 — we smashed into that daily imbalance, tapped supply, and now price is bleeding lower straight into demand.
🔑 What’s Cooking:
Price tagged the Daily IMB + 71% retrace, then dumped.
Now chilling near demand around 1.345 – 1.348 (possible snack stop 🍫).
If bulls defend here → we get a bounce back toward 1.357 – 1.360 supply for a cheeky liquidity grab 🏹.
From there? Expect a heavy distribution dump back toward 1.3350 lows 📉
🎯 Playbook:
Demand bounce → push into 1H / 4H supply.
Reject at supply → sell-off continuation.
🔍 Outlook
Short-term: Relief bounce incoming 🕺
Mid-term: Looking heavy, bears wanna drag this lower.
Bias : Bounce first → then bigger dump 🚀🔪

USD/JPY - Fake Breakout. Is price Distributing💹 USD/JPY – 4H Forecast
Weekly Structure:
Price is still holding strong above demand, with 151.0 acting as the big liquidity magnet.
Daily Structure:
We’ve been stuck in a wide consolidation range between 146.0 support and 150.9 resistance. Market keeps faking both sides, but bulls are slowly regaining control.
4H Structure:
Recent fake breakout/manipulation flushed stops before shifting bullish.
Imbalances (Daily + Weekly) got filled on the push up.
Price is now respecting the bullish structure, eyeing a move higher.
Buy Zone 1 (Preferred): 146.7 – 147.0
Buy Zone 2 (Needs confirmation): 146.1 – 146.2
Upside liquidity target sits around 150.9 – 151.0 BSL.
🔍 Outlook
Short-term: Pullback into demand zones.
Mid-term: Bullish continuation → eyes on 150.9 – 151.0.
Bias : Short-term retrace → Mid-term bullish.

BNB/USD 1D Chart Review UpTrend1. Trend Structure
The price was in a long-term uptrend (marked by the orange lines).
The last breakout occurred at the top of this channel, which is a strong signal of trend continuation.
A breakout from the channel usually means that the market is gaining additional momentum – not only maintaining the current growth rate, but even accelerating it.
2. Breakout Range
The height of the channel (the difference between the lower and upper orange lines) is approximately ~$300–$320.
It is assumed that after breaking out of the channel, the price can cover a distance equal to its height.
This indicates a potential target around:
$1,100–$1,150 (the first key resistance level, aligned with the green zone on the chart).
The next range is as high as $1,280–$1,300 (the upper level marked by the green line).
3. Key Technical Levels
Support (red lines):
USD 899
USD 775
USD 702
These levels are most important for potential corrections.
Resistance (green lines):
USD 1,116 (nearest target after the breakout)
USD 1,280–1,300 (full range of the channel height)
4. Oscillators and Momentum
Stoch RSI (at the bottom of the chart): heavily overbought, which may suggest a short-term correction before further upward movement.
In uptrends, overbought levels do not always lead to large declines – often only to sideways consolidation.
5. Scenarios
Bullish:
Price remains above USD 900, consolidates, and then tests USD 1,116, with a target of USD 1,280–1,300.
Bearish:
If the market fails to maintain the breakout and returns below $900, a return to the middle of the channel to the $775–$800 area is possible.
✅ Summary:
A breakout from the channel to the upside is a very positive signal, and the technical upside range reaches $1,100–$1,300. However, due to the overbought position (Stoch RSI), a correction or short-term consolidation is possible before the price continues towards the full target.

EUR/USD 4H Trade Setup🔎 Bias
Mid-term bullish continuation after corrective pullback into demand.
📊 Technical Breakdown
Weekly/Daily: Structure remains bullish after breaking out of consolidation.
4H : Clear impulsive leg (i-ii-iii) with current correction into the 71% fib retracement.
Demand zone: 1.1730 – 1.1770 aligns with BOS retest + liquidity sweep.
Confluence : Trendline support + untested 4H demand.
🎯 Entry / Exit
Entry zone : 1.1740 – 1.1770 demand
Targets:
TP1: 1.1860
TP2: 1.1960
TP3 (extended): 1.2050+ (wave (v) projection)
Invalidation : Below 1.1685
⚖️ Risk Management
Risk only 1–2% per trade.
Stop loss tucked under 1.1685 demand break.
📌 Outlook
Expecting a corrective dip into demand before continuation higher. If demand holds → strong bullish wave (v) towards 1.20+.
Bias: Pullback → Mid-term bullish 🚀

MORPHO Market Update📊 CRYPTOCAP:MORPHO Market Update
📉 After the recent uptrend, MORPHO could potentially retrace. If the price touches the 🟢 green zone level, it may bounce up again — giving a 🎯 good entry or re-entry opportunity with confirmation, where buyers previously accumulated.

XRPUSD 1D chart review1. Trend and lines
• We had a clear downward trend (orange trend falling line).
• The price broke this line and came out of the top - this is usually a signal of changing the sentiment to a more bullish.
2. Support and resistance
• The next support: approx. 2,93–2.92 USD (Red Zone + SMA).
• Another strong support: approx. USD 2.76 (below, heavily tested earlier).
• The nearest resistance: approx. USD 3.12 (green line).
• Another resistance above: approx. 3,35-3.36 USD - very important, because breaking this level can open the road to $ 3.50 and higher.
3. Medium walking (SMA)
• Red SMA (shorter) slowly turns up.
• Green SMA (longer) is still slightly inheritance, but the price is already lasting.
• This is a positive signal - the beginning of the trend change may suggest.
4. MacD (at the bottom of the chart)
• The blue line (MacD) cut the orange (Signal) from below - this is a buy signal.
• The histogram begins to grow green → Momentum tilts to the bull side.
5. RSI
• RSI is around 55–60, i.e. in the neutral zone, not yet noticed.
• There is a place for further growth before it enters the purchase zone (> 70).
⸻
✅ Summary for you (straight)
• Breaking the inheritance trend, buy signal on MacD, RSI not too high yet.
• Key resistance now: USD 3.12 → If it pierces, the target is USD 3.35.
• Key support: USD 2.92 → If it drops below, possible exit to USD 2.76.
