BTC/USD 1H chart short-term📊 Market structure:
• Current price: ~$113,300
• Trend: A short-term uptrend - evidenced by rising lows and rising highs, as well as price remaining above the black trendline.
• The chart shows Bitcoin testing resistance at $114,089, following a strong breakout earlier.
⸻
🧭 Key Levels:
Resistances (green lines):
1. USD 114,089 – the closest resistance that the price is currently testing.
2. USD 116,057 – another strong resistance, potential target after breakout.
3. USD 118,681 – main resistance level from the higher time frame (H4/D1).
Support (red lines):
1. USD 112,156 – first local support (close to the trend line).
2. USD 109,567 – medium-term support, key to maintaining the growth structure.
3. $107,702 – Strong support where institutional buy orders are likely.
⸻
📈 Trendline:
The black upward trendline leads through the recent local lows.
➡️ As long as the price stays above it, the trend remains bullish.
➡️ Breaking this line down would be the first signal of a weakening trend and a correction towards USD 112,150-111,000.
⸻
⚙️ Stochastic RSI (bottom indicator):
• Currently starting to move down from overbought levels (above 80).
• This indicates a possible short-term downward correction or consolidation.
• If the indicator drops below 40 while keeping the price above the trendline, it may be a good opportunity to go long again.
Support

US 30 UpdateNext move on the way, focus on proper risk management & stay discipline. Wishing you successful trades..!
Key Reason:
1. Market structure was bullish.
2. H1 support area fresh and unmitigated.
3. Hidden OB formation.
4. Wait for retracement and confirmation.
This is not a financial advise take it with your own risk. Let's see how it will work.

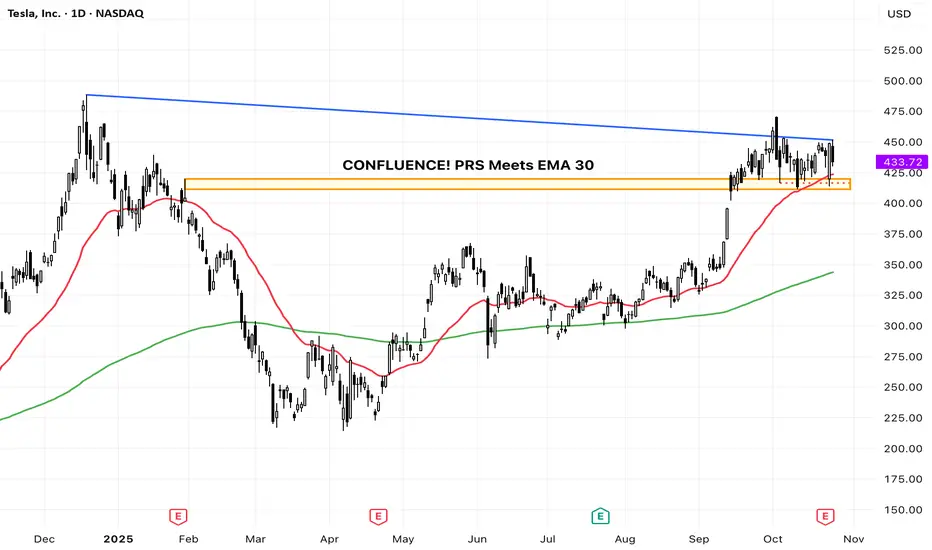
TSLA: Watching Prior Resistance Turn into Key SupportIntroduction & Thesis
Tesla ( NASDAQ:TSLA ) is currently presenting a textbook technical setup on the daily chart. After a strong uptrend from May to October, the price has pulled back to a critical zone that previously acted as heavy resistance in early 2025. This analysis explains why this level is a crucial 'make-or-break' point for the bulls.
The Breakout and The Retest
Observe the orange rectangle (approx. $410 - $425). This region was a significant ceiling for the price action earlier this year. According to technical theory, once a strong resistance level is decisively broken (which occurred in September), it is expected to flip its role and become a crucial support level. This is often referred to as a Prior Resistance Turned Support (PRS) area.
The price is currently pulling back right into this PRS zone, a common and healthy movement known as a retest.
Confluence of Support
Crucially, the 30-day Exponential Moving Average (EMA 30), which defines the short-term trend, is also converging with this key support zone. This creates a powerful confluence of support, significantly increasing the probability of a bounce. The long-term trend, indicated by the upward-sloping 200-day EMA (green line), remains firmly bullish, supporting the overall upward bias.
Scenarios
🎯 Bullish Scenario (The Bounce)
If the $410 - $425 zone holds and we see a strong bullish rejection candle (e.g., a hammer or engulfing pattern), it would confirm the support flip, suggesting the next leg of the rally towards the recent highs around $475.
🛑 Bearish Scenario / Invalidation (The Failure)
Conversely, a sustained daily close below $410 would be a crucial failure signal. This would invalidate the bullish retest thesis and suggest a deeper correction is underway, likely targeting the next major support zone around the 200-day EMA (currently near the $343 region).
📚 Educational Takeaway
This setup perfectly illustrates how traders look for confluence. The strongest support zones are those where multiple technical factors—like a former resistance level (PRS) and a strong moving average (EMA 30)—converge. A successful bounce here reinforces the power of market structure principles.
(Disclaimer: This is for educational purposes only and not financial advice.)
BNB/USDT 1H chart short-term📊 1. Trend structure
• We see an upward channel (black trend lines) - the price rebounds from the lower support line and gradually heads upwards.
• Currently, the rate oscillates in the middle zone of the channel - approx. 1,115 USDT.
• As long as the lower trend line (approx. USDT 1,090) holds, the bullish structure is intact.
⸻
🟩 2. Support and resistance zones
Support:
• 1,106 USDT → local intraday support (already tested several times).
• 1,090 USDT → stronger support + trend line.
• 1,056 USDT and 1,016 USDT → lower zones, in case of a stronger correction.
Resistance:
• 1,125 USDT → local resistance that is currently blocking the upward move.
• 1,148 USDT → another strong resistance, after breaking it, a test of 1,174 USDT (upper border of the channel) is possible.
⸻
📈 3. Indicator – Stochastic RSI
• Currently, the Stoch RSI lines are starting to bounce from bottom to top, after previously entering the oversold zone.
➡️ This is a short-term rebound signal, but not yet a strong buy signal - confirmation of the break through of the ~1,125 USDT level is needed.
⸻
⚙️ 4. Technical scenarios
Bullish:
• Maintaining 1,106–1,090 USDT and breaking above 1,125 USDT → target 1,148 → 1,174 USDT.
• The trend support at 1,090 USDT acts as a buying zone for swing traders.
Bearish:
• A break below 1,090 USDT will negate the channel structure → a possible drop to 1,056 USDT and then 1,016 USDT.
• The RSI will then likely enter a strong oversold zone.

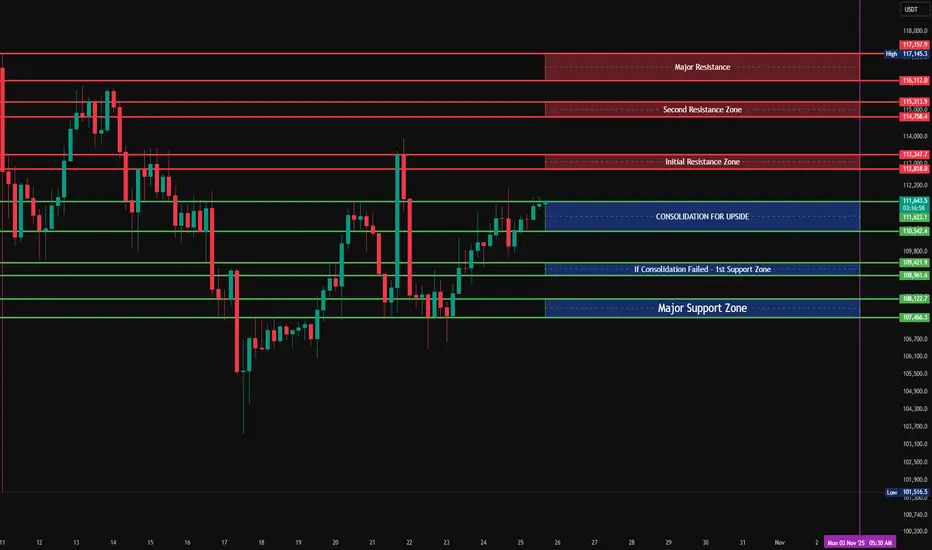
BTC Key Levels in 4H🧭 BTC 4H Market Analysis
BTC remains in a structural equilibrium phase, holding within a tight consolidation pocket ($111,422 – $111,691) as the market attempts to sustain above the midrange base. Price has been building gradually higher lows since the last retest of the Major Support Zone ($107,466 – $108,122), signaling a slow reaccumulation phase within a broader corrective context.
This “Consolidation for Upside” zone marks a pivotal decision area. Sustained acceptance above $111,600 will likely confirm strength continuation toward the Initial Resistance Zone ($112,818 – $113,347), setting the stage for a possible breakout sequence toward the higher resistance layers at $114,758 – $115,313 (Second Resistance) and $116,112 – $117,157 (Major Resistance).
The 4H market tone currently shows balance, with buyers defending dips efficiently but yet to assert full control. For any bullish follow-through, the next few candles will need to establish closing strength above the consolidation ceiling — ideally a clean break and retest confirmation above $111,700.
If price fails to expand upward and instead slips back below $110,524, the short-term tone shifts to neutral, and BTC may drift back into its lower demand range at $109,421 – $108,961 (“If Consolidation Failed – 1st Support Zone”). That’s where buyers are expected to defend again; loss of this zone would expose the deeper Major Support Zone ($107,466 – $108,122), a key structural area that has historically served as a base for directional reversals.
The broader structural context indicates that BTC is compressing within a mid-range pocket, likely preparing for a breakout leg into early November. Given the price compression near the consolidation high, momentum bias leans constructively bullish, provided the upper range holds firm.
📊 Summary:
Current Range: $111,422 – $111,691 (Consolidation for Upside)
Immediate Support: $110,524
If Consolidation Fails – 1st Support Zone: $109,421 – $108,961
Major Support Zone: $107,466 – $108,122
Initial Resistance Zone: $112,818 – $113,347
Second Resistance Zone: $114,758 – $115,313
Major Resistance: $116,112 – $117,157
Market Tone: Balanced / Constructive
Bias: Mildly Bullish while holding above $110,500; range-neutral below $109,400.
XAUUSD Weekly Technical Forecast: Deep Dive AnalysisTraders, gear up for a pivotal week in Gold! As of the close at 4,112.84 on Oct 25th , XAUUSD is at a critical juncture. This analysis blends classic theory with modern indicators for intraday swings and positional trades. Bulls and bears are in a fierce battle ⚔️.
The stage is set for a significant volatility expansion. The key is to identify the dominant auction.
🎯 1D & 4H: The Swing Trade Panorama (Swing Bias)
The higher frames dictate the primary trend. The 1D chart shows a potential completion of an Elliott Wave corrective pattern (ABC) , suggesting a new impulsive wave up may be imminent.
Dow Theory : Higher highs & higher lows remain intact on the 1D, confirming the primary uptrend. ✅
Wyckoff Theory : We appear to be in a 'Spring' or 'Sign of Strength' phase after a re-accumulation period around the 4,080-4,100 zone.
Ichimoku Cloud : Price is trading above the Kumo (cloud) on 1D, a bullish bias. The Tenkan-sen (blue line) is a key dynamic support.
Key S&R : Major support rests at 4,080 (previous resistance, 50 EMA). Resistance is at the recent high of 4,140 .
A decisive 4H close above 4,130 could trigger a Bullish Breakout 🚀 targeting 4,180-4,200. Conversely, a break below 4,080 on high volume could see a drop to 4,040.
⏰ Intraday Focus: 1H, 30M, 15M, 5M (Intraday Bias)
For intraday action, lower timeframes offer precision entries.
Harmonic & Gann Theory : A clear Bullish Bat Pattern has potentially completed on the 1H chart. The PRZ (Potential Reversal Zone) aligns perfectly with the 4,100-4,105 support. Gann's 50% retracement level from the last swing up also converges here.
Bollinger Bands (20,2) : On the 1H/4H, price is hugging the upper band, indicating strong momentum. A squeeze on the 30M chart suggests a volatility expansion is due.
RSI (14) : On the 1H, RSI is in the 55-60 range, showing healthy momentum without being overbought. Watch for bearish divergence on a new high as a reversal signal.
VWAP & EMA Confluence : The 20 and 50 EMAs are providing dynamic support on pullbacks. For day trades, the VWAP on the 15M/5M charts will be your best friend for trend alignment. Long above, short below.
🚦Trade Plan: Entries, Exits & Risk Management
Identifying reversals is key. Use Japanese Candlesticks at key S&R levels. A bullish engulfing or morning star pattern at the 4,100 support, confirmed by a rising volume spike, is a high-probability long signal.
Swing Long Entry : On a 4H close > 4,130, or a pullback to 4,100-4,105 with bullish confirmation.
Swing Short Entry : On a 1D close < 4,080, targeting 4,040.
Intraday Long : Buy on a bounce from VWAP/20 EMA on the 15M chart with RSI > 50.
Intraday Short : Sell on a rejection from the 4,125-4,130 resistance with a bearish RSI divergence.
Stop-Loss : Always 15-20 pips below/above your entry trigger candle.
💡The Bottom Line:
The bullish structure is favored as long as 4,080 holds. The confluence of Harmonic patterns, Wyckoff accumulation, and bullish Ichimoku alignment points to a potential leg higher. However, respect the levels. A break below support will invalidate the bullish thesis.
Track these charts live:
1D:
4H:
1H:
30M:
15M:
5M:
⚠️ Disclaimer: This post is educational content and does not constitute investment advice, financial advice, or trading recommendations. The views expressed here are based on technical analysis and are shared solely for informational purposes. The stock market is subject to risks, including capital loss, and readers should exercise due diligence before investing. We do not take responsibility for decisions made based on this content. Consult a certified financial advisor for personalized guidance.

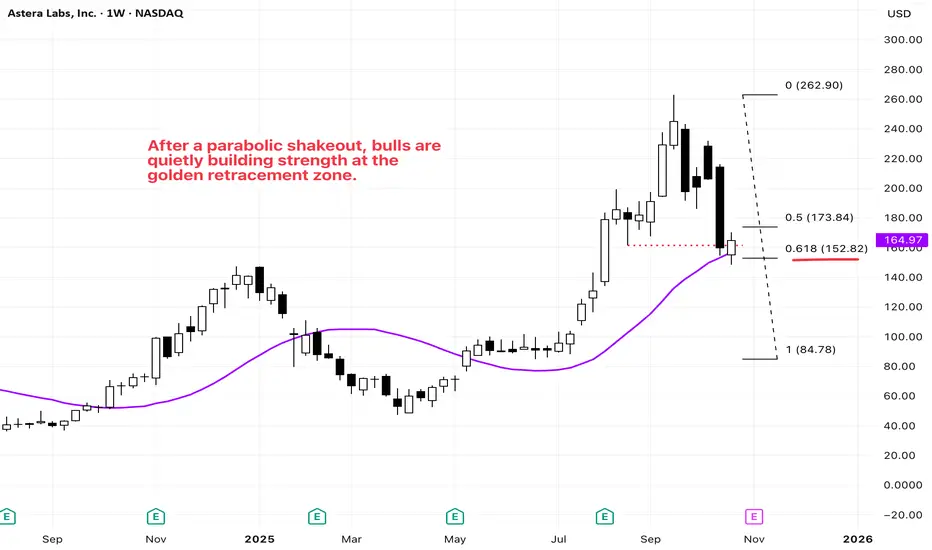
NASDAQ: ALAB — Holding the Golden Zone After a Parabolic DropALAB shows a structure similar to RDDT(see my previous idea) — a newly listed growth stock that gained strong momentum after breaking above its weekly SMA 20 in mid-May.
After reaching an all-time high, the stock started to pull back in late September.
Recently, a sharp parabolic drop drove the price down toward a confluence of supports:
* the previous swing low around $160(red dotted line),
* the weekly SMA 20 (purple),
* and the Fibonacci 0.618 retracement level of the recent rally.
This week’s candle closed bullishly, reclaiming the $160 area and confirming strong demand at this golden zone. The sharp sell-off likely flushed out retail stop orders, providing the base for a potential next leg up.
Overall, this area offers an attractive risk-to-reward setup, with technical supports aligning across multiple timeframes.
PUMPBTC showing signs of reversal_Watch for short term upsidePUMPBTC has touched its bottom and is now showing signs of recovery. A short-term bullish move is likely if momentum continues to build.
Always manage risk wisely and wait for confirmation before entering.

US30: Price fails to break high, sellers step inSPREADEX:DJI – Price Rejects Previous High, Possible Pullback Ahead
🕒 Timeframe: 30-Minute Chart
📊 Data Source: Spreadex
💵 Currency: USD
________________________________________
🧠 Short Summary (SEO Preview)
US30 (Dow Jones) has rejected its previous swing high near 47,100 after a strong bullish recovery. Price action now shows early signs of weakness from the supply zone, suggesting a potential short-term correction before the next directional move.
#US30 #DowJones #WallStreet #PriceAction #SupplyAndDemand #TechnicalAnalysis #TradingViewIdeas
________________________________________
📈 Market Overview
After forming a solid base around 46,250 – 46,300, the Wall Street Index (US30) has staged a strong V-shaped recovery.
However, recent candles show that price was rejected at the previous high around 47,100, indicating that buying momentum may be fading as the market hits a strong supply zone.
________________________________________
🔍 Key Technical Zones
Supply Zone (Resistance):
47,000 – 47,150
This zone aligns with the previous swing high where strong selling pressure emerged.
The rejection from this level signals potential exhaustion of buyers in the short term.
Demand Zone (Support):
46,750 – 46,850
This is a former resistance area turned support. A retest here could trigger a short-term bullish reaction before the market decides its next move.
________________________________________
🎯 Trading Scenarios
Scenario 1 – Rejection from Supply Zone (Main Bias)
1. Price has tested the 47,000 – 47,150 zone and rejected the previous high.
2. If sellers remain in control, a pullback toward 46,750 – 46,850 is likely.
3. A deeper correction could extend toward 46,600 – 46,650 if momentum builds.
Scenario 2 – Breakout Above Supply Zone
1. A confirmed candle close above 47,150 would invalidate the short-term bearish bias.
2. In that case, 47,150 may flip into support, opening room for 47,300 – 47,400 as the next bullish targets.
________________________________________
🧭 Technical Outlook
• The rejection of the previous high at 47,100 confirms a key resistance zone.
• Momentum is slowing, suggesting a likely short-term pullback before any new highs.
• Potential strategy: Wait for bearish confirmation (e.g., rejection candle, lower-high formation) around 47,000 – 47,150 before making any decision.
________________________________________
Disclaimer
This analysis is for educational and technical purposes only — not financial advice.
Always manage risk and follow your own trading plan before taking any trades.
Please like and comment below to support our traders. Your reactions will motivate us to do more analysis in the future 🙏✨
Harry Andrew @ ZuperView

BTC/USDT Short-Term 4H Review Chart🧩 Market Structure
After a strong decline, the price has rebounded, creating a local uptrend (marked with the orange trend line).
The price has currently broken through the uptrend from below, which is the first sign of bullish weakening.
The current candle is testing this line from below—a classic trendline retracement (potential pullback).
📉 Support and Resistance Levels
From the chart:
Resistance (green lines):
113.868 USDT — key high.
111.240 USDT — strong resistance (previous local high).
109.133 USDT — currently being tested from below (confluence with the trendline).
Support (red lines):
107.524 USDT — first support.
105.253 USDT — lower support, a boundary for maintaining the higher low structure.
103,582 USDT — key support, below which the upward structure will be negated.
🔍 Volume
Increasing volume is visible on the red candles — selling dominated the trend breakout.
The last green candle has a large lower wick and slightly higher volume — a signal of a possible defensive reaction from the bulls, but without confirmation of continuation.
📊 Stochastic RSI (oscillator)
Located in the oversold zone (around 20).
The %K line is starting to curve slightly upward — it could signal a short-term rebound, but until there's a crossover and confirmation, this is only an early signal.
📈 Scenarios
✅ Bullish:
If BTC rebounds and closes the candle above 109,100 USDT, it will be a false breakout of the trend and a possible upward move towards 111,200–113,800 USDT.
Support to be maintained: 107,500 USDT.
❌ Bearish:
If the price remains below the trendline and 109,000 USDT, and then breaks above 107,500 USDT, the path opens to:
105,200 USDT, and then
103,500 USDT (strong support and potential buy zone).
⚙️ Summary
Short-term trend: neutral → slightly downward (after the trendline breakout).
Key level to watch: 109,100 USDT (retest trendline).
Potential support: 107,500 → 105,200 → 103,500.
Momentum (Stoch RSI): A bullish rebound is possible, but confirmation is lacking.

TradeCityPro Academy | Support & Resistance Part 2👋 Welcome to TradeCityPro Channel
🎓 Educational Section Technical Analysis Training Series
Welcome to the Educational Content Section of our channel!
Here, we aim to teach you technical analysis from A to Z through structured playlists.
We’ll cover everything from risk and capital management, Dow Theory, support and resistance, trends, and market cycles, to more advanced concepts.
Our lessons are based on both real market experience and The Handbook of Technical Analysis.
🎨 What is Technical Analysis?
Technical Analysis (TA) is a method used to forecast price movements in financial markets by analyzing historical data, especially price and volume.
It’s based on the idea that history tends to repeat itself, and that recurring patterns can reveal profitable trading opportunities.
📚 Complete Guide to Support and Resistance in Technical Analysis
🧩 Introduction
In technical analysis, two key concepts form the foundation of nearly every trading strategy: Support and Resistance.
These levels represent areas on the chart where the price is likely to change direction, as buyers or sellers regain control.
But to truly understand them, you must go beyond the chart — because their origin lies in human psychology and collective behavior.
🟢 What Is Support?
A support level is an area where buying pressure increases and prevents the price from falling further.
It acts like a floor where buyers believe the asset has become cheap enough to buy.
As a result, the market tends to bounce upward from that area.
For example, if Bitcoin has repeatedly reversed near $55,000, that zone is considered a support level.
🔴 What Is Resistance?
A resistance level is an area where selling pressure increases and stops the price from rising higher.
When the price approaches this level, traders often feel the asset is “too expensive” and start selling.
For example, if Ethereum has failed multiple times to break above $3,800, that area is considered resistance.
💭 Why Do Support and Resistance Form?
Markets are not just numbers — they’re the reflection of human emotion and crowd behavior.
When large groups of traders make similar decisions (to buy or sell) around the same price zone, it creates a psychological memory in the market.
If price has reacted there before, traders remember it — and react the same way next time.
This repetition forms the backbone of how support and resistance levels develop and strengthen over time.
🧠 The Role of Emotion and Crowd Psychology
Emotions drive markets.
When prices rise quickly, people experience FOMO (Fear of Missing Out) and rush to buy — until demand runs out and price reverses (resistance).
When prices fall, fear of losing money triggers panic selling — until sellers dry up and price rebounds (support).
This constant emotional cycle repeats endlessly, creating recurring support and resistance zones on every chart.
⚙️ The Structure Behind the Levels
From a technical perspective, these levels form because large clusters of orders are placed around them.
Traders typically set buy orders below the current price (near support) and sell orders above it (near resistance).
So when the market reaches those areas, there’s a strong battle between buyers and sellers.
That’s why these zones are not just psychological — they’re also built into the order flow and liquidity structure of the market.
📈 Reactions and Breakouts
When price approaches a key level, two outcomes are possible: Reaction or Breakout.
In a reaction, price touches the level and reverses — meaning buyers or sellers defend it successfully.
In a breakout, price pushes through with strong momentum and high volume, breaking the market’s previous belief.
After a breakout, the level often changes its role:
A broken resistance becomes new support.
A broken support becomes new resistance.
This behavior is known as Role Reversal, one of the most powerful principles in chart analysis.
⚖️ The Professional Mindset
Support and resistance are zones, not exact numbers.
The market may slightly move above or below them before reacting — this is known as a fake breakout.
Professional traders look for confirmation such as reversal candles, volume spikes, or RSI divergences before acting.
The key is not to memorize lines but to read crowd behavior.
Once you understand why people buy or sell at certain points, you gain a true edge over the average trader.
🧩 Conclusion
Support and resistance are not just lines on a chart; they are the visible footprints of fear, greed, and collective memory in the market.
By understanding their psychological and structural roots, you can identify better entry and exit zones,
predict reactions more accurately, and avoid emotional mistakes.
Learn to read the emotions behind the candles — because at its core, the market is simply a crowd of human minds trying to win.

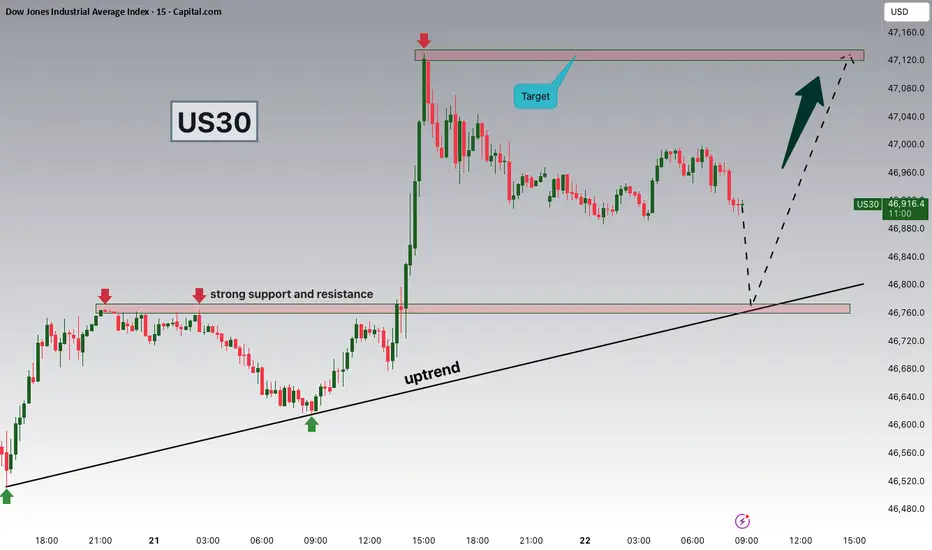
Dow Jones Testing 46,760 – Bounce or Breakdown Ahead?Hey Traders, in today’s trading session we’re closely monitoring US30 for a buying opportunity around the 46,760 zone. The Dow Jones remains in a broader uptrend and is currently undergoing a correction phase, approaching a key support and resistance confluence at 46,760.
Market Structure:
The index continues to print higher highs and higher lows, confirming bullish market structure. The current retracement could offer a potential continuation setup if buyers regain control near this level.
Key Level:
46,760 — an important technical zone where trendline support meets horizontal structure, providing a potential reaction point for bulls.
Outlook:
If buying pressure emerges from this area, a move toward 47,400–47,600 could be on the table in the coming sessions.
💬 What’s your take on US30 here?
Do you see a bounce from support or a deeper pullback coming? Share your view in the comments!
Trade safe,
Joe.
EUR/GBP - Outlook🔥 EUR/GBP – Outlook (Weekly / Daily / 8H) 🔥
Alright, traders — this one’s simmering inside a tight squeeze before the next big move! Let’s break it down 🧩
🧠 Weekly View
Price is sitting inside a weekly demand zone after rejecting the upper supply area near 0.8750 – 0.8780 (BSL zone). The structure’s still lower-high based, suggesting bearish intent if the range floor gives way.
Major resistance: 0.8750 – 0.8780
Major support: 0.8600 – 0.8630
A clear weekly close below that support = door open toward 0.8500 → 0.8350 (next weekly demand).
📅 Daily View
The daily chart shows price consolidation within weekly demand — a contracting triangle pattern right under major resistance. That’s a classic “coiled spring” setup.
Bulls need a clean breakout above 0.8700 to flip bias short-term.
Bears are eyeing a break and retest of 0.8650 → 0.8600 to confirm downside momentum.
Momentum indicators (EMA compression) hint the bears might grab control soon.
⏱ 8H View
The 8H triangle’s getting tight — every test of the descending trendline keeps rejecting. Liquidity likely builds above the highs before a potential sweep + dump toward the weekly zone.
If we sweep 0.8700 and fail to hold, look for short entries toward 0.8550 (Target 1)
If momentum accelerates, extension to 0.8350 (Target 2) could follow — that’s the deeper liquidity pocket.
⚖️ Bias & Plan
HTF supports bearish price action, although the short-term is still ranging — HTF will take control soon.
📉 Bias: Bearish-to-neutral
🎯 Targets: 0.8550 → 0.8350
📈 Invalidation: Daily close above 0.8750
🧩 Summary
Market’s compressing between key zones — expect a breakout soon.
Watch for a liquidity sweep above 0.8700, then potential drop toward 0.8500 zones.
Bears remain in charge unless price cleanly flips the daily resistance structure.

BNB/USDT 1D chart review📊 1️⃣ General context
• BNB price is approximately USDT 1,100, after correction approximately -0.85%.
• It is clear that the market is in a corrective phase after a strong increase - recent highs reached ~1,340 USDT.
• Currently, the rate is balancing between support ~1069 USDT and resistance ~1149 USDT.
⸻
🟢 2️⃣ Supports and resistances (key levels)
• Closest support:
🔸 1069 USDT (short term, red line)
🔸 985 USDT – stronger support (previously tested, below EMA 50)
🔸 884 USDT – strong long-term support (potential correction low)
• Resistances:
🔹 1149 USDT – first level to break
🔹 1226 USDT – important daily resistance
🔹 1344 USDT – main peak, border of the previous impulse
⸻
📈 3️⃣ Moving Averages (SMA/EMA 50/200)
• We see the yellow EMA 50 line and the green SMA 200 line crossed (EMA Cross 50/200).
👉 This is a golden cross - a medium-term growth signal.
• Currently, however, the price has fallen below EMA 50, which means supply pressure in the short term.
• As long as it stays above the 200 SMA (~1060-1070), the macro trend remains bullish.
⸻
📉 4️⃣ MACD
• The histogram is red and decreasing - this confirms that the downward momentum continues but may be weakening.
• The MACD line (blue) is approaching the signal line (orange), which may indicate an impending bounce.
⸻
🪫 5️⃣ RSI
• RSI is around 40-45, which is close to the oversold zone.
• This suggests that sellers may be losing strength and a technical rebound may occur soon.

Ethereum Setup: Watching for a Breakout Above the ChannelTime to take another look at Ethereum (ETHUSD). The crypto has spent the past couple of months correcting off its all-time high, with a drop to multi-month lows just a few weeks back. That said, ETH held strong support in the $3,300–$3,400 zone, which continues to act as a solid base.
Now we’re back trading in the $4,000–$4,200 area, which remains near-term resistance. The more ETH tests this zone, the more likely we are to see a breakout. Despite the recent pattern of lower highs and lower lows, bulls are defending the August 3rd low at $3,355—a level we consider pivotal going forward.
From a technical perspective, Ethereum is forming a descending price channel, which typically acts as a continuation pattern. A confirmed breakout above the upper trendline could trigger momentum toward the $5,700–$5,800 zone. A close above that trendline would be the signal to watch.

EUR/USD - Outlook (LTF ranging market)🔥 EUR/USD Outlook Breakdown 🔥
Let’s decode this clean structure — multi-time-frame style with a punch of trader slang 👇
🧭 Weekly Timeframe
We’re chilling just under a long-term bearish resistance trend, and the last few weeks show clear compression beneath that line.
The weekly breakout candle couldn’t sustain upside, hinting sellers are still lurking.
Price holds under 1.1800, keeping HTF (higher-time-frame) structure bearish.
➡️ Eyes on the 1.1500–1.1450 zone as next liquidity grab if momentum kicks in.
📆 Daily Timeframe
Daily shows a ranging market between 1.1750 resistance and 1.1550 support.
We saw a BOS earlier in the structure, but bulls couldn’t follow through.
Multiple rejections from the supply block confirm short-term hesitation.
The support trendline is hanging on — but if it snaps, expect the cascade to begin.
Targets line up clean:
🎯 Target 1: 1.1400
🎯 Target 2: 1.1150
🎯 Target 3: 1.1000
⏰ 8H Timeframe
On the 8H, we’re playing ping-pong inside that same range.
Price grabbed the BSL (Buy-side Liquidity) up top and retraced to the mid-range demand.
Both BH zones are acting as intraday traps — classic indecision setup.
Until we break out clean, expect chop.
➡️ However… here’s the key line:
“HTF supports bearish price action although STF is currently ranging giving unclear direction. HTF will take control.”
That means we’re likely setting up for a fake bullish pop before a strong bearish drive, once HTF order flow dominates.
🎯 Trade Idea
Bias : Bearish (waiting for HTF dominance)
Setup : Sell the fake-out above range highs or on break & retest of 1.1550 support
Targets : 1.1400 → 1.1150 → 1.1000
Invalidation : Daily close above 1.1750
Gameplan : Stay patient — HTF flow will win.
⚡ Summary
EUR/USD is stuck in a rangey mess, but the bigger picture screams bearish.
When HTF takes back control, expect a breakdown toward 1.1400+ zones.
Shorts will be the move once that range floor cracks.

USD/CHF - Outlook Breakdown🔥 USD/CHF Outlook Breakdown 🔥
Let’s unpack this setup across the timeframes — clean and simple trader talk 👇
🧭 Wee kly Timeframe
Price is squeezing tight within a descending channel, holding under that key 0.8050–0.8100 supply zone.
We’ve seen multiple rejections there, confirming strong seller control.
Structure-wise, it’s still bearish — last week’s BOS (Break of Structure) sealed the lower bias.
➡️ Expect continuation lower unless we see a weekly candle close above 0.8050.
📆 Daily Timeframe
Price had a reaction from the second wave of supply, tapping into the daily zone around 0.8050 before rejecting.
The move broke minor daily structure to the downside, confirming bearish order flow.
We’re now hovering near a support shelf ~0.7920, but the context still favors shorts while below that daily zone.
➡️ Next clean liquidity pocket sits near 0.7820–0.7850.
⏰ 8H Timeframe
Here’s where the detail shines.
We’ve got a nice 5-wave internal structure forming:
(1) BOS confirming shift to bearish flow
(2) Pullback into 8H BH zone (premium area)
(3) Sweep of local SSL (liquidity grab)
(4) Retest of 71% fib zone (perfect premium fill)
(5) Targeting external HTF SSL (around 0.7820)
Currently retesting that mini 8H supply (0.7940–0.7960).
If it holds — 💣 expect the drop to continue towards 0.7820.
🎯 Trade Idea
Bias: Bearish
Sell Zone: 0.7940–0.7960 (retest of 8H supply / 71% fib)
Targets : 0.7850 → 0.7820
Invalidation: 0.8000 (clean break & close above)
Bonus Tip: Watch for a lower-TF liquidity sweep before short entries for cleaner confirmation.
⚠️ Summary
USD/CHF still sits in a tight bearish squeeze under strong higher-timeframe supply.
Until bulls reclaim 0.8050, the path of least resistance = downside.
Next major magnet: 0.7820 liquidity pool.

AUDUSD - Buy the dip at daily support!AUDUSD is still traveling inside a broader descending channel, but on the H1 we’ve carved a tight range/contracting structure.
Price is now approaching a daily support zone that aligns with the channel’s lower boundary and a local rising base—strong confluence for a bounce.
I’ll look for longs from the green support area after a clear H1 bullish reaction (wick rejections, bullish engulfing, or break–retest of the intraday lower-high line). If triggered, I’ll trail into the range highs first, then the upper orange boundary.
All Strategies Are Good; If Managed Properly!
~Richard Nasr.

Simple XAUUSD Strategy That Just Made 100 Pips!Gold played out beautifully today with a clear 100-pip move to the downside. After testing resistance near 4240, price showed rejection with strong bearish candles, confirming exhaustion from buyers and giving a clear sell signal.
The structure shifted from higher lows to lower highs, signaling the start of a short-term correction. Once price broke below the intraday support zone, momentum carried it smoothly down toward 4145 — completing a perfect swing move.
No complex indicators were needed. Just clean market structure, rejection candle confirmation, and patience for entry. The dollar strength added extra pressure on gold, aligning with the technical view.
Key takeaway: follow structure, not emotion. A simple rejection and structure break can deliver more than any over-complicated setup. Consistency comes from clarity.
Trade closed around 4145 with a solid 100-pip gain. Now watching the 4140–4130 zone for possible reaction or bounce setup before the next move.
#XAUUSD #Gold #PriceAction #Breakout #SmartMoney #TechnicalAnalysis #DayTrading #Scalping #TradingView

BTC/USD 4H chart reviewBitcoin is currently trading around $109,000, a rebound after falling. An attempt to break the short-term downtrend is visible (yellow SMA line 1).
The previous lows were around USD 104,500 - 105,000, and the current candle is trying to break the local resistance around USD 109,000 - 110,000.
⸻
📊 2. Moving Averages (SMA / EMA)
You have several averages on the chart:
• The yellow line (SMA #1) – the short-term average, currently slightly sloping downwards, but the price is just breaking it from below – is the first sign of a change in momentum.
• Red line (EMA Cross 50/200) – it looks like the 50 EMA is below the 200 EMA, confirming the downtrend in the broader picture.
• Blue and green zones (EMA/SMA of higher intervals) – show strong resistance zones:
• $112,592
• $115,674
→ These are targets for a potential upside rally if the 109k breakout holds.
⸻
💹 3. MACD
• The MACD line crossed the signal line from below → it is a buy signal (bullish crossover).
• The histogram increases above zero, which confirms the upward momentum.
➡️ MACD confirms that the upward correction continues, but we do not have a full upward trend yet.
⸻
📈 4. RSI
• RSI is around 55-60, i.e. neutral and upward.
• It was previously in the oversold zone (around 30), so the current rebound is a healthy reaction.
➡️ No overbought yet, so there is room for further upward movement.
⸻
🧱 5. Key technical levels.
Level
Support 1
$106,550
local support after rebound
Support 2
$104,550
strong bottom from the previous move
Support 3
$101,700
the last bastion of buyers
Resistance 1
$109,000-$110,000
currently tested level
Resistance 2
$112,600
another growth target
Resistance 3
$115,700
EMA200 key barrier – trend change if it breaks

BTCUSD 1D Chart • Trend: clear decline in the descending channel (yellow lines).
• EMA 50/200: during a bearish cross (death cross) - medium-term bearish signal.
• SMA 50 / 100 / 200: price below all key averages - a classic signal of market weakness.
⸻
📉 1. Trend indicators
🔹 EMA Cross 50/200 (blue)
• The price has fallen below EMA 200, which means that the medium-term trend is currently negative.
• In addition, the EMA 50 breaks the EMA 200 from above - a sell signal.
🔹 Descending Channel (Yellow)
• The price is close to the lower band of the channel, which may result in a short-term technical rebound, but the main trend remains down.
• Upper channel line (resistance): approximately USD 114,000-115,000
• Bottom Line (Support): ~$101,000
📊 3. Momentum indicators
🔸RSI
• RSI ≈ 37 → close to oversold zone, but not extreme yet.
• Signal: Possible short bounce if it stays above the 30 level.
🔸 MACD
• The MACD line is below the signal line and the negative histogram is growing → the downward momentum continues.
• No signs of reversal yet.
⸻
🔥 4. What does this mean in practice
🔻 Short-term (1-7 days):
• Downward trend with a possible technical rebound in the area of USD 104,000-101,000.
• RSI close to oversold → possible pullback to USD 109,000–110,000.
⚖️ Medium term (2-4 weeks):
• Until BTC returns above EMA 200 (approx. 115,000), the market remains in a correction/distribution phase.
• If the price breaks 101,000 down, a possible decline to 96,900 or even USD 92,000 (previous macro support).
⸻
📈 5. Scenarios
✅ Bullish (less likely now)
• Maintaining above $104,000
• Breakout 109,000 → USD 112,000 → test 115,000
• Breakout of EMA 200 → trend reversal signal
❌ Bearish (more likely)
• 104,000 raise → $101,000 test
• If the support breaks, a decline to 96,900-97,000 is possible within a few days.

META – Bearish Drift Toward Support | Potential Bounce SetupNASDAQ:META is still looking a touch bearish and may continue sliding toward its 200-day moving average. The price action suggests we’re not done with downside pressure just yet, especially as tech sentiment remains shaky. However, there’s a potential opportunity shaping up around a key support zone.
📌 Trade Setup
Looking for a bounce between $660 – $680, which has acted as a demand zone previously. This area also aligns with the 200-day MA, giving the level technical significance. If buyers step in here, we could see a short-term rally.
🎯 Targets & Risk Management
Entry Zone: $660 – $680
Take Profit: $725, $749
Stop Loss: Close below $659
Watching price action closely at the support zone—patience is key. A clean bounce with volume could trigger the next leg up.

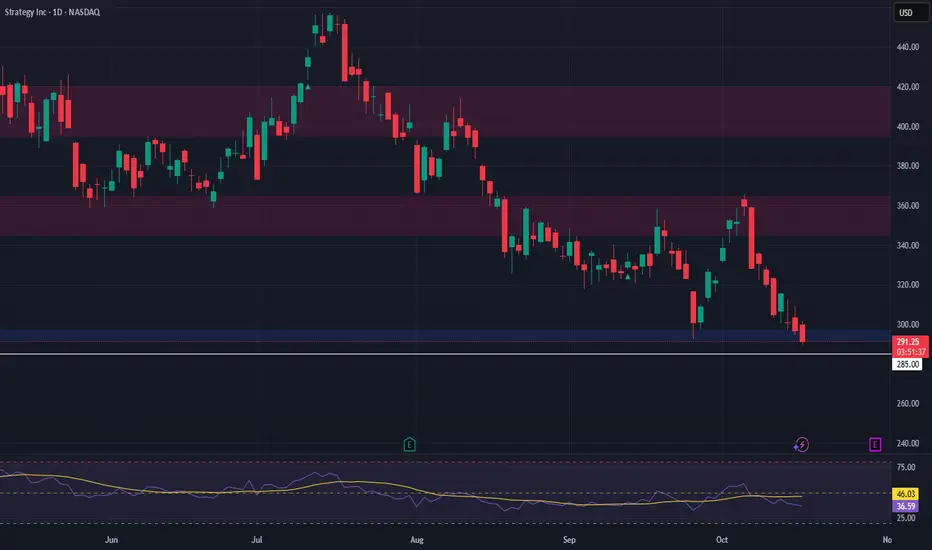
MSTR- Double Bottom Forming at Key Support–Bullish Setup in PlayPrice is once again testing a major support zone ($292–$297), where it is also forming a double bottom pattern — a strong technical reversal signal. This confluence of structure and pattern typically suggests that bulls may soon regain control, setting the stage for a potential move higher.
💡 Trade Idea: Long Spot Entry
Entry Zone: $292–$297
Take Profit Levels:
TP1: $345–$365
TP2: $395–$420
Stop Loss: Just below $285