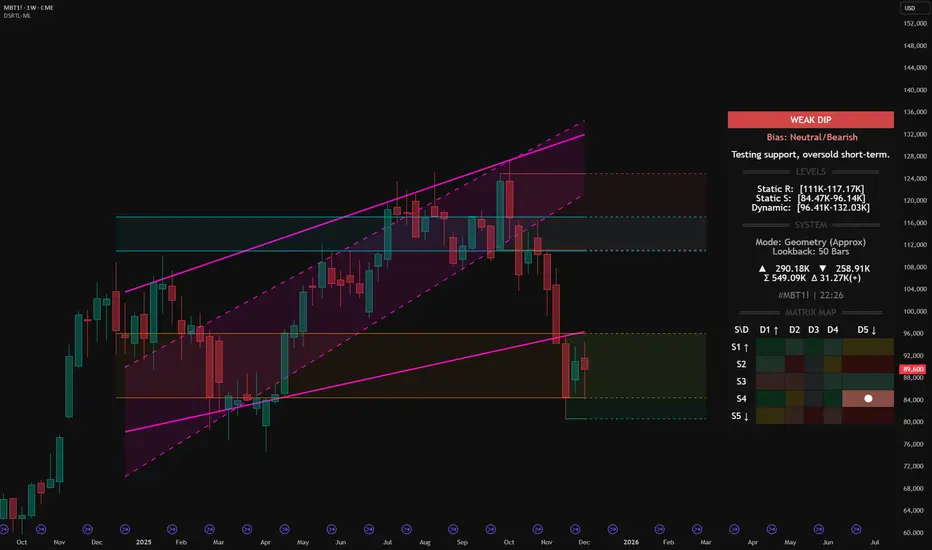
Micro Bitcoin Futures (MBT1!) – DSRTL‑ML Weak Dip at supportMicro Bitcoin Futures (MBT1!) – DSRTL‑ML Weak Dip at S4–D5 Support
We are analyzing the weekly structure of Micro Bitcoin Futures (MBT1!) using the institutional DSRTL‑ML support/resistance engine. On this bar the indicator classifies the state as WEAK DIP with a Neutral/Bearish bias and the system message:
Testing support, oversold short-term.
This reading comes from the current matrix position S4–D5 on the Matrix Map and defines the context for the price action inside this support zone.
1. DSRTL Matrix Diagnosis – State S4–D5
S4 – Static Support in Control
Price is trading inside the DSRTL Static Support band:
Static S: 84.47K – 96.14K
In the logic of DSRTL‑ML, this green support zone marks a historical high‑volume demand node where passive buy liquidity has previously absorbed aggressive selling. It behaves as a structural floor rather than a neutral price area.
D5 – Overshoot Below the Dynamic Channel
At the same time, price is positioned below the 5‑Point Dynamic Channel:
Dynamic Band: 96.41K – 132.03K
State D5 describes a downside extension beneath the lower boundary of the dynamic channel. Within this framework, that move is read as an oversold displacement away from the equilibrium path of the trend geometry, not as a fully confirmed new downtrend on its own.
Combined Reading – WEAK DIP with Neutral/Bearish Bias
The overlap of:
price sitting inside Static Support S4, and
price being oversold relative to the Dynamic Channel (D5)
produces the WEAK DIP classification. The Neutral/Bearish bias tells us that the dominant leg into this area is still downward, but the current candle represents a weaker phase of that dip occurring directly into a pre‑defined demand floor.
2. Key DSRTL Levels on This Chart
From the Levels and System panels on the chart:
Static Resistance (Supply Block): 111K – 117.17K
Upper structural ceiling derived from the DSRTL matrix of historical volume and price interaction.
Static Support (Demand Block): 84.47K – 96.14K
The active S4 floor where the current weekly bar is developing.
Dynamic Channel (Trend Geometry): 96.41K – 132.03K
The 5‑Point trend channel that defines the dynamic path of price; its lower edge around 96.41K is the first mean‑reversion checkpoint above the market.
Volume Metrics on This Bar:
Buying volume (▲): 290.18K
Selling volume (▼): 258.91K
Total volume (Σ): 549.09K
Delta volume (Δ): +31.27K
The positive delta together with the WEAK DIP label supports the idea that, inside S4, aggressive selling is meeting responsive buying rather than progressing as a fresh impulsive breakdown.
3. My Structural View Based on DSRTL‑ML
From a structural perspective, I read this configuration as follows:
Context of the Trend
The Neutral/Bearish bias confirms that the larger move into this zone is still a downward leg. The market is not flagged by DSRTL‑ML as a confirmed bullish reversal; instead, we are in a weak phase of the decline, pressing into defined support while the geometry is stretched.
Support Floor and Invalidation
As long as weekly closes remain above roughly 84.5K – the lower boundary of the S4 block – I consider this area a working demand floor for the current sequence. A decisive weekly close below that level would invalidate the weak‑dip narrative and shift the focus to a more developed breakdown of support.
Primary Path While S4 Holds
If S4 continues to hold, my expectation is that the oversold S4–D5 state will tend to resolve through mean reversion back toward the lower edge of the Dynamic Channel around 96.41K. In DSRTL terms, that is the first structural magnet above price once an overshoot has occurred.
Next Reference Above the Channel
Should price manage to re‑enter and hold inside the Dynamic Channel, the next major reference becomes the Static Resistance block at 111K – 117.17K. In my view, that zone represents the upper boundary of the current weekly structure and the area where I would expect supply and volatility to increase again.
In short, DSRTL‑ML currently maps MBT1! as a weak dip into S4 support with a still‑bearish background trend. My directional view is that, while this support holds, the structure favors a corrective mean‑reversion phase toward the dynamic band rather than an immediate continuation breakdown, with any weekly close below the S4 floor acting as a clear structural invalidation.
Indicator used for this analysis: DSRTL‑ML (Dynamic Support & Resistance Trend Logic).
Disclaimer: This publication expresses my personal opinion on the MBT1! chart based solely on the DSRTL‑ML indicator and standard price/volume analysis. It is not financial or investment advice and does not constitute a recommendation to buy or sell any instrument.
Support_and_resistance
XAUUSD Intraday Plan – Recovery Attempt or More Downside?Gold is attempting to recover after Friday’s drop, currently trading around 4213. Price is being supported by the MA200, while the MA50 is flattening, signaling reduced momentum for now.
The immediate resistance sits at 4219 — a confirmed break and hold above this level would open the path toward 4251.
If price fails to clear the 4219 resistance, a full retest of the First Reaction Zone becomes likely. If that zone fails to hold, we could see price slide deeper toward the Support Zone, where buyers may attempt to step back in.
📌Key levels watch:
Resistance:
4219
4251
4285
Support:
4185
4144
4102
🔎Fundamental focus:
This week the spotlight is firmly on the FOMC meeting, projections, and Powell’s statement. Until the FOMC is out, markets may remain choppy and directional follow-through could be limited. Manage risk carefully — spreads and volatility tend to expand significantly around these releases.

XAUUSD Intraday Plan|Will Buyers Defend the Reaction Zone?Gold once again failed to reclaim the 4232 resistance yesterday.
Price tested the level but reversed sharply as sellers stepped in. We now have another test of the Reaction Zone, and price is also trending below the MA50, with the MA200 likely to be tested next.
The 4232 resistance remains the key level buyers must reclaim to attempt another push higher.
On the downside, if the MA200 and the First Reaction Zone fail to hold, watch the Support Zone. If selling pressure continues, the HTF Support Zone becomes the next area where buyers may show a stronger reaction.
📌Key levels to watch:
Resistance:
4232
4274
4322
Support:
4185
4141
4102
4049
4014
3966
🔎Fundamental focus:
High-impact news on the calendar today — expect volatility. Manage risk accordingly.

XAU/USD Intraday Plan| Pullback in Play Below 4232Gold is pulling back below 4232 after failing to reclaim the 4274 resistance yesterday. Price is currently trading around 4212 and has also closed below the MA50, signalling a slowdown in bullish momentum.
Market structure has turned temporarily bearish, and for buyers to regain control we need a clean break above 4232 to reopen the path toward 4274, and if momentum is strong, 4322 next.
If selling pressure persists, price is likely to retest the First Reaction Zone(4185-4141), which aligns with the MA200 — adding confluence as dynamic support. A clean break below this area would open the door for a deeper pullback into the Support Level (4102-4049) and ultimately the HTF Support Zone(4014-3966), where buyers may look for a stronger bullish reaction.
📌Key levels to watch:
Resistance:
4232
4274
4322
Support:
4185
4141
4102
4049
4014
3966
🔎Fundamental Focus:
No high- or medium-impact data scheduled today, so price may move more on sentiment and headlines. Later in the week we have several important U.S. releases that could drive volatility. Geopolitical developments also remain a factor to watch.

XAU/USD Intraday Plan | Gold Stuck Between 4142–4167Yesterday we saw a break above the 4142 level, but gold failed to extend higher, resulting in a ranging move between 4142 and 4167. Buyers now need to clear the 4167 minor resistance to push toward 4198.
If price can’t hold and slips back below 4142, we could see a retest of the consolidation range. Continued selling pressure would then shift focus toward the Support Zone.
📌Key levels to watch:
Resistance:
4167
4198
4232
Support:
4142
4098
4052
4016
3968
🔎Fundamental focus:
Today is a U.S. bank holiday, which means trading volume is thinner than usual. Lower liquidity can lead to exaggerated intraday moves, sharper spikes, and occasionally wider spreads, so caution is advised.

XAU/USD Plot Twist?XAU/USD: From 4106.7 to 4200 – The Comeback Tour (Featuring a Quick Dip at 4060.3)
Trade Idea Explanation:
Current Situation:
Price has successfully broken above the previous resistance at 4106.7, confirming bullish momentum.
Expected Move:
A pullback toward 4060.3 is anticipated before resuming the upward trend. This level aligns with potential support from the breakout structure.
Bullish Target:
After the pullback, the next upside target is 4200, which represents the projected extension of the bullish move.
Alternative Scenario:
If price breaks the current resistance at 4152.0, it could extend higher toward 4195 (first short entry) and 4220 (second short entry), where sellers may step in and initiate a reversal.
Enjoyed this? Show some love with a LIKE and share your thoughts in the COMMENTS! 💬
Disclaimer
My trading strategy isn’t a signal — it’s more like therapy for my brain. I’m just here crying over candlesticks while pretending it’s ‘learning market structure.’ Sharpening my skills? Sure. Building my trade journal? Absolutely. But deep down, it’s just me whispering to the charts: ‘Please love me back

XAU/USD Intraday Plan | Gold Breaks Out — Can Buyers Hold?Gold broke out of the consolidation range yesterday, finally pushing above the 4098 level and extending into the 4142 resistance zone.
Price is now sitting above both the MA50 and MA200 — a constructive sign — but both moving averages remain flat, showing that momentum has not fully shifted yet.
If buyers want to build on this breakout, they need a clean hold above 4142. A confirmed break here would open the path toward 4198 → 4232.
If gold fails to clear 4142, we could see a pullback. First support sits at 4098, followed by 4052.
A deeper correction would bring us back into the Support Zone (4016–3968), with the HTF Support Zone (3921–3862) acting as the major safety net.
📌Key levels to watch:
Resistance:
4142
4198
4232
Support:
4098
4052
4016
3968
3921
3862
📰 Fundamental Focus:
Today brings the first batch of high-impact U.S. data for the week, including Core PPI, PPI, and Retail Sales — all key indicators of inflation and consumer strength. Traders should be prepared for sharper moves as the market reacts to inflation and consumer-spending data.

BTC Update: The Rollercoaster EditionAttention all chart warriors, candlestick whisperers, and Fibonacci fanatics!
If you're reading this trade plan, congratulations — you've officially entered the realm of market prophecy
🚀 BTC Update: The Rollercoaster Edition 🎢
What’s New?
Bitcoin is chilling around $86K, like that friend who says “I’m fine” after a breakup but keeps posting cryptic stories.
Upper Trendline:
Sitting pretty near $90,774 – that’s the “VIP section” where bulls want to party. Break above it, and we’re talking $97K–$104K dreams.
Lower Trendline (Breakout Zone):
Guarded at $85,500. If BTC slips below this, next stop could be $80K – aka the “budget seats.”
Price Action:
Currently stuck in a descending channel, but RSI is whispering, “Hey, maybe we’re oversold.” MACD is like that friend who says, “I think things are turning around.”
Target:
If BTC breaks the upper trendline, $97K–$104K is the next dance floor. If not… well, let’s just say $80K might be the couch we crash on.
Fun Fact:
Bitcoin’s November mood? Extreme Fear. Basically, the market is acting like someone saw a spider in the bathroom.
Good luck, everyone! And hey, don’t forget to smash that like button and drop your wildest market predictions in the comments! ❤️
Disclaimer: My trading strategy isn’t a signal—it’s more like a workout for my brain. I’m just here flexing my market structure knowledge and sharpening my trading skills while building my trade journal. Think of it as financial gym time—no personal trainers, just candlesticks!

GBP/USD: The “Breakout or Bust”What’s Happening?
Price has been sliding down like a kid on a playground slide since early November. Now it’s chilling near 1.311, looking at that trendline like, “Should I climb back up or just nap here?”
Pair: GBP/USD
Timeframe: 4H
Type: Long (Buy Setup)
Key Elements in the Chart
Downtrend Line:
A descending trendline from previous highs is drawn, showing the overall bearish structure.
Price is approaching this trendline, suggesting a potential breakout scenario.
Support Zone:
Around 1.30869 – 1.30008, marked in red.
This is the area where buyers are expected to defend, and the trade idea assumes price will hold above this zone.
Resistance Zone:
Nar 1.31775, marked as “resistance.”
Price needs to break above this level to confirm bullish momentum.
Entry & Stop:
Entry is around 1.31125 (current price).
Stop loss is below 1.30008 (support zone), protecting against downside risk.
Target:
1.34599, which aligns with the 0.618 Fibonacci retracement level from the previous swing high.
This is the bullish target if the breakout succeeds.
Price Action Logic
Price has been in a downtrend but is forming a potential reversal pattern near support.
The idea is to buy after confirmation of a breakout above the descending trendline and resistance.
Risk-to-reward looks favorable: small stop below support, large upside toward 1.34599.
✅ Summary of the Trade Idea
Bias: Bullish reversal.
Trigger: Breakout above trendline and resistance.
Stop: Below 1.30008.
Target: 1.34599 (Fibonacci level).
Good luck, everyone! And hey, don’t forget to smash that like button and drop your wildest market predictions in the comments! ❤️
Disclaimer: My trading strategy isn’t a signal—it’s more like a workout for my brain. I’m just here flexing my market structure knowledge and sharpening my trading skills while building my trade journal. Think of it as financial gym time—no personal trainers, just candlesticks!

XAU/USD Weekly Outlook | Gold Stuck in Consolidation RangeGold ended the week stuck inside a broad consolidation range, trading between 4052 support and 4098 resistance, showing indecision as neither buyers nor sellers have been able to take control.
Both the MA50 and MA200 are flat, reflecting a lack of strong directional momentum — the market is in balance, waiting for a catalyst.
Buyers need a confirmed break and sustained hold above 4098, followed by a break of 4142, to shift momentum. Until then, any upside attempts remain corrective within the range.
Failure to reclaim 4098 increases downside pressure. A drop below 4052 would expose the
4016–3968 Support Zone. If selling momentum extends further, gold could slide into the HTF Support Zone at 3921–3862, which is a major higher-timeframe demand area.
📌 Key levels to watch:
Resistance:
4098
4142
4198
4232
Support:
4052
4016
3968
3921
3862
🔎 Fundamental focus:
This week brings key U.S. data releases such as Core PPI, Retail Sales, Consumer Confidence, and Durable Goods Orders. With gold stuck in a range, any surprise in inflation or consumer strength could spark volatility.

XAU/USD Prophecy: Will 4200 Shine Bright?Greetings, Traders! Market Prophecy: XAU/USD in Action
Gold isn’t just sparkling—it’s plotting moves like a secret agent with Fibonacci codes! Here’s what the charts are whispering:
🔍 The Setup
XAU/USD has strutted its way to the 50% Fibonacci level, but if history is any guide, gold loves to go the extra mile—often stretching beyond 61.8% like it’s chasing a bonus level in a video game. Translation? There’s still some golden runway left for the bulls.
📈 The Technical Drama
On the 1-hour timeframe, we’ve got a trendline breakout—cue the fireworks!
The 30-minute chart? Resistance smashed like a piñata at a birthday party.
Now, all eyes are on the 4107 level. If price breaks this resistance, expect a pullback that could be your golden ticket for a long entry.
🎯 The Target
If the bullish momentum keeps flexing, we’re eyeing 4200 as the grand finale. Think of it as gold’s victory lap.
💡 Trading Idea
Break → Pullback → Long → Profit. Simple, but with style. Just remember: markets can be as moody as a cat, so manage your risk like a pro.
If you found this helpful, hit LIKE & COMMENT ❤️

Cup Complete, Breakout Brewing — Handle Still Lost in Tokyo!Greetings, traders! Market Prophecy is telling a story again… Don’t run — it’s not a horror movie, just a Cup & Handle trying to find its happy ending. Grab your popcorn, because this chart has more drama than a Netflix series!
The difference between EUR/JPY and USD/JPY? Simple: USD/JPY has already finished sipping its cup on the monthly chart, while EUR/JPY is still brewing like a slow barista. (Don’t worry, I’ll spill the details on the daily or weekly EUR/JPY chart later.)
For USD/JPY, the handle is still in progress — think of it as the market adding the latte art before serving the breakout. Best dip-buy zone? Around 120, but even at 140, this pair might bounce like a trader after a margin call.
Once the handle completes and resistance breaks, say goodbye to boring consolidation and hello to trending mode. That’s exactly what happened with XAU/USD — it rocketed sky-high! 🚀 So don’t miss out, unless you enjoy watching profits fly past like shooting stars.
Enjoyed this? Show some love with a LIKE and share your thoughts in the COMMENTS! 💬
Disclaimer
My trading strategy isn’t a signal — it’s more like therapy for my brain. I’m just here crying over candlesticks while pretending it’s ‘learning market structure.’ Sharpening my skills? Sure. Building my trade journal? Absolutely. But deep down, it’s just me whispering to the charts: ‘Please love me back

Supply & Demand vs Support & Resistance — Beyond the Lines“Two traders can look at the same level.
One sees a line.
The other sees the reason behind it.”
Most beginners start with Support & Resistance.
Advanced traders shift into Supply & Demand.
Both seem similar… and in some cases, they are the same.
But the difference lies in why price reacts — not just where.
Let’s break this down clearly.
1. Support & Resistance: The Surface Layer
Support and resistance are simple horizontal reaction levels.
Support
A price level where the market tends to bounce upward.
Resistance
A price level where the market tends to reject downward.
These levels represent crowd behavior.
Retail traders love them — which is why they often turn into liquidity pools.
Strength: easy to spot, widely used
Weakness: easily manipulated because stops cluster there
2. Supply & Demand: The Deeper Institutional Layer
Supply & Demand zones are created by imbalances — strong, one-sided moves driven by institutional orders.
To make the concept crystal clear:
Demand Zone
The last bearish candle (or group of candles) before a strong impulsive move upward, caused by institutional buying and imbalance.
Supply Zone
The last bullish candle (or group of candles) before a strong impulsive move downward, caused by institutional selling and imbalance.
These zones show where institutional buying or selling actually started.
Strength: precise entries, strong reaction zones
Weakness: requires deeper understanding and confirmation
3. How They Connect
This is where most traders get confused.
Support/Resistance = the reaction.
Supply/Demand = the reason for the reaction.
Many times:
A support level is formed because a demand zone sits right below it.
A resistance level is formed because a supply zone sits above it.
So yes — in many cases:
Demand = Support
Supply = Resistance
But only when the reaction was created by institutional imbalance.
4. When They Are NOT the Same
This is the part traders often miss.
❌ Support is NOT demand when:
• Price bounced many times (retail clustering)
• No strong bullish impulse originated there
• Candle structure shows hesitation, not institutional entry
This is just retail support, not a demand zone.
❌ Resistance is NOT supply when:
• Price tapped repeatedly (equal highs)
• No sharp drop came from that level
• The zone lacks displacement or imbalance
This is simply retail resistance, not a supply zone.
5. How to Use Both for Maximum Clarity
Here’s the practical way to combine them:
Use Support/Resistance to understand where retail will react.
Use Supply/Demand to understand where institutions will react.
Best workflow:
• Mark higher timeframe Supply/Demand
• Mark intraday Support/Resistance
• Wait for price to move between these layers
• Look for confirmation (ChoCH/BOS) at the real institutional zone
• Avoid taking trades directly at retail S/R without deeper context
This gives you direction, patience, and precision.
Example (XAUUSD)
Refer to M15 chart above:
Price respected an intraday support level,
but the real reversal happened only after tapping the demand zone below it,
where imbalance and institutional orders existed.
Support showed the bounce.
Demand explained the bounce.
One shows the line.
The other shows the truth behind the line.
📘 Shared by @ChartIsMirror
Do you trade with support and resistance, supply and demand, or a mix of both?
Share what you see — your approach reveals how you read the market’s story.

ETHUSD : TRADE IDEAAnother short opportunity is on ETH/USD. On the daily timeframe, price has successfully broken below the support level at 3353.41. The recent upward movement appears to be a temporary pullback before continuing its decline toward the 2747.46 level.
Ensure strong confirmation before acting, and keep an eye on shifts in market structure.
Thanks a lot for your support & best of luck
**My trading strategy is not intended to be a signal. It's a process of learning about market structure and sharpening my trading my skills also for my trade journal**

BTC Rebound: From Bear Hug to Bull RunWelcome back to Market Prophecy...
From the previous chart, the market successfully broke the support and continued its fall to the next support. So, I’m seeing a possibility that the price will drop to 77,663.25 before making a comeback to the 50%–61.8% level… because even markets need a little drama before a rebound
good luck all
**My trading strategy is not intended to be a signal. It's a process of learning about market structure and sharpening my trading my skills also for my trade journal**
Thanks a lot for your support

XAU/USD Weekly Drama: Resistance vs. Persistence!Welcome back to Market Prophecy...
Gold (XAU/USD) recently broke below its support level and the lower trendline, signaling bearish pressure. However, the price failed to breach the critical $4,000 mark, indicating strong buying interest at lower levels.
For the upcoming week, the bias shifts toward a bullish outlook, with the first key resistance located at $4,106.43. A confirmed breakout above this resistance and the trendline will serve as a strong entry signal for long positions.
Trading Plan:
Breakout Confirmation: Wait for price to close above $4,106.43 and the trendline.
Pullback Opportunity: If the breakout occurs, monitor for a retracement back to the support zone for an optimal entry.
Upside Target: The next major resistance is projected near $4,200, which will act as the primary profit target.
Key Levels to Watch:
Support: Previous breakout zone
Resistance: $4,106.43 (initial), $4,200 (target)
good luck all
**My trading strategy is not intended to be a signal. It's a process of learning about market structure and sharpening my trading my skills also for my trade journal**
Thanks a lot for your support

XAU/USD Intraday Plan – NFP Will Decide the Next MoveGold failed to clear the 4115 resistance yesterday, which led to a retest of the 4053 level — now acting as intraday support. Price is currently trapped between the MA200 and MA50, reflecting indecision ahead of the NFP release.
We need to see a clean break above the immediate resistance at 4078.
A sustained move above 4115 would confirm a momentum shift and open the door toward
4170 → 4232.
If price fails to clear 4078, we may see continued consolidation or another pullback into the Support Zone.
A break below 3,996 would expose the HTF Support Zone (3968–3921).
📌Key Levels to Watch:
Resistance:
4078
4115
4170
4232
Support:
4053
4027
3996
3968
3921
🔎Fundamental Focus:
Today is all about NFP, one of the most market-moving releases for gold. With job creation, wages, and unemployment all being published together, we can expect sharp volatility in both directions.

$DOT / Polkadot - Life SupportWith price coming out of the accumulation range in a downtrend and collapsed under weekly mitigated support/demand.
Price is now retesting this weekly level in a textbook 'break & retest'.
Bulls need to reclaim this area for a chance, other than that it could be curtains.

XAUUSD UPDATE : BREACH 4149.78hi again
Market Analysis
From the previous chart, the price successfully broke above 4149.78. At the current level, the next resistance is identified at 4279.23, while key support is around 4124.81.
Trade Plan
Sell Setup:
Look for rejection at 4279.23 combined with bearish price action confirmation at that resistance level.
Buy Setup:
Look for rejection at 4124.81 combined with bullish price action confirmation at that support level
good luck all
**My trading strategy is not intended to be a signal. It's a process of learning about market structure and sharpening my trading my skills also for my trade journal**
Thanks a lot for your support

XAU/USD Intraday Plan | Bulls Eye 4285 After 4153 BreakoutAfter a short consolidation phase, gold broke above the 4153 resistance and extended higher, now trading around 4236. A clean break and hold above 4234 could open the path for the next resistance at 4285.
If bullish momentum fades, watch the MA50 for potential dynamic support and the Pullback Zone (4153–4115) for a possible retracement area.
Failure to hold that zone could trigger a deeper move toward lower support levels.
📌Key Levels to watch:
Resistance:
4234
4285
4322
Support:
4197
4153
4115
4074
4027
🔎Fundamental Focus:
Today’s calendar is light on major economic data, but multiple FOMC members are scheduled to speak, which could provide hints on future monetary policy direction.

XAUUSD UPDATE: WHAT NEXTHi everyone,
Gold is currently testing the resistance level at 4149.78. A breakout above this level could push the price toward the 4203–4204 level. Conversely, if the price breaks below the 4124–4123 support, I’ll be watching for a potential pullback around 4098 or a rejection from the trendline
good luck all
**My trading strategy is not intended to be a signal. It's a process of learning about market structure and sharpening my trading my skills also for my trade journal**
Thanks a lot for your support

XAU/USD Intraday Plan | Higher for Now — Keep an Eye on SupportWe have a volatile week ahead as the U.S. government shutdown situation continues to unfold. The first vote has passed, but there is still uncertainty around final approval and timing.
Gold has pushed higher during the Asian session, breaking above the 4027 resistance and is now trading around 4076, sitting just above the 4074 level. A confirmed break and hold above 4074 would likely open the door for further upside toward 4115, with 4153 as the next major resistance target.
However, if price fails to sustain above 4074, we could see a pullback toward 4027 for a retest. If selling pressure increases from there, price may rotate back into the First Reaction Zone, where buyers previously stepped in.
📌 Key Levels to Watch
Resistance:
4074
4115
4153
Support:
4027
3984
3955
3921
3884
🔎 Fundamental Focus
All eyes remain on the U.S. government shutdown situation, with votes and negotiations around reopening in focus. The longer the shutdown continues, the more it disrupts key economic data releases and increases uncertainty — which can keep gold reactive and sensitive to headlines.

XAU/USD Intraday Plan | Watching 3957–3918 for Buyer ReactionGold remains in consolidation after failing to break above the 4042 resistance yesterday. The rejection from the MA200, followed by a break below the 3989 support level.
Price is now trading around 3982, approaching the First Reaction Zone (3957–3918). If this zone fails to hold, further weakness could expose the Support Zone (3884–3851), followed by the HTF Support Zone (3820–3781) as deeper reaction levels.
To shift momentum back to the upside, buyers need to reclaim 3989 and 4042, with the MA200 continuing to act as a major dynamic resistance.
📌 Key levels to watch:
Resistance:
3989
4042
4090
4142
Support:
3957
3918
3884
3851
🔎 Fundamental Focus:
There are no major economic releases on the calendar today, but traders should remain cautious as political headlines and broader fundamental developments can still drive sharp moves in gold.
