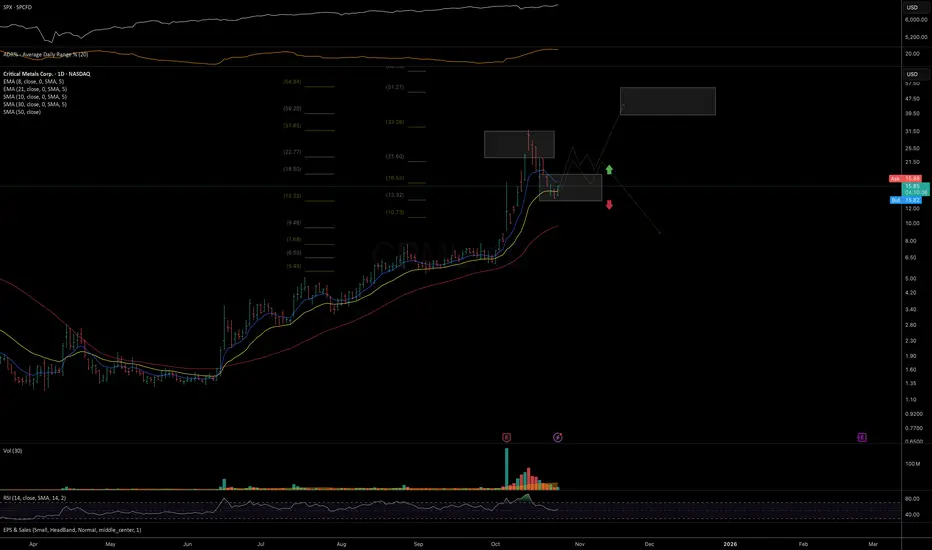
CRML dubious speculationHighly speculative setup, but for now, price continues to respect the key levels of uptrend support and resistance.
As long as price holds above 13, there is room for at least a bounce, if not a potential continuation move toward the 39–55 macro resistance zone, which aligns with the broader uptrend structure from the April 2025 bottom.
Chart:
Support and Resistance
SOLUSD: Key 175 Support in Focus After 198.5 Rejection
SOLUSD is currently consolidating in a range, facing a pullback after being rejected by the 198.5 current resistance level.
For the bulls to regain control, the price needs to break and hold above the 198.5 resistance, which would set the stage for a move towards the 200 to 205 key resistance zone.
The current bearish pressure suggests that a retest of the 175 current support level is likely in the short term.
A breakdown and close below the 175 support would be a significant bearish development, potentially sending the price down to the 160 to 165 key support zone.
Disclaimer:
The information provided in this chart is for educational and informational purposes only and should not be considered as investment advice. Trading and investing involve substantial risk and are not suitable for every investor. You should carefully consider your financial situation and consult with a financial advisor before making any investment decisions. The creator of this chart does not guarantee any specific outcome or profit and is not responsible for any losses incurred as a result of using this information. Past performance is not indicative of future results. Use this information at your own risk. This chart has been created for my own improvement in Trading and Investment Analysis. Please do your own analysis before any investments.

XRPUSD: Bulls Challenge 2.500 Resistance After Trendline Break
XRPUSD has successfully broken out from its descending trendline and is currently pushing towards the 2.500 first resistance, having established strong support at the 2.300 key level.
A decisive close above the 2.500 resistance would signal continued bullish strength, opening the door for a potential move towards the 2.700 key resistance and then the 2.90 to 2.95 flip zone.
If the price fails to overcome the 2.500 resistance, it could pull back to retest the 2.300 key level, which now acts as a critical support.
A breakdown below the 2.300 support would negate the recent bullish momentum and could lead to a deeper correction, with the 2.1 next support level being the primary downside target.
Disclaimer:
The information provided in this chart is for educational and informational purposes only and should not be considered as investment advice. Trading and investing involve substantial risk and are not suitable for every investor. You should carefully consider your financial situation and consult with a financial advisor before making any investment decisions. The creator of this chart does not guarantee any specific outcome or profit and is not responsible for any losses incurred as a result of using this information. Past performance is not indicative of future results. Use this information at your own risk. This chart has been created for my own improvement in Trading and Investment Analysis. Please do your own analysis before any investments.

BTCUSD: 112K Resistance Holds Firm, 107K Support in Sight
BTCUSD is currently facing a rejection from the confluence of a major descending trendline and the 112K minor resistance level.
For a bullish reversal, the price needs to decisively break above the 112K resistance, which would open the path towards the 114K to 116K trend change zone.
The current rejection suggests a probable move downwards, with the first target being the 107K minor support level.
If the bears maintain control and break the 107K support, the next significant area of interest will be the 103K to 105K key support zone.
Disclaimer:
The information provided in this chart is for educational and informational purposes only and should not be considered as investment advice. Trading and investing involve substantial risk and are not suitable for every investor. You should carefully consider your financial situation and consult with a financial advisor before making any investment decisions. The creator of this chart does not guarantee any specific outcome or profit and is not responsible for any losses incurred as a result of using this information. Past performance is not indicative of future results. Use this information at your own risk. This chart has been created for my own improvement in Trading and Investment Analysis. Please do your own analysis before any investments.

BMNR: potential start of a new swing move Still early in development and price has a lot to prove before confirming a sustainable trend shift, but it might be attempting to start a new swing from today’s action.
The key task for bulls is to see closes above the EMAs and the formation of a higher low to confirm stability of upside momentum.
Conversely, a breakdown below the 44–42 support zone would increase odds for further downside and invalidate the potential reversal setup.
Chart:

US100 STRONG BREKAOUT|LONG|
✅US100 Price has successfully broken through the key resistance and all-time-high level, confirming bullish intent. As long as the breakout holds above structure, we anticipate continuation toward the next premium zone and liquidity resting at higher highs. Time Frame 3H.
LONG🚀
✅Like and subscribe to never miss a new idea!✅

ANOTHER BUY AND HOLD SUNDAY/MONDAY No matter where price closes today there is another buy and hold i will post any moment after tomorrow morning because once you understand the language of the market you analyze and predict before price comes to obey it if it's not changing direction, you don't wait for price to pass before analyzing.

Double bottom exactly fits for TTDThe double bottom pattern fits for TTD and first resistance 66 and then first target 90. Then story continues for double bottom target of 140 which is exactly same for double top. But remember, there is a big order block at the red area. So , it would take time to reach double bottom target.

APEUSDT the massive pump and 5x soon coming As previously outlined in our analysis, the APEUSDT pair is trading in a zone that historically constitutes a long-term support base. The current price action suggests a potential exhaustion of selling pressure, indicating that the asset may be consolidating for its next significant move. We anticipate a substantial bullish wave, projecting a minimum appreciation of +500% towards the predefined targets illustrated on our technical chart. This upward movement is expected to materialize upon the confirmation of a trend reversal, irrespective of the exact timing.
DISCLAIMER: ((trade based on your own decision))
<<press like👍 if you enjoy💚

VIRTUALUSDT near 1$ critical zone any breakout cause huge pump The price is currently approaching a significant technical confluence, testing both the upper boundary of its prevailing channel and the key psychological resistance at $1.00. A decisive breakout above this combined resistance zone would signal a substantial shift in market structure and momentum. In such a scenario, we would anticipate a strong bullish impulse, with an initial projected target zone beginning above $2.00.
Conversely, should the price face sustained rejection from this critical resistance area, it would indicate a failure to overcome selling pressure. This could invalidate the near-term bullish outlook and potentially trigger a significant corrective move. In the long-term, such a development could see the price decline toward the $0.20 support level.
DISCLAIMER: ((trade based on your own decision))
<<press like👍 if you enjoy💚

A head and shoulder for BFLY ?After bouncing from strongest support 1.3 , then drawing a head and shoulder between the 2.7
Now retesting and continue for the breakout from 2.7 . Next targets 4.2 and 5 . Between the 2 and 2.1 is the area for buy chance.

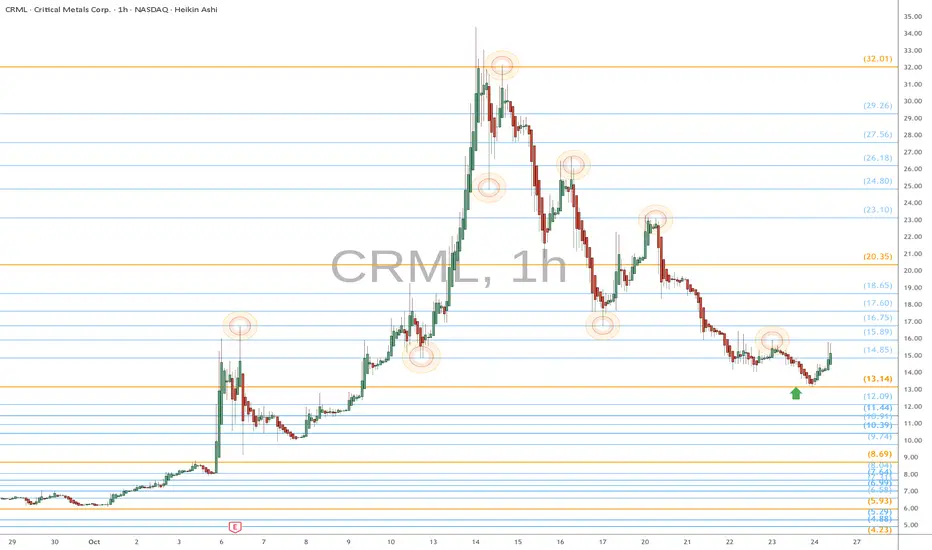
CRML eyes on $13.14: Golden Genesis fib might hold the Retrace CRML has been collapsing since topping at a Golden Genesis.
Fell through one Golden and about to test another at $13.14
Look for consolidation around this fib then possible recovery.
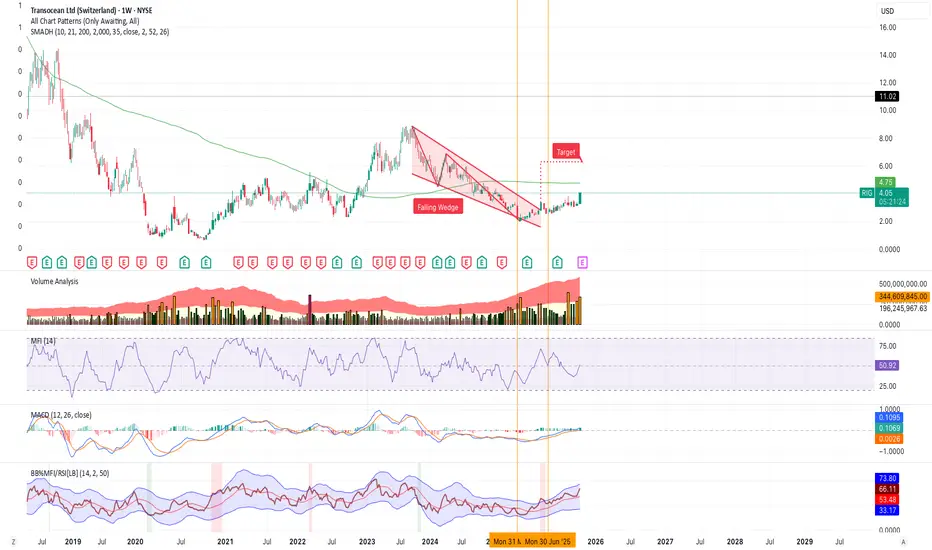
$RIG approaching 200W moving averageNYSE:RIG is approaching its 200-week smoothed moving average on unusually strong volume. I will be watching for a clear break and support on it. The last time this occurred, the stock doubled. With growing recent volume, a strong uptrend appears to be in play. This narrative could develop significantly if geopolitics continue to push oil and gas. Additionally, D. E. Shaw upped their holdings of NYSE:RIG by +1,000% last quarter (between the orange vertical lines), which I like to see.
Elliot Waves on $OTSKY (Otsuka Holdings / Pocari Sweat)Potential 3rd wave beginning for OTC:OTSKY / 4578 (TSEJ).
Idea would be invalidated with a break below ~$22.
Expected confirmed move to be ~$50+.
Watching for a strong upward break above ~$29 to confirm move.
Could come from upcoming earnings results.
Additionally, IBD MarketSurge is showing a Cup & Handle with pivot @ $28.93.

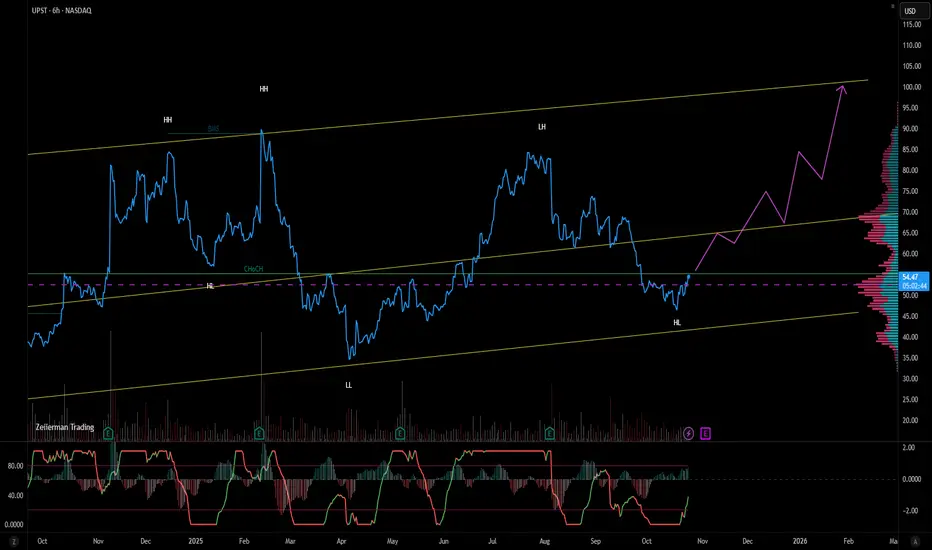
UPST, follows all trendsIn sequence,targets 65,85 and 100. As in the backward movements generally follows the trend lines and the support and resistance levels.
GOLD on the RISE!XAUUSD moved as we analyzed. Now waiting for BreakOut from RESISTANCE to see if it will retesting and continue flying UP todsy or when markets reopen next week.
