BTC CME GAP (4H)Bitcoin has a CME gap in the $89,805 – $89,425 range
These gaps are usually filled before the price makes its next move.
Let’s see what happens.
For risk management, please don't forget stop loss and capital management
Comment if you have any questions
Thank You
Support and Resistance

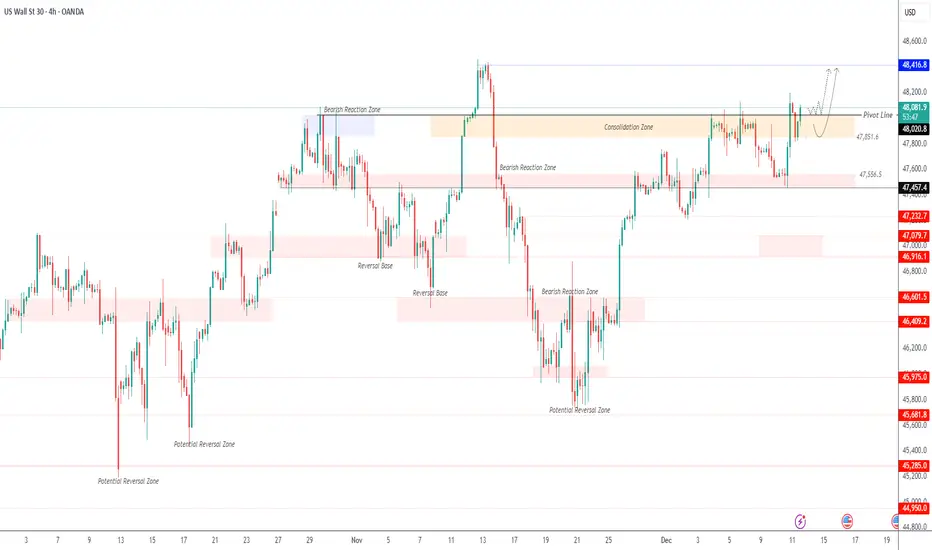
US30 Testing the Pivot Before Next MoveUS30 – Technical Overview
The Dow Jones (US30) gained 1.1% after the Fed’s rate cut, pushing the index within 200 points of a new all-time high. Futures later turned slightly positive, with US30 outperforming Nasdaq and S&P 500 despite weakness in tech.
US30 is attempting to stabilize above the 48020 pivot line. A breakout above this level on a 4H close would support a move toward the previous all-time high at 48415.
A correction remains possible toward the pivot or slightly below it, with 47850 acting as a key pullback level before any renewed bullish momentum.
A 4H break below 47850 would confirm bearish pressure toward 47560 and 47460.
Pivot: 48020
Resistance: 48415 · 48690
Support: 47850 · 47560 · 47460
BUY BACK ON GOLDclosing my sell position at breakeven and looking forward to go long on a new set up

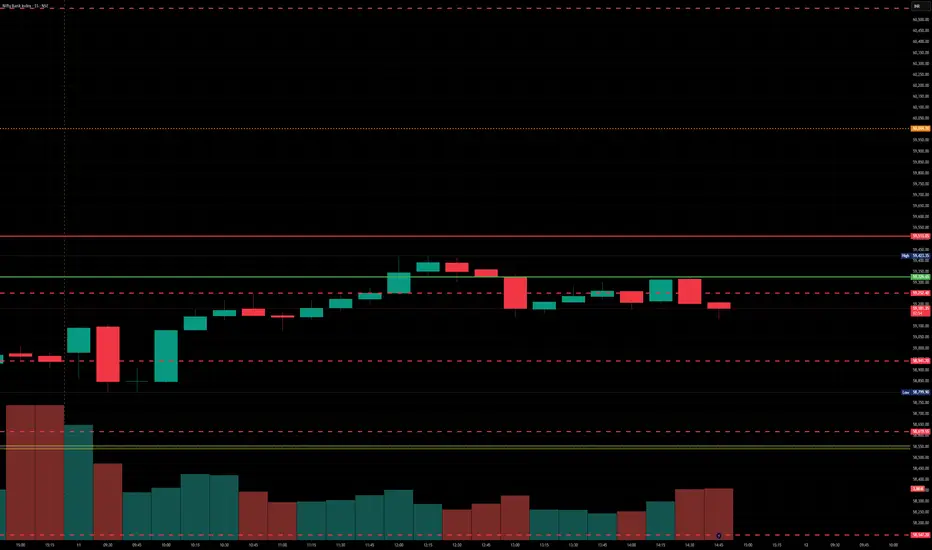
SP500 Price consolidating in a bullish structureSP500 is currently consolidating in a bullish structure after successfully holding key support. This stabilization suggests that price may be preparing for another move to the upside.
Technically Wall Street’s main index is expected to remain relatively steady ahead of the closely watched Federal Reserve decision. The Fed is widely expected to deliver a rate cut, although uncertainty remains regarding the extent and pace of potential rate reductions going into 2026.
During the announcement, price may experience temporary volatility—especially upward spikes driven by liquidity grabs. However, the sustained direction will depend entirely on Powell’s tone and forward guidance.
If the market maintains its bullish structure following the Fed release, we could see the SP500 extend higher toward new highs in the 6,924.50 – 7,000.35 zone.
You may find more details in the chart,
Trade wisely best of luck buddies.
Ps; Support with like and comments for better analysis thanks for supporting.

THE Analysis (1H)Considering that THE is currently accumulating liquidity and approaching the supply zone, we can look for sell / short positions in this area.
The targets are marked on the chart.
Do not enter the position without capital management and stop setting
Comment if you have any questions
thank you

CHF-JPY Clear Rejection! Sell!
Hello,Traders!
CHFJPY taps into a premium-priced supply zone and prints rejection after taking local buy-side liquidity, setting the stage for an SMC-style correction toward the inefficiency below. Time Frame 5H.
Sell!
Comment and subscribe to help us grow!
Check out other forecasts below too!
Disclosure: I am part of Trade Nation's Influencer program and receive a monthly fee for using their TradingView charts in my analysis.

USDJPY LONG FROM DEMAND AREA|
✅USDJPY price drives into a discounted demand level after clearing sell-side liquidity, setting up an ICT-style rebound as bullish orderflow begins to reassert itself toward the next inefficiency above. Time Frame 6H.
LONG🚀
✅Like and subscribe to never miss a new idea!✅

XAU/USD – H1 Trading Plan: Buy at OB 4,19x – 4,18x, Targets 4,241. Market Structure (H1)
Gold is retracing back into bullish structure after breaking a series of bullish ChoCH and BoS, forming a new high around 4,24x. The current decline is only a technical pullback because:
• Price is returning to the Buy Order Block at 4,188 – 4,196.
• This zone aligns with trendline support and the demand base that fueled the previous impulse.
• The macro structure remains bullish as long as H1 does not close below 4,188.
→ This is a clear pullback–continuation setup: wait for price to retrace into discount, then target higher zones.
2. Key Levels
🔹 Demand Zone (Buy Zone): 4,188 – 4,196
• Bullish OB
• Trendline support
• Priority BUY area
🔹 Resistance 1: 4,217 – 4,218
• Multiple rejections
• Breakout → next bullish leg
🔹 Resistance 2: 4,238 – 4,239
• 0.5–0.618 Fibo confluence
• Possible mild sell reaction
🔹 Liquidity & Targets:
• 4,259 → Fibo 1.272
• 4,278 → Fibo 1.618 + resting liquidity
3. Trading Plan
🔸 Main Scenario – BUY at OB 4,19x – 4,18x
Conditions:
• Price taps 4,188 – 4,196
• Reversal signals: pin bar, engulfing, or bullish ChoCH
Targets:
TP1: 4,217
TP2: 4,238
TP3: 4,259
TP4: 4,278
Invalidation:
• H1 close below 4,185 → stay out.
🔸 Alternate Scenario – Price goes up without retesting OB
If price holds above 4,210 and breaks 4,217:
• Wait for retest of 4,217
• BUY continuation toward 4,238 → 4,259 → 4,278
Market Outlook
Gold is accumulating and building a base for a stronger breakout. The OB Buy zone 4,19x – 4,18x remains the highest-probability reversal area.

Market Landscape After the Fed Rate Cut !Gold Price Trend Analysis: Yesterday, gold opened higher and encountered resistance near 4219, then began to fluctuate downwards. During the European session, it fell to around 4187 before consolidating. Influenced by the Fed's interest rate decision, gold exhibited a pattern of rising first, then falling, and then rising again, reaching a low of around 4182 and a high of around 4239. The daily candlestick closed as a bullish candle. Logically, after this upward move, the subsequent target should be the 4255-4265 area. However, considering the current market trend, this tendency to rise more easily than fall is the most sustainable. We can actually see the upper limit, with the first high point at 4265, and at least for the current stage, we haven't reached the top yet.
Gold Technical Analysis: On the hourly chart, the moving averages are arranged in a bullish pattern, maintaining strong upward momentum. Technically, the bulls have broken through the neckline and are rising again. The price action shows a large bullish candle at the bottom, indicating strong upward momentum. The current high also coincides with the current cyclical pullback level, making a technical correction reasonable. Today, we expect the price to continue its upward trend after a pullback. Short-term support is around 4210-4200, a support/resistance level. Resistance is around 4255-4265. Avoid chasing highs, but the short-term bullish stance remains unchanged. Intraday trading should continue with a buy-on-dips strategy. In summary, today's gold trading strategy is to primarily buy on dips and secondarily sell on rallies. Key resistance is around 4255-4265, and key support is around 4210-4190. Please follow the trend closely.


Dollar Index at Critical Support — Is a Big USD Rally Coming?Today I want to analyze the DXY index( TVC:DXY ) for you, which is one of the key indices in the financial markets.
At the moment, the DXY index is moving near a support zone($98.85-$98.50), Monthly Support (1) level, and the 21_SMA(Weekly).
In addition, the DXY has been trending inside a descending channel for roughly the past 13 trading days.
The main question is whether the DXY can break below this confluence of support levels or not.
Looking at the 4-hour chart, we can identify a Morning Star candlestick reversal pattern, and there is also a clear bullish Regular Divergence (RD+) between the last two lows.
Moreover, the US 10-Year Government Bond Yield ( TVC:US10 ) appears bullish in my view — and its upward movement can potentially support a rise in the DXY as well.
From my perspective, the best currency pairs to capitalize on a stronger USD are USDJPY( FX:USDJPY ) and EURUSD( FX:EURUSD ).
We should also keep in mind that several important US economic indicators will be released this week, which could significantly impact market direction. So be extra cautious with your positions, especially during data releases:
JOLTS Job Openings➡️09 December
Federal Funds Rate➡️10 December
FOMC Statement➡️10 December
FOMC Press Conference➡️10 December
Unemployment Claims➡️11 December
I expect that once the DXY breaks above the upper line of the descending channel, it could at least move toward one of the higher Fibonacci levels.
Do you think the U.S. interest rate will be cut this week?
💡 Please respect each other's opinions and express agreement or disagreement politely.
📌U.S. Dollar index Analysis (DXYUSD), 4-hour time frame.
🛑 Always set a Stop Loss(SL) for every position you open.
✅ This is just my idea; I’d love to see your thoughts too!
🔥 If you find it helpful, please BOOST this post and share it with your friends.

AUDUSD Bullish Trend Continuation From Marked Support ZonesH4 - Bullish Trend in play
Two Solid Support Levels
Trend continuation very likely after pullback.

NZD/USD: Confirmed Break of StructureI see a confirmed bullish breakout of a significant daily structure, with the candle closing above it on 📈NZDUSD chart.
With a high probability, the market will continue rising and
reach 0.5840 resistance soon.

30m XAUUSD Gold is at a strong buy zone $4,176-$4,184. Look for a bounce up to $4,213 first, then $4,233. Stop below $4,176.
Easy, clear, trade smart.
Caution : This is not a financial advice

EURGBP | Move down Expecting a move down from this zone to continue the downtrend.
Price has been rejected from the red zone multiple times and wee see a reaction now.
Let me know what you think!
Stay safe out there and do your own due diligence, this is not investment advise!

UASDCAD: Bearish! A Little Pullback, Then Down!The USD has been weakened over the past couple of weeks. Markets are at a 90% pchance the Fed cut rates by .25 bp, and that Trump will be installing Hasset, a loyalist, as Fed Chair. Couple that with the positive job numbers that Canada announced last week, and you see the downward trajectory of the USDCAD heading down.
It seems very likely that we will see more movement downtown this week.
I am expecting an OHLC candle for the week ahead.
The Draw on liquidity (DOL) would likely be the relative equal lows to the left.
May profits be upon you.
Disclaimer:
I do not provide personal investment advice and I am not a qualified licensed investment advisor.
All information found here, including any ideas, opinions, views, predictions, forecasts, commentaries, suggestions, expressed or implied herein, are for informational, entertainment or educational purposes only and should not be construed as personal investment advice. While the information provided is believed to be accurate, it may include errors or inaccuracies.
I will not and cannot be held liable for any actions you take as a result of anything you read here.
Conduct your own due diligence, or consult a licensed financial advisor or broker before making any and all investment decisions. Any investments, trades, speculations, or decisions made on the basis of any information found on this channel, expressed or implied herein, are committed at your own risk, financial or otherwise.

AUDUSD Short Term Buy IdeaH4 - Strong bullish move.
Currently it looks like a pullback is happening.
Until the two Fibonacci support zones hold I expect the price to move higher further.
If you enjoy this idea, don’t forget to LIKE 👍, FOLLOW ✅, SHARE 🙌, and COMMENT ✍! Drop your thoughts and charts below to keep the discussion going. Your support helps keep this content free and reach more people! 🚀
--------------------------------------------------------------------------------------------------------

BankNifty levels - Dec 12, 2025Utilizing the support and resistance levels of BankNifty, along with the 5-minute timeframe candlesticks and VWAP, can enhance the precision of trade entries and exits on or near these levels. It is crucial to recognize that these levels are not static, and they undergo alterations as market dynamics evolve.
The dashed lines on the chart indicate the reaction levels, serving as additional points of significance. Furthermore, take note of the response at the levels of the High, Low, and Close values from the day prior.
We trust that this information proves valuable to you.
* If you found the idea appealing, kindly tap the Boost icon located below the chart. We encourage you to share your thoughts and comments regarding it.
Wishing you successful trading endeavors!
XAUUSD Choppish Down.Hi,
Gold looks bearish on the H1 timeframe, with a bias toward 4140–4132.051. Bearish pressure is sitting around 4240, acting on the 4220 area. A break below 4189.315 might lead to a bearish breakout.
Happy Trading,
K.
Not financial advice.

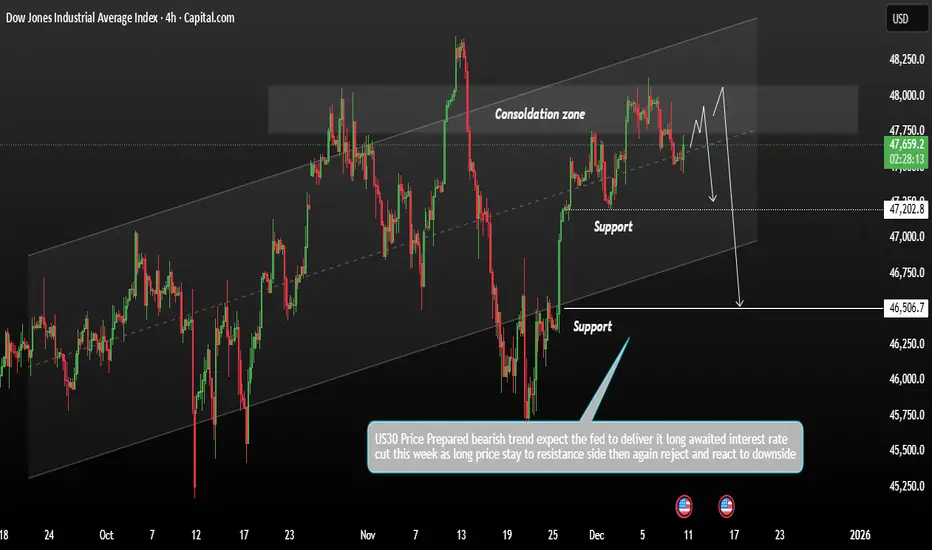
US3O Price Consolidation within its broader bearish momentumUS30 remains in a consolidation phase within its broader bearish trend. After failing to break down convincingly, price may retest overhead resistance before determining the next direction.
Technically Wall Street futures edged slightly higher as traders positioned themselves ahead of one of the most closely watched and divisive upcoming Federal Reserve meetings. Despite this temporary lift, technical structure still favours the bears.
US30 continues to show signs of weakening momentum, and as long as price remains below key resistance levels, bearish control is expected to persist. The index may revisit the support zone between 47,202 and 46,506, which continues to act as an important downside target area.
You may find more details in the Chart.
Trade wisely best of luck buddies.
Ps; Support with like and comments for better analysis thanks for supporting.
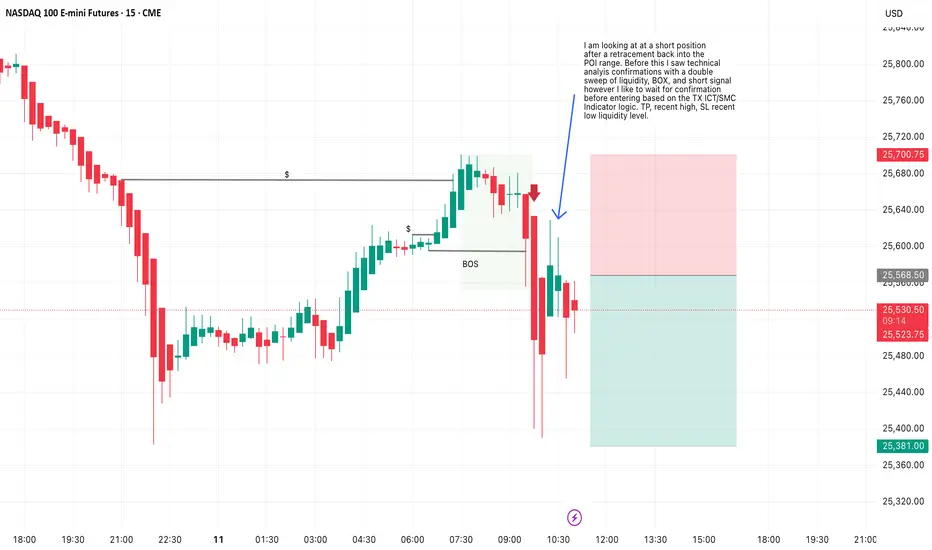
TX ICT/SMC Based NQ1 Short, Liquidity level based SL,TPI am looking at at a short position after a retracement back into the POI range. Before this I saw technical analysis confirmations with a double sweep of liquidity, BOX, and short signal however I like to wait for confirmation before entering based on the TX ICT/SMC Indicator logic. TP, recent high, SL recent low liquidity level.
USDJPY: Move Up Confirmed?! 🇺🇸🇯🇵
USDJPY will likely bounce from the underlined intraday support.
A formation of a bullish engulfing candle confirms a buying
imbalance after its test.
The price will rise at least to 156.54
❤️Please, support my work with like, thank you!❤️
I am part of Trade Nation's Influencer program and receive a monthly fee for using their TradingView charts in my analysis.

The Calm Before the Storm: How to Position Your Gold#XAUUSD OANDA:XAUUSD TVC:GOLD
Gold prices are currently falling slowly and have already broken below 4190. In the short term, if the decline continues, it may test the lower Bollinger Band on the 4-hour chart around 4180. If it touches this level for the first time before the interest rate announcement, a small long position can be considered. I have marked the other key points on the map. You can refer to the layout of the key points. In conclusion, the interest rate itself was not the key point of this interest rate decision, the dot plot, economic forecasts, and bond-buying program were the deciding factors. Correspondingly, gold is highly likely to experience significant volatility tonight, without a doubt.
