Look for REJECTION with AUDUSDAUD/USD Daily Analysis
Pair: Australian Dollar / U.S. Dollar (AUD/USD)
Timeframe: 1 Day (1D)
Data Source: FXCM
Key Levels:
Open: 0.66406
High: 0.66859
Low: 0.66288
Close: 0.66763
Change: +0.00357 (+0.54%)
Analysis:
The AUD/USD closed higher today, up 0.54% to 0.66763. The pair demonstrated a bullish momentum, with price action climbing from a low of 0.66288 to a session high of 0.66859. This uptick could signal renewed buying interest in the pair, with the daily close above the opening suggesting a positive sentiment among traders.
What to Watch:
Resistance may be found near the recent high at 0.66859. A break above this level could push the AUD/USD towards further gains.
Support is situated near 0.66288. If the price reverses, this may be a key area to watch for a bounce.
Outlook:
Traders should look for confirmation of continuation or a reversal near today's high and low. Keep an eye on macroeconomic developments and U.S. dollar trends for further directional clues.
Disclaimer: This analysis is for informational purposes only and is not financial advice.
Support and Resistance

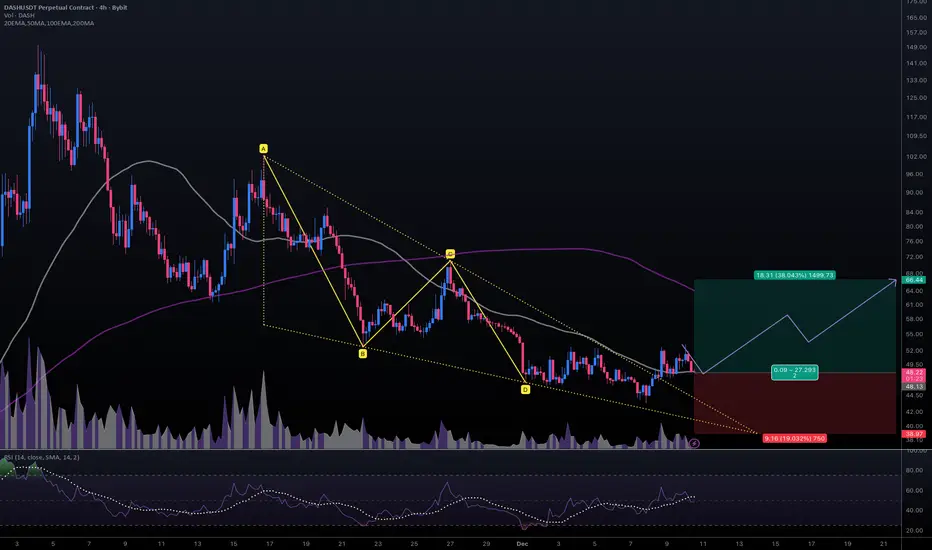
#DASHUSDT #4h (ByBit) Falling wedge breakout and retest [LONG]Digital Cash is pulling back to 50MA regained support where it seem likely to bounce towards 200MA resistance.
⚡️⚡️ #DASH/USDT ⚡️⚡️
Exchanges: ByBit USDT
Signal Type: Regular (Long)
Leverage: Isolated (2.0X)
Amount: 5.3%
Current Price:
48.22
Entry Targets:
1) 48.13
Take-Profit Targets:
1) 66.44
Stop Targets:
1) 38.97
Published By: @Zblaba
CRYPTOCAP:DASH BYBIT:DASHUSDT.P #4h #DigitalCash #Privacy dash.org
Risk/Reward= 1:2.0
Expected Profit= +76.1%
Possible Loss= -38.1%
Estimated Duration= 1-2 weeks
EURCAD WILL FALL|SHORT|
✅EURCAD is pulling back into the underside of a higher-timeframe supply level after sweeping internal buy-side liquidity, setting up an ICT bearish continuation structure. Price is now drawing toward the next sell-side pocket at the target zone. Time Frame 7H.
SHORT🔥
✅Like and subscribe to never miss a new idea!✅

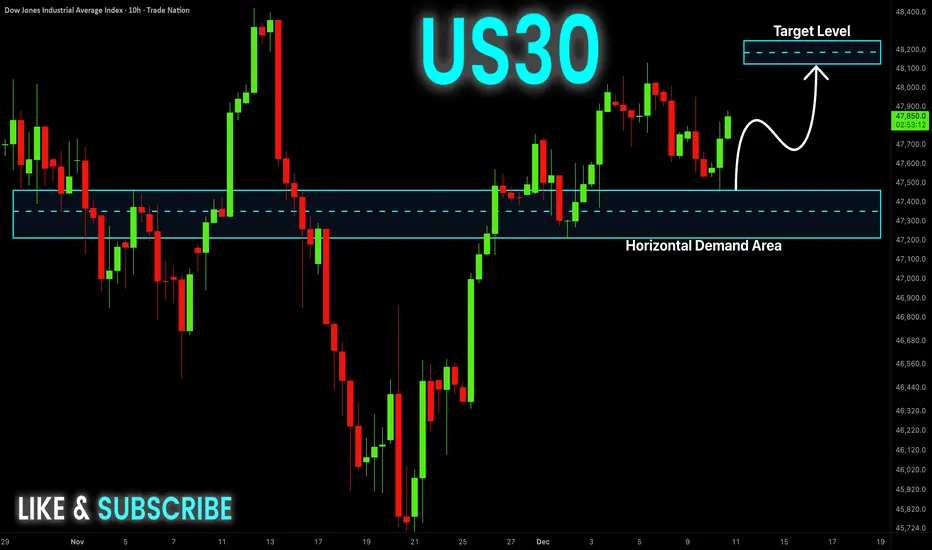
US30 Will Go UP! Buy!
Hello,Traders!
US30 has rebounded cleanly from the horizontal demand area after sweeping sell-side liquidity, confirming an SMC accumulation reaction that shifts order-flow bullish and draws price toward the next buy-side target above. Time Frame 10H.
Buy!
Comment and subscribe to help us grow!
Check out other forecasts below too!
Disclosure: I am part of Trade Nation's Influencer program and receive a monthly fee for using their TradingView charts in my analysis.
Gold intra-day selling opportunity showed after Fibo & OB bounceXAUUSD (Gold/US Dollar).
Timeframe: 15-minute chart (15m).
Trend Context: The price experienced several increase and decrease but made an imbalance on 1H timeframe yesterday, and it's probably going to decline till closing the FVG on 1h.
There is a major ascending orange trendline acting as dynamic support. The price recently tapped this line and bounced, creating the current upward retracement, but in the last 4 hours, it is showing a probability to break this line down.
I see what I see depending on several reasons:
1. ChoCh (Change of Character) indicating a structural shift that often precedes a retracement or reversal.
2. Fibonacci & Key Levels
The price is trying to bounce back from the golden area of the recent bearish swing (high to low)
0.5 Level (Equilibrium): Located at 4203.330. The price is currently testing this area.
0.618 Level (Golden Zone): Located at 4206.995. This level acts as strong resistance and aligns with the entry zone.
3. Trade Setup (Short/Sell Idea)
The setup is a bearish continuation play, looking to short the market as it retraces into a supply zone.
The entry is just before the OB on 15 min
The target is set near the recent swing low, anticipating that the price will reject the Order Block and fall back down.
⚠️ Note
This is a technical outlook based on my POV to the chart. Always manage risk carefully and adapt if market conditions change
I would be grateful to get your feedback on this idea if you have any opinions to share.
✽ Improve your awareness to seek a great analysis ✔
@AbdullahTech ♾

BTCUSD Potentially on Rise.Hi there,
BTCUSD looks potentially bullish on the H1 timeframe, with a possible bias toward 100,457 and a price target of 96,919.
Happy Trading
K.
This is not financial advice.

BTC Down Soon?Bitcoin is currently testing a critical zone around $92-96K. Looking at the price action, we've seen multiple rejections from higher levels and price is now approaching an important support area.
Key Observations:
Price forming lower highs since reaching $126K
Multiple horizontal support levels below current price ($85K, $80K, $74K)
Rising trendline support from April lows being tested
Potential breakdown scenario marked with orange arrow targeting $74-75K area
Possible Scenarios:
1️⃣ Bearish scenario (orange arrow): If current support fails, we could see a move down to test the $74-75K zone, which was the previous low
2️⃣ Bullish scenario: Price holds above $90K and bounces back toward $100K+ resistance levels
The upcoming days will be crucial. Watch for volume confirmation on any breakdown or bounce.
What's your take? Bounce or breakdown? 📉📈
⚠️ DISCLAIMER: This is not financial advice. This analysis is for educational purposes only. Always do your own research and consult with a financial advisor before making any investment decisions. Trading cryptocurrencies carries significant risk.

USDCHF: Key Resistance.!USDCHF is on a wild horizontal range of support and resistance, the pair have been ascending upward in view of the overall trend and market structure. here we can spot how the price broke above the little lower highs and lows, heads towards resistance.
Meanwhile, the price is practically at the resistance zone, which there is strong expectation of short below this level.
Possible outline;
A confirmed retracement below the resistance, would sett off a sell position down to 0.7884.
Keep it simple, keep it trading.
Thanks for reading.

AUDUSD FREE SIGNAL|SHORT|
✅AUDUSD price taps into a major supply level after an extended run, showing signs of distribution in premium. ICT orderflow suggests a draw back toward inefficiency below as the market seeks liquidity beneath short-term lows.
—————————
Entry: 0.6683
Stop Loss: 0.6707
Take Profit: 0.6644
Time Frame: 12H
—————————
SHORT🔥
✅Like and subscribe to never miss a new idea!✅

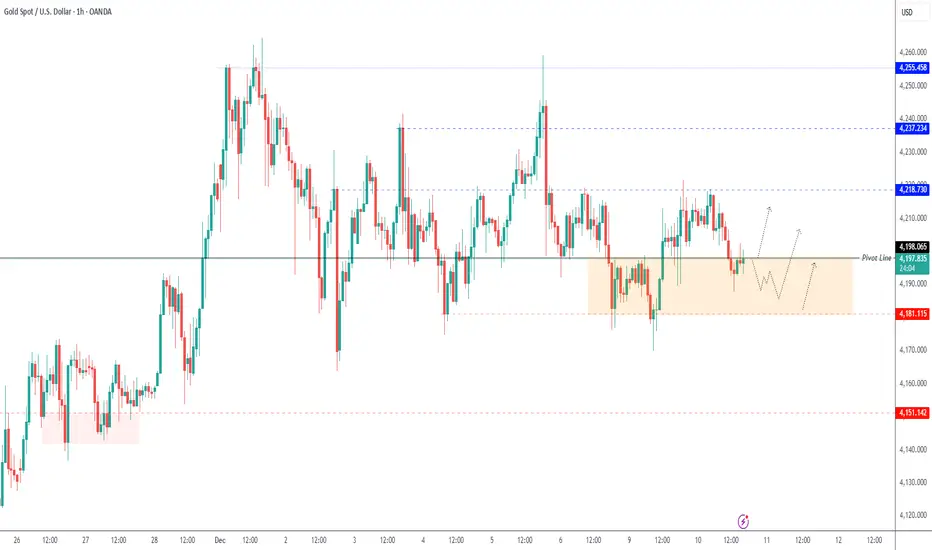
GOLD – MARKET OUTLOOK | Watching 4198 as Fed Signals ApproachGold prices are slipping slightly ahead of remarks from
Jerome Powell, but the metal continues to hold above the $4,181 support zone.
With expectations high for a rate cut, traders are looking for clarity on the Federal Reserve outlook for 2026.
A recent slump in U.S. government bonds has dampened risk appetite, as concerns grow about the pace of future monetary easing.
Lower interest rates generally support non-yielding assets such as gold, so Powell’s tone will be critical for short-term direction.
Technical Analysis
Gold is currently in a corrective movement toward 4181, where buyers may attempt to re-enter.
A bullish recovery is favored while the price remains above 4198.
Above 4198: bullish momentum continues toward 4218,
and a breakout above this level opens the way toward 4237.
Below 4198: bearish pressure strengthens toward 4181.
A clean break below 4180 would activate a deeper bearish trend, likely targeting the broader support zone near 4152.
Pivot Line: 4198
Resistance: 4218 · 4237
Support: 4181 · 4152
BTC/USD - LongBTC/USD is in upward trend on daily timeframe. Following are crucial support and resistance levels.
Support 1 - 91500
Support 2 - 90720
Support 1 - 85440
Support 1 - 83680
Strong Resistance - 94115
Target 1 - 98126
Target 2 - 100607
Keep an eye on these levels. Breakout or Breakdown can happen on 94115. Strong green candle need to be closed above this level and shall sustain for a day or two.
Hoping to see crossing 100000 level before new year.

BTC – Retracement Likely Before Bullish Expansion | Watching 89kBitcoin remains in a strong macro uptrend, but short-term price action is showing signs of exhaustion near the 93k zone. Price rejected this level twice, forming a short-term double top and showing a loss of momentum on the lower timeframes.
On the 45m chart, BTC is slowly breaking below local support, while the 2h shows price sitting high inside a larger ascending channel. A healthy retracement looks increasingly likely before the next impulsive move.
I’m watching the 89,00 –90,000 zone closely, which lines up with:
Mid-range equilibrium
Previous consolidation
Untapped liquidity below
Local FVG imbalance
Trendline support
A sweep into this zone would create a perfect setup for buyers to step back in and continue the higher-timeframe trend.
Macro Context
December typically brings volatility in crypto. With anticipation around December rate decisions, liquidity thinning, and strong bullish positioning in BTC derivatives, a short-term correction would actually benefit the long-term trend.
As long as Bitcoin stays above 85k, the structure remains bullish and any dips are likely to be corrective.
📈 Technical Levels I'm Watching
Major Resistance:
93,200 – 93,800 (strong rejection zone)
96,000 (next major magnet if broken)
Key Support:
90,000
88,500
87,200–87,000 (main demand zone)
85,800 (larger timeframe invalidation)
Bullish Scenario:
A flush into 89k → liquidity grab → reaction → bullish continuation toward 95–96k.
Bearish Scenario (less likely unless macro shocks):
Break and close below 85,800 → deeper correction toward 83k region.
📌 My Trade Planning Outlook
Bias: Bullish on pullback
Looking for continuation long entries around 89,000–90,000, if confirmed with reaction.
Short-term targets:
• 91,500
• 93,000–93,800
Medium-term targets:
• 95,600
• 97,000
As long as BTC maintains the higher timeframe channel structure, I’ll treat dips as opportunities rather than reversals.
Trade Safe,
– JackOfAllTrades

SPX500 | Markets Brace for Powell as Breakout Levels TightenSPX500 – Technical Overview
Markets are entering high-alert mode as traders brace for the most divided
Federal Reserve meeting in years. Futures, bonds, and FX markets are tightening positioning ahead of the announcement, while earnings from NYSE:ORCL and NASDAQ:AVGO Broadcom
will test whether AI valuations can continue to stretch higher.
The futures market is pricing an 89% probability of a quarter-point rate cut to the 3.50–3.75% range, but also expects hawkish guidance, with only a 21% chance of a January cut.
The outcome will heavily depend on the updated dot plot and the communication strategy of
Jerome Powell, especially as uncertainty grows around who will lead the Fed in 2026.
Geopolitical risk is also rising: U.S. sanctions against Russian oil majors RUS:LKOH and RUS:ROSN may reshape the global oil market and energy flows over the coming year.
Technical Analysis
SPX500 is experiencing a bearish push ahead of the Fed decision, targeting 6815 as long as the price remains below 6852.
During the Fed announcement, prices may temporarily spike upward due to volatility and liquidity hunting, but the actual direction will depend entirely on Powell’s tone and guidance.
A shift to bullish momentum requires stability and a confirmed close above 6852, which would open the path toward a new all-time high around 6918.
Pivot Line: 6852
Support: 6815 · 6771
Resistance: 6888 · 6918

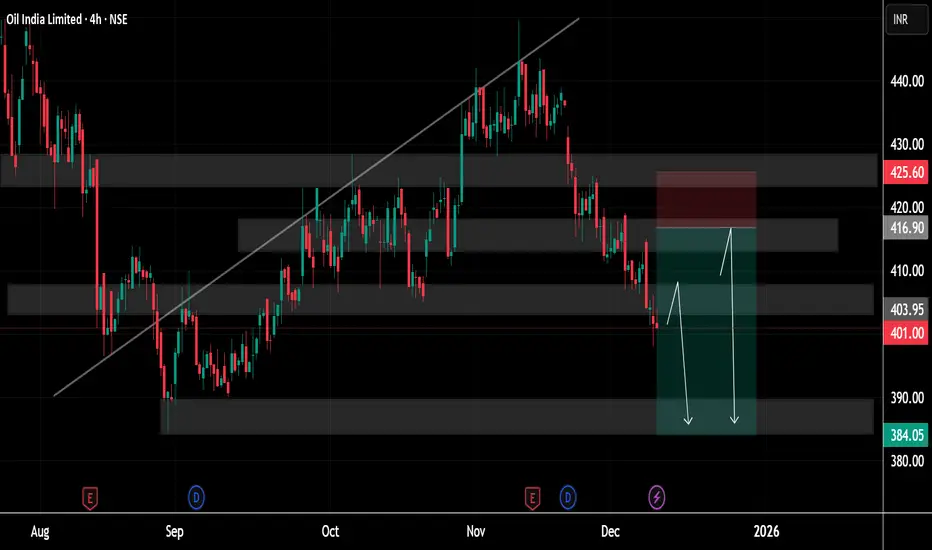
Crude Oil Price Update – Clean & Clear ExplanationCrude Oil highlighting how the market has shifted from a previously rising trend into a phase of weakness. Earlier, the price followed an upward sloping trendline, reflecting steady buying strength, but eventually the price broke below that trendline, signalling the start of a broader correction. Since then, the chart has formed a series of lower highs and lower lows, showing the transition from bullish momentum to a more bearish structure.
Several supply and demand zones are clearly marked on the chart with shaded regions. These zones help identify where buying or selling pressure is strongest. The upper zone near 425–430 represents a major supply area where sellers have previously stepped in and pushed the price down multiple times. Just below it, the 416–420 region shows another resistance area that reinforces the overhead selling pressure.
On the downside, the price is currently trading around the 401 level, where it is testing a mid-level demand zone. The chart shows projected arrows indicating the possibility of the price dipping deeper into the broader demand area around 384–390. This zone has historically acted as a strong support, where buyers could attempt to defend the price again.
The highlighted risk-to-reward box suggests a potential short setup, where traders might expect further downside movement until the price reaches the lower support zone. However, there is also a secondary upward arrow indicating that if the price finds strong support, it may bounce back toward the mid-range resistance near 416, before facing sellers again.
Overall, the chart represents a long-term picture of price correction inside a well-defined supply and demand structure, where the market is currently showing bearish momentum but may find stability and buyers closer to the lower demand zones. The structure reflects how the market is balancing between downward pressure and potential reversal zones, giving a clear roadmap of key levels for future movement.
If you find it helpful please like and comments for this post and share thanks.
SHORT ON US30Us30 has created a head and shoulder pattern at a major supply area/zone.
FOMC is coming out in a few minutes and this could be a major catalyst to US30 falling.
Strictly going off technical's with the chart. Looking to make 1k-2k points.

ALGO Consolidation at Key Support | Spot Long SetupOver the last couple of days, Algorand (ALGO) has been consolidating tightly around a key support level between $0.130 and $0.135. This range has historically held well, acting as a strong base for previous upward moves. The sideways price action here suggests accumulation, with buyers stepping in to absorb selling pressure.
🎯 Trade Idea (Spot Long)
Entry Zone: $0.130 – $0.135
Take Profits: $0.145 / $0.175 / $0.225 / $0.26
Stop Loss: $0.125
This setup offers a favorable risk-reward ratio, especially with confirmation of support holding. The multi-tiered TP approach allows for scaling out profitably.
Always watch for volume confirmation and market sentiment shifts. A breakdown below $0.125 would invalidate the idea. This setup is meant for educational purposes only.

Stop Loss Killers Completed – Bullish Expansion Ahead?After three consecutive Stop-Loss Killers (SLK1, SLK2, SLK3), the market appears to have flushed out remaining buyers and collected liquidity below key lows. This structure often signals the end of a manipulation phase and the beginning of a potential bullish expansion.
With the FOMC rate-cut announcement expected this evening, the market now has both structural and fundamental conditions for an upside move. If the sweep was indeed the final liquidity grab, a rally toward the upper target zone may follow next.

BTC/USD Pair analysis of bullish reversal.BTC/USD Analysis (1H Timeframe)
Price is currently reacting within a bullish market structure. Multiple BOS (Break of Structure) confirmations show buyers gaining control after sweeping the short-term liquidity (SSL). Price has tapped into a POI demand zone around 90,800–91,200, where a potential bullish reversal is expected.
If the demand holds, BTC may continue upward toward the major resistance zone at 95,500–96,000. A clean impulse-correction-impulse structure suggests a possible 5,400-point move from the POI back into resistance.
Summary:
Structure: Bullish after BOS + liquidity sweep
Key Demand (POI): 90,800–91,200
Bias: Expecting reversal from demand zone
Target Zone: 95,500–96,000 resistance
Trend invalidation: Break below SSL
Let me know if you want a shorter or more technical version!
Drop your idea about BTC/USD in the comment section.

Today's market trend analysis and exclusive trading strategy.Gold continued its rollercoaster ride today, with market sentiment clearly shifting ahead of the interest rate decision, resulting in very limited overall volatility. On one hand, the market has largely priced in the rate cut expectations, with a consensus now widely believing there's an over 80% probability of a 25 basis point cut by the Fed. This "expectation fulfilled" market sentiment is unlikely to generate significant volatility unless the outcome surprises us. What truly warrants attention is not the rate cut itself, but rather the post-decision guidance on the interest rate path, including the latest dot plot, economic projections, and Powell's remarks at the press conference. These signals will directly influence the market's assessment of the future pace of rate cuts, especially the policy path in 2026, which will be crucial in shaping the next gold price trend. In this market environment, everyone must maintain a steady pace and avoid greed. With unclear direction and limited volatility, caution with funds is crucial. This type of market is most prone to losses from emotional trading. In the current situation, pay close attention to the bottom and avoid making trades you're not confident in, or taking unnecessary risks. If a clear structure and direction emerge later, I will notify everyone immediately so you can follow the trend. Market opportunities can wait, but risks never wait. Staying calm, seeing clearly, and then acting is the true path to profit.

USNAS100 | Bearish Bias Dominates Below Key LevelsUSNAS100 – Technical Overview
USNAS100 edged higher ahead of the JOLTS job openings report, the final major labor indicator before the Federal Reserve decides on interest rates tomorrow.
Markets are pricing an 89% probability of a 25 bps rate cut, suggesting strong expectations for policy easing.
USNAS100 holds a bearish bias for today, with momentum remaining weak as long as the price stays below 25730.
A 1H close below 25570 will confirm continuation of the bearish trend toward 25430, with deeper downside possible.
However, if the market closes a 1H candle above 25840, bullish momentum will return, opening the way toward 25985 and 26170.
Key Levels
Pivot Line: 25690
Support: 25570 · 25430 · 25210
Resistance: 25830 · 25980 · 26170

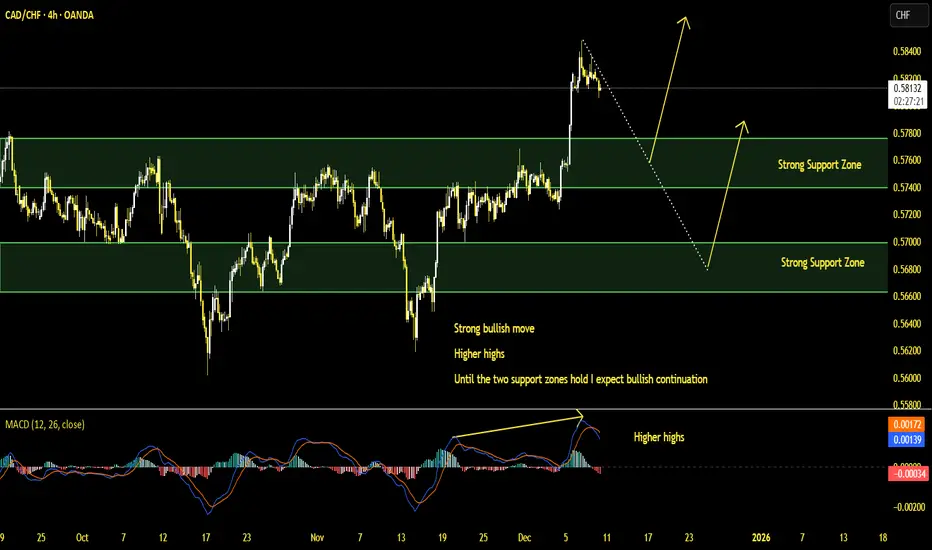
CADCHF Short Term Buy Trading Opportunity SpottedH4 - Strong bullish move
Higher highs
No opposite signs
Until the two support zones hold I expect bullish continuation
👉 If you enjoy this analysis, please Like, Follow, and Support the profile! Your engagement motivates us to share more quality setups.
A BUYa buy at 4199-95, sl at 4185 and tp at 4140 but that will be holding till FOMC and we could see a sell again to clear liquidity below to 4165 area after a push up to clear liquidity first

DeGRAM | GOLD will continue to correct📊 Technical Analysis
● XAU/USD is repeatedly rejecting the 4,220–4,240 resistance cluster, forming lower highs near the main resistance line. A breakdown from the rising support line signals weakening bullish momentum.
● The projection shows a clean move toward 4,145 once price loses the green support zone, aligning with the medium-term descending structure.
💡 Fundamental Analysis
● FXStreet notes gold pressure as U.S. labour strength delays rate-cut expectations, supporting bearish continuation.
✨ Summary
● Short bias: resistance holds; targets 4,180 → 4,145.
-------------------
Share your opinion in the comments and support the idea with a like. Thanks for your support!
