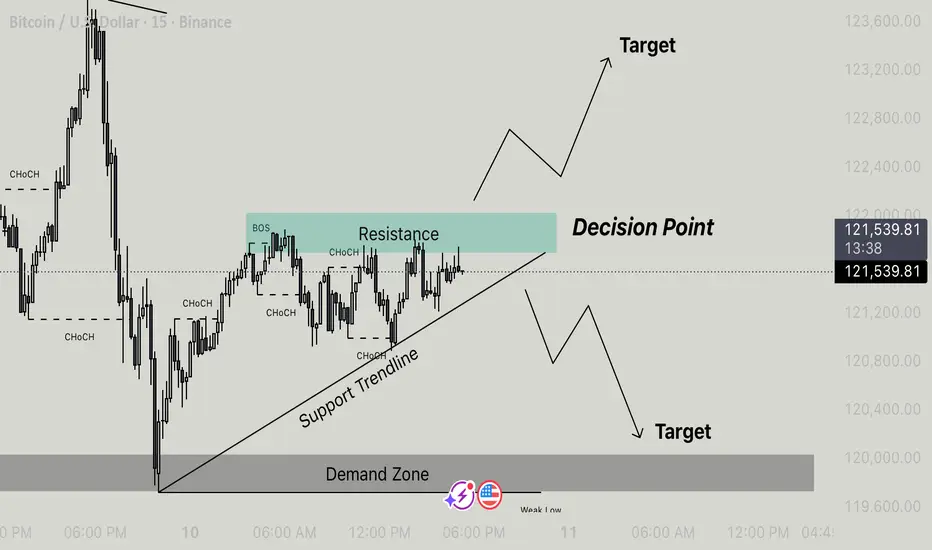
Btcusd - At A Critical Decision Point Bitcoin is currently trading around $121,575, consolidating near a key decision point where price action meets both resistance and the ascending support trendline.
Key Technical Zones
• Resistance Zone: 121,400 – 121,800
This area has acted as a rejection zone multiple times, forming the current decision point.
• Support Trendline: Connecting higher lows, showing bullish structure short-term.
• Demand Zone: 119,600 – 120,200
A strong reaction zone where price previously reversed — potential target if price breaks down.
Market Structure
• Multiple CHoCH (Change of Character) signals indicate short-term range-bound behavior.
• BOS (Break of Structure) confirms local bullish momentum but price is nearing resistance.
• Decision Point: Market could break either way soon, watch for confirmation.
Scenarios
Bullish:
• Break and close above resistance with retest → potential rally toward 122,800 – 123,200 target zone.
Bearish:
• Rejection from resistance or break below support trendline → possible drop toward Demand Zone (120,000 area).
Summary
Price is at a critical juncture — watch closely for breakout or rejection signals around 121,600. Traders should wait for confirmation before entering positions.
Supportandresistancezones
Xau/Usd - Buyers or Bears Next MovePrice on XAUUSD is currently consolidating after forming a change of character (ChoCH) near the decision point. The market has tapped into the previous order block (OB) zone, showing possible rejection from that area. A break above the decision point could confirm bullish continuation towards the strong high and upper target zones. However, if price fails to hold current structure and breaks below the support zone, a bearish move toward the weak low and lower target area can be expected. This is a crucial level where buyers and sellers are likely to decide the next direction of momentum.

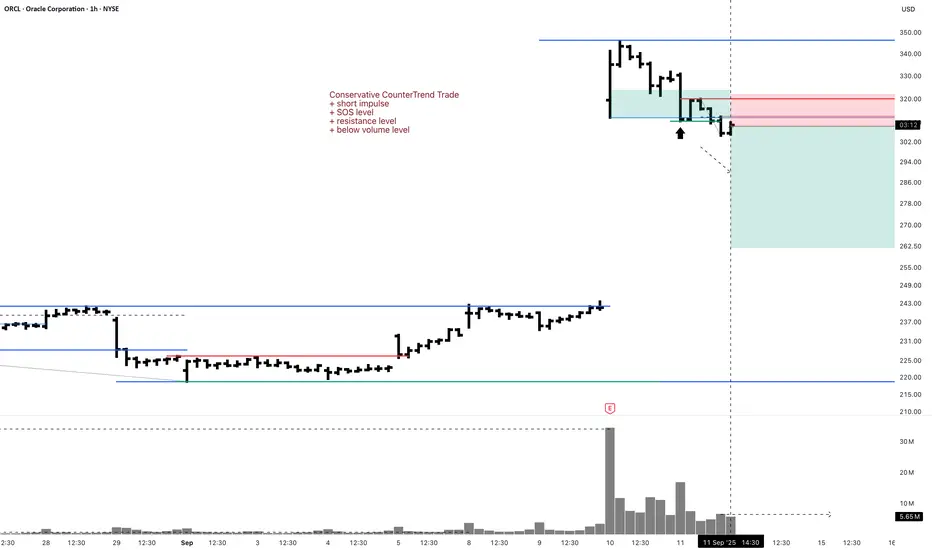
ORCL 1H Short Investment Put PurchaseConservative CounterTrend Trade
+ short impulse
+ SOS level
+ resistance level
+ below volume level
Daily CounterTrend
"- long impulse
+ exhaustion volume
- SOS level"
Monthly CounterTrend
"- long impulse
+ resistance zone
+ volumed interaction bar"
Yearly CounterTrend
"- long impulse
- neutral zone
+ impulse potential reached"
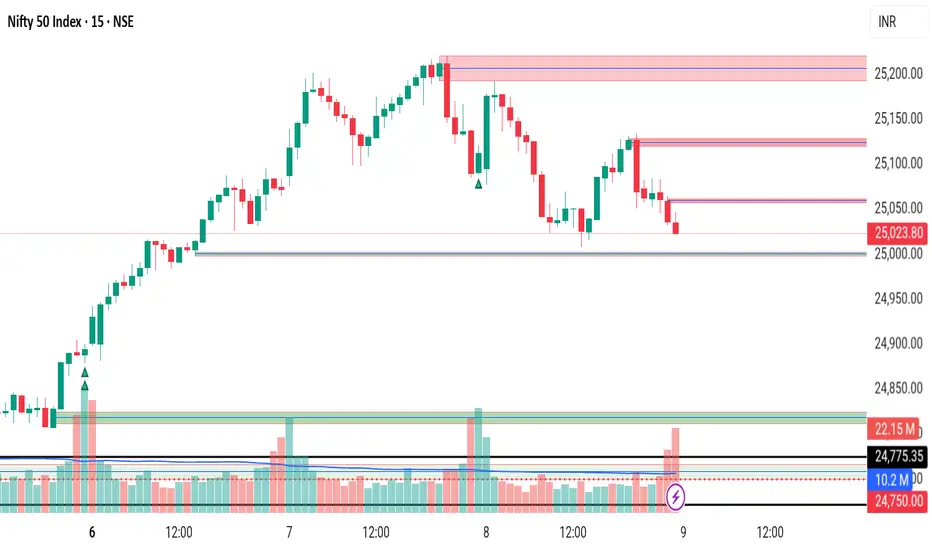
#BankNifty 10th October Friday - #CatchAndRead Bank nifty 10th October Friday - zigzag untadaa - #CatchAndRead
Follow my Yt channel... Link in dp

Eur/Gbp - Ascending Triangle Near Key Resistance Price is currently consolidating just below a key resistance zone (~0.8695–0.8700), forming a clear ascending triangle pattern.
Multiple CHoCHs (Change of Character) and BOS (Break of Structure) indicate recent bullish momentum.
Strong support is established at the 0.8665–0.8670 level, with higher lows pushing price upward.
Scenarios to Watch:
Bullish Breakout:
If price breaks and closes above the resistance and the Strong High, this could confirm bullish continuation.
Target: ~0.87200 zone (measured move and psychological round number).
Bearish Rejection:
A failure to break resistance with a strong bearish reaction could signal distribution and reversal.
Watch for a break of the ascending trendline and a CHoCH below support.
Target: Revisit of the 0.8665–0.8670 support zone or lower liquidity levels.
Trade Ideas:
Breakout buyers can look for confirmation above resistance with volume or retest entry.
Reversal traders should monitor for signs of rejection and trendline break.
Bias: Neutral–Bullish (Awaiting breakout confirmation

ETHUSD 30-MIN – Holding Zone Reaction Ahead BITSTAMP:ETHUSD
Market Overview
After sweeping liquidity from the upper rejection zone, ETH experienced a controlled sell-off, reaching into the strong blue holding zone. The current structure shows early signs of absorption and a potential W-shaped reversal forming. If buyers defend this area, we could see a breakout toward the 4 535 and 4 672 reaction zones. Otherwise, failure to hold this block could drive price deeper toward the yellow demand base for the next bullish reload.
Key Scenarios
✅ Bullish Case 🚀 → 🎯 Target 1 : 4 435 | 🎯 Target 2 : 4 535 | 🎯 Target 3 : 4 672
❌ Bearish Case 📉 → 🎯 Target 1 : 4 250 | 🎯 Target 2 : 4 100 (deeper demand)
Current Levels to Watch
Resistance 🔴 : 4 435 – 4 672
Support 🟢 : 4 280 – 4 100
⚠️ Disclaimer: This analysis is for educational purposes only. It is not financial advice.

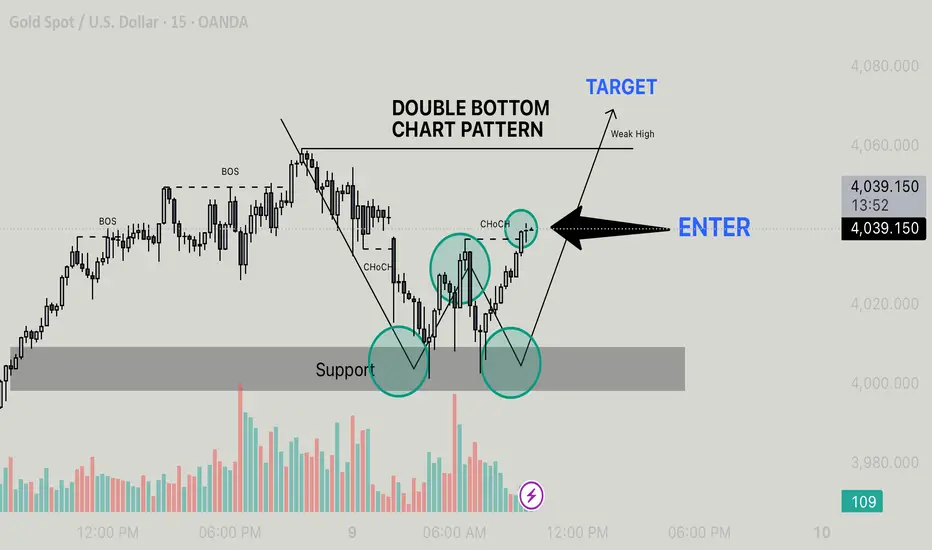
Xau/Usd - Double Bottom Breakout & Bullish Reversal Support Zone: Price tested a key support level (gray area) twice, forming a classic Double Bottom pattern.
CHoCH (Change of Character): After the second bottom, price broke above the previous minor high, signaling a potential reversal from bearish to bullish.
Volume Confirmation: Increased buying volume at the second bottom supports bullish momentum.
Trade Plan:
Entry Point: Marked at 4,037.260 after confirmation of CHoCH and bullish candle close above neckline.
Target: Aiming for the Weak High area (prior resistance level).
Risk Management:
Stop Loss: Below the second bottom and support zone (approx. < 4,000 level).
Risk-Reward: Minimum 1:2 to weak high.
Bullish Bias Justification:
Double Bottom pattern indicates accumulation.
CHoCH confirms early trend reversal.
Break of Structure (BOS) aligns with bullish continuation.
Clear breakout from bearish trendline adds confluence.
Sol/Usdt - Breakout Or BreakdownResistance Zone
A green shaded area labeled "Resistance" indicates a key price level where price has previously failed to break higher.
This is a supply zone where sellers have stepped in multiple times.
Price has tested this resistance area several times but failed to break out convincingly.
2. CHoCH (Change of Character)
"CHoCH" is marked below the resistance, signaling a trend shift from bullish to bearish.
Typically, a CHoCH occurs when price breaks a recent higher low—indicating weakening bullish momentum and potential start of bearish move.
3. Decision Point
Labeled in blue as “Decision Point”.
This is a critical area where price may:
Break above and confirm a bullish continuation.
Reject and fall, confirming bearish pressure.
This zone could be used to plan entries based on confirmation (e.g., breakout or rejection).
4. Target Scenarios
Two possible scenarios drawn with arrows:
Bullish scenario: If price breaks above the decision point/resistance, the next target lies in the upper 230s or beyond.
Bearish scenario: If price rejects from this zone, it could lead to a bearish continuation, targeting lower support levels.
5. Volume
Volume bars at the bottom show varying levels of interest.
Increasing red volume toward the CHoCH indicates strong selling pressure.
Conclusion / Trading Plan
Watch the Decision Point zone closely.
Bullish bias: On a breakout with strong volume and bullish candle close above resistance.
Bearish bias: On rejection from the resistance zone with a lower high and a strong bearish candle.
Use tight risk management due to the proximity of volatility around the decision point.

USD/JPY - SUPPORT REJECTION AND BULLISH MOMENTUM SHIFTUSDJPY on the 15-minute timeframe is showing a bullish setup after a clear reaction from the support zone. Price formed a short-term Change of Character (ChoCH), signaling a potential shift in momentum from bearish to bullish. The pair tapped into the support area aligned with previous structural lows, followed by a rejection candle, confirming buyer interest.
The Tokyo session created liquidity below support, which has now been swept, and price is showing strength toward the upside. A long entry opportunity is identified around 152.56–152.57, anticipating continuation toward the weak high as the next liquidity target.
As long as price remains above the support base, bullish momentum is expected to extend toward the target zone near 152.90–153.00. A break below the support would invalidate this bullish setup.

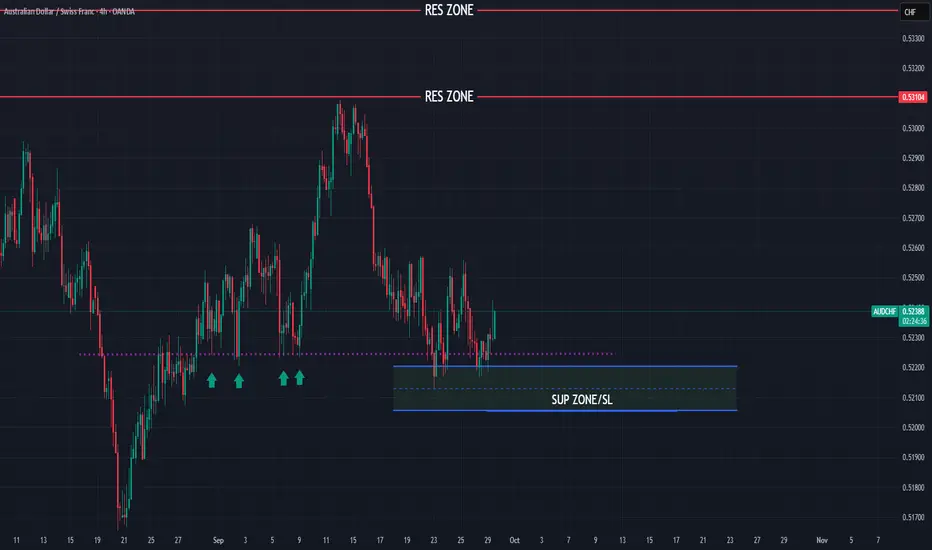
AUDCHF new bullish expectations
OANDA:AUDCHF interesting chart, around 10 times price is bounce on EL zone 0.52230, in week before we are have SNB.
On 9.Sep on this pair we are not see some stong bullish push, soon after price is make revers.
Currently for this week, on this zone expecting new stronger bullish push.
SUP zone: 0.52200
RES zone: 0.53100, 0.53400
Johnson & Johnson Bulls Break the FlagJohnson & Johnson has been in a strong uptrend, with buyers consistently driving price higher. After the impulsive rally, price consolidated into a downward-sloping flag, where sellers tried to take control but failed to push lower. Buyers then stepped back in, breaking out of the flag with strength.
That’s our long entry signal, confirming buyers are firmly in control and positioning for continuation toward the next target around 190.
The fundamentals for J&J are mostly supportive: strong earnings, raised guidance, strategic acquisition add weight to bullish bias and the technical outlook. But stay alert to catalysts that could turn sentiment fast.

US100: Imbalance rejection – Bears back in control
🧠 SKILLING:US100 Technical Analysis
🧱 Resistance Zone (Imbalance)
• The 24,900 – 24,950 area acts as a strong resistance, overlapping with a supply/imbalance zone.
• Price has reacted bearish from this level, showing clear selling pressure.
• This is a potential area to look for short (Sell) setups.
________________________________________
📉 Current Market Structure
• After a sharp bullish retracement, price formed a rising channel 🔵.
• However, inside the highlighted circle, price has broken down from the channel — indicating weakening bullish momentum.
• This breakdown supports a short bias in the short term.
________________________________________
💡 Trade Plan
• Bias: Look for Sell setups near the resistance zone.
• Confirmation: Wait for a small pullback and a new lower high before entering short.
• Target (TP): Toward the Support zone 24,740 – 24,868 (previous bottom).
• Stop Loss (SL): Above resistance at around 24,950 – 25,000.
________________________________________
🟢 Support Zone
• The 24,740 – 24,780 area is the previous bottom, where price previously bounced strongly.
• This level might attract profit-taking from sellers or temporary buying interest.
________________________________________
⚠️ Risk Notes
• If price closes above 25,000 (H1 candle), the bearish scenario becomes invalid.
• Manage position sizing carefully and wait for clear confirmation before entering a trade.
________________________________________
🧭 Summary
• Short-term Trend: 🔻 Bearish correction
• Mid-term Trend: 🔄 Sideways – waiting for a breakout of either 24,740 or 25,000.
• Current Opportunity: Sell from resistance → Target support zone
Please like and comment below to support our traders. Your reactions will motivate us to do more analysis in the future 🙏✨
Harry Andrew @ ZuperView

US30: Consecutive breakouts signal an emerging downtrend
SPREADEX:DJI – When price rejects the high, the market begins to shift
On the 30-minute chart, price action is clearly signaling a loss of bullish momentum and a transition toward a bearish structure.
________________________________________
🧠 Price Action Analysis
1. First Failed Breakout
Price initially broke above the ascending trendline that had held since early October — but failed to hold the breakout.
➤ A classic early warning of buyer exhaustion, often seen during distribution phases.
2. Multi-Layered Resistance Zone
The 46,725 – 46,779 region has become a clustered resistance zone, rejecting price repeatedly.
➤ Multiple rejections here suggest dominant selling pressure, with strong supply overhead.
3. Second False Breakout
A more subtle second breakout attempt followed — but again, price was swiftly rejected.
➤ Consecutive failed breakouts typically indicate a lack of conviction and precede sharp reversals.
________________________________________
📉 Trend Structure Has Shifted Bearish
• Lower highs and lower lows now visible
• Price broke below the previous trendline
• Pullback attempts failed to reclaim broken support
• Market is respecting resistance instead of support
➡ These are clear signs of a short-term downtrend emerging.
________________________________________
🔻 Trading Strategy: Favoring Sell Setups in the New Bearish Context
✴️ Scenario 1: Sell at Retest of Proven Resistance Zone
• Optimal Sell Zone: 46,700 – 46,750
• This area has already triggered two failed breakouts — a third touch could be the ideal trap for late buyers
• Watch for bearish rejection candles (pin bars, bearish engulfing, etc.)
Suggested Sell Limit Order:
→ Entry: 46,730
→ Stop Loss: 46,830 (above prior swing high)
→ TP1: 46,500
→ TP2: 46,300
→ Risk-Reward: At least 1:2
_______________________________________
✴️ Scenario 2: Momentum Sell on Breakdown of Local Support
• Trigger Level: 46,580 — if price breaks below with strong momentum (long red candle, increased volume)
• Confirms trend continuation after consolidation
Suggested Sell Breakout Order:
→ Entry: 46,580
→ Stop Loss: 46,680
→ Target: 46,350 – 46,200
→ Tip: Use smaller position size if breakout appears weak to avoid getting trapped in a fakeout
________________________________________
🎯 Trade Management
• Only enter trades with clear price rejection or momentum confirmation
• Move SL to breakeven after TP1 is hit to lock in safety
• Exit the trade if price closes above 46,830 — that would invalidate the bearish thesis
________________________________________
False breakouts leave a trail — for those who know how to read it. It's not a failure. It’s the market whispering that direction has changed.
Please like and comment below to support our traders. Your reactions will motivate us to do more analysis in the future 🙏✨
Harry Andrew @ ZuperView

Eth/Usd - Decision Point At Key Resistance ZoneEthereum is currently approaching a crucial resistance zone around the 4710 level, marked as a major decision point. Price has shown multiple Breaks of Structure (BOS) in the past, confirming active liquidity on both sides. The highlighted zone represents a critical area where market direction could shift based on reaction strength.
If buyers maintain momentum and successfully break above the resistance with solid bullish candle closures, a continuation move toward the upper target zone (around 4780–4800) can be expected. This would confirm a short-term bullish structure and potential sweep of the weak high.
However, a strong rejection from this decision point could trigger a bearish reaction, leading to a downside move toward the lower target zone near 4660–4640. Traders should watch for clear signs of market structure shift (CHoCH) and volume confirmation before entering.

Xauusd - OrderBlock Rejection Setup to 4000 TargetPrice action on the 15m chart shows a strong bullish structure with multiple BOS (Break of Structure) and CHoCH (Change of Character) points, confirming trend reversal to the upside. Price is currently pulling back after hitting a weak high, suggesting potential for a retracement before further continuation.
Key zones:
Order Block (OB) and FVG (Fair Value Gap) overlap: High-probability demand zone for entries.
Price is expected to break the support trendline and retrace into the OB/FVG zone for a liquidity sweep.
Entry confirmation: Wait for a rejection candle within the OB zone for long setup.
Target: 4000 psychological level, aligned with liquidity above recent highs.
This setup aligns with smart money concepts — wait for price to grab liquidity before entering in the direction of the trend.

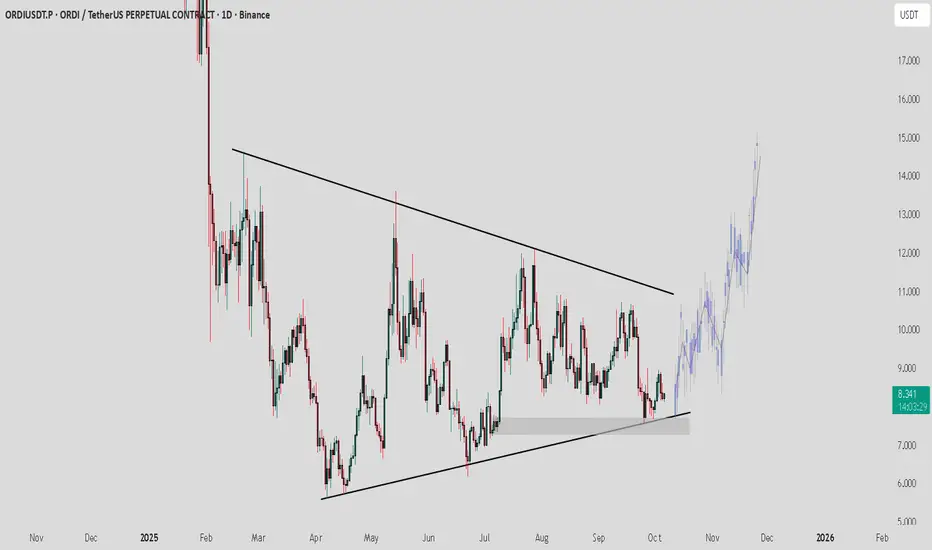
ORDI / USDT : Looking in a good momentum for a rallyORDI / USDT has bounced from strong support and is showing positive momentum. If this strength continues, we could see a bullish move towards $10 – $12 – $15 in the coming days.
Keep a close watch on momentum and manage risk wisely.
NOTE : Breakdown from support will invalidate this setup
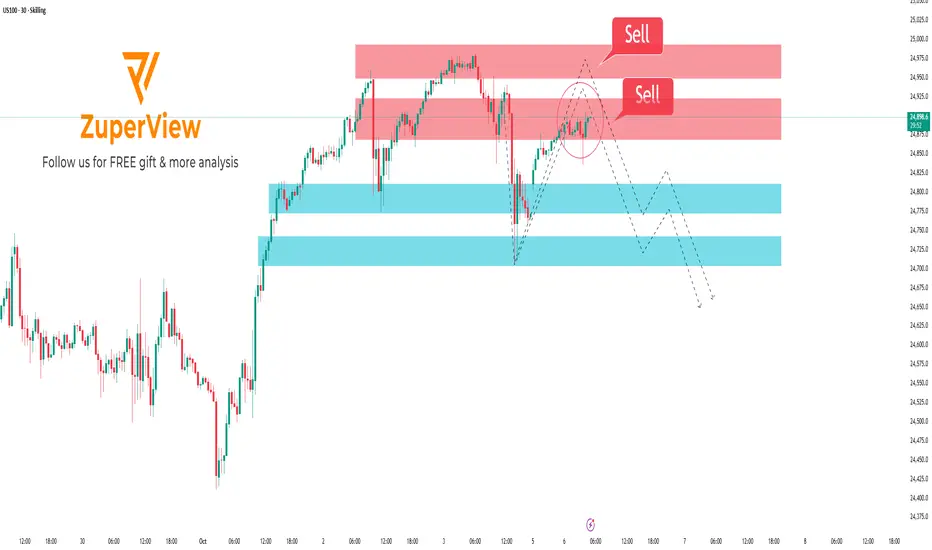
US100: Strong resistance sell setup on the 30-minute chart
📈 SKILLING:US100 — Technical Analysis: Sell Setup Near Strong Resistance
🔍 Technical Analysis:
• Currently, US100 price is approaching a significant resistance zone (highlighted in red). This area has acted as a strong ceiling in recent sessions, where sellers tend to emerge.
• The price has rallied back after a sharp decline but is showing signs of slowing momentum as it nears this resistance. This often leads to a rejection rather than a clean breakout, especially on a 30-minute timeframe.
• Below, the light blue zones represent key support levels, which could serve as realistic targets if sellers regain control. These zones are important areas where buyers previously stepped in, creating potential bounce points.
• The drawn dashed lines illustrate a possible price path: a test of the resistance level, failure to break higher, followed by a pullback and continuation of the downward trend.
• For confirmation of the sell setup, traders should look for reversal candlestick patterns such as rejection wicks (long upper shadows), bearish engulfing candles, or pin bars at the resistance zone. These signals help validate that sellers are gaining dominance.
• Volume and momentum indicators should also be monitored for divergence or weakening bullish pressure near resistance to strengthen the case for a sell.
📊 Trade Considerations:
• Entering a sell position should be done only after clear confirmation of price rejection at resistance.
• Setting a stop loss slightly above the resistance zone helps manage risk in case of a false breakout.
• Targets can be placed near the support zones (light blue areas), with partial profit-taking to lock gains while allowing some position to run if price reacts there.
📌 Summary:
The technical structure of US100 on the 30-minute chart suggests a high probability of price reversal from the strong resistance area. A cautious sell setup is favored, waiting for confirming price action signals to reduce risk. Proper risk management is essential to navigate potential volatility near this key level.
Please like and comment below to support our traders. Your reactions will motivate us to do more analysis in the future 🙏✨
Harry Andrew @ ZuperView
Usd/Jpy - Bullish Rejection From Demand ZoneUSDJPY is currently maintaining a strong bullish market structure after a clear break of structure to the upside, indicating buyer dominance and momentum continuation. Price has been moving impulsively and is now expected to retrace toward the highlighted demand zone, where liquidity collection and possible reaccumulation may occur. This zone is considered a key reaction area where institutional buyers could step back in to push the price higher. A rejection candle confirmation from this level will strengthen bullish confidence, validating the continuation of the uptrend. Once rejection and structure shift confirmation are observed, price is anticipated to create a new higher low and continue rallying toward the target zone near 150.400, which aligns with previous highs and liquidity resting above the weak high. As long as price remains above this key demand zone and shows bullish rejection, the overall bias stays bullish with potential for further upside expansion.

Heres a GOOG Breakout SETUP!! (1HR)Still in a wedge, but my bias leans towards bullish. Watching for a clean breakout above 247.64 for confirmation.
My Targets are 247.64 → 251.65 → 254.77
⚠️ This is not financial advice just my personal analysis. Always do your own research before trading or investing.

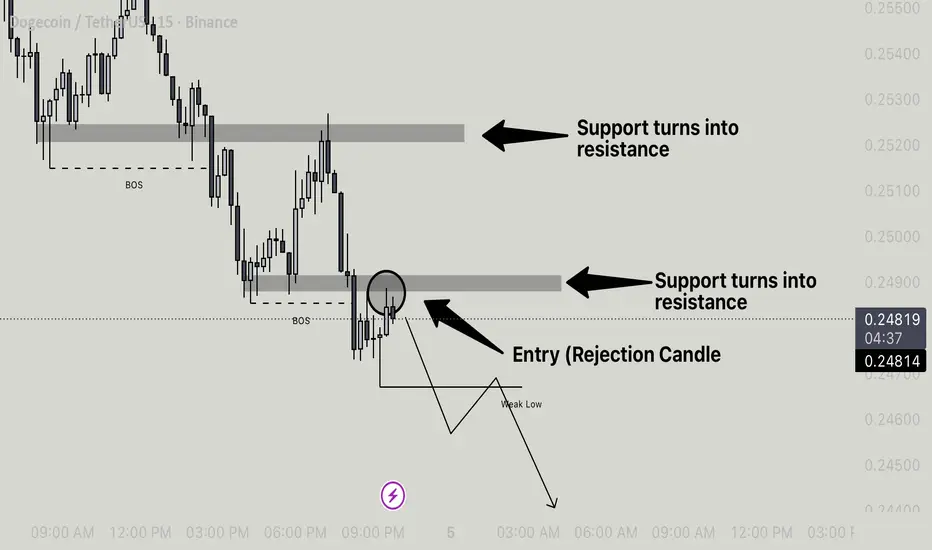
Doge/Usdt - Support Turned Resistance With BOS Bearish Setup 1. Support Turned Resistance (STR)
• The price initially had a support zone that later got broken.
• After the breakdown, that same zone is now acting as resistance (highlighted grey zones).
• This confirms a bearish shift in structure.
2. BOS (Break of Structure)
• The BOS mark shows that a previous low was broken, indicating bearish market intent.
• This is often used by traders to confirm continuation in the downward direction.
3. Rejection Candle (Entry Point)
• After the BOS, the price retraced back into the resistance zone (previous support).
• A rejection candle formed inside that zone, signaling sellers are defending it.
• This is the entry trigger for a short trade.
4. Weak Low & Target
• The chart suggests that the recent low is weak and likely to be taken out.
• The target is placed below that weak low, expecting continuation to the downside.
Trade Idea Summary
• Bias: Bearish
• Entry: On rejection candle at support-turned-resistance.
• Confirmation: BOS already occurred, validating bearish structure.
• Target: Below weak low (marked).
• Stop Loss: Should be placed slightly above the resistance zone (not shown but recommended).
This setup is a classic support-turned-resistance with BOS confirmation—a strong bearish continuation pattern.
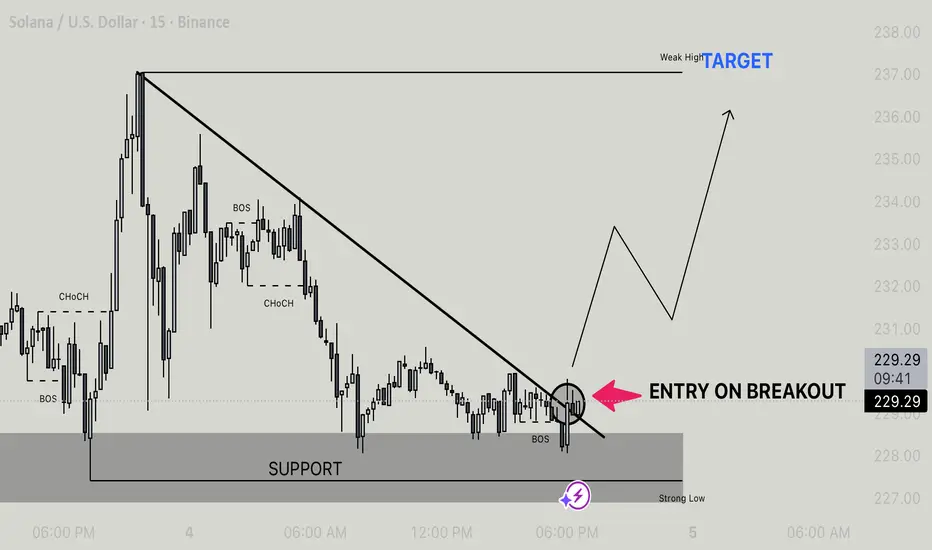
Sol/Usdt - Bullish Breakout Setup From Support Price has been consolidating around the support zone after a strong bearish move. We can observe multiple BOS (Break of Structure) and a clear descending trendline acting as resistance.
• Currently, price is testing the support zone and forming a potential trendline breakout setup.
• Entry confirmation will be on a clean breakout above the descending trendline (marked area).
• Once the breakout occurs, price is expected to retest and then push higher towards the weak high liquidity area, with the next target around 236–238.
Plan:
• Entry: On breakout + retest confirmation.
• Target: 236–238 (weak high).
• Invalidation: A strong break below the support zone would invalidate this bullish setup.
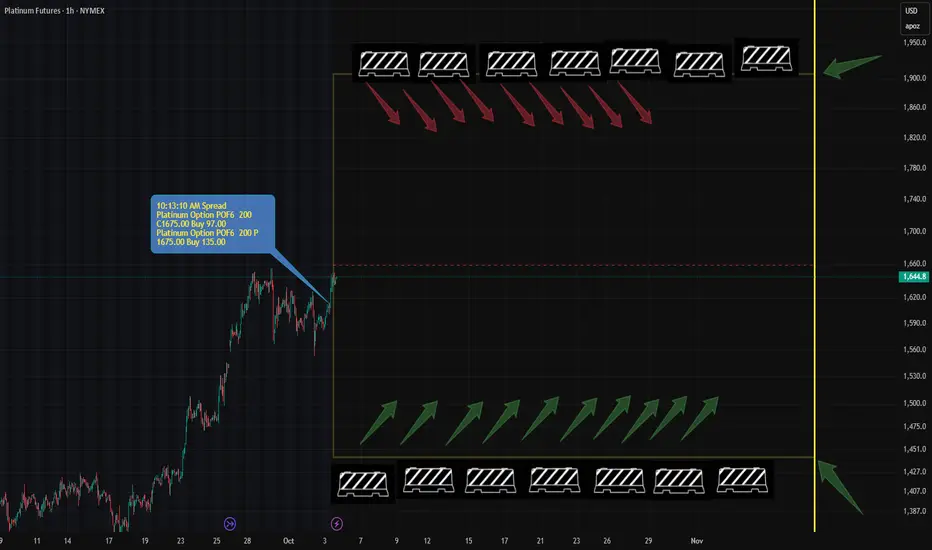
A Major New Straddle Just Hit Platinum — Here’s What It MeansAfter yesterday’s CME session, a significant options portfolio appeared in platinum (PL) with expiry in 75 days.
Structure: A classic Straddle, opened at the central strike
Cost: A hefty $2 million
Break-even points:
Lower: 1443
Upper: 1907
(Marked on the futures chart)
At first glance, this looks like a bet on massive volatility — profit only kicks in after price moves beyond either break-even level.
But here’s the catch:
If you’re thinking "How can anyone profit from such wide boundaries?" —
👉 You're thinking in the right direction.
The owner likely doesn’t need price to go beyond these levels.
Instead, they’re positioning for a smarter play.
Once price approaches either boundary closely, the straddle can be transformed using synthetic logic:
Near 1443 → convert into a risk-free Сall
Near 1907 → convert into a risk-free Put
These synthetics would be immediately at breakeven — no losing leg.
Just pure directional exposure, funded by the original premium.
Given the size, this is not retail.
This is someone who knows exactly what they’re doing — and will act rationally near these extremes.
📌 So what does it mean for us?
These break-even levels aren’t just technicals —
They become high-probability zones for trade entries:
Short setup near 1907
Long setup near 1443
I’d recommend watching both closely.
I certainly will planning my trades around them.