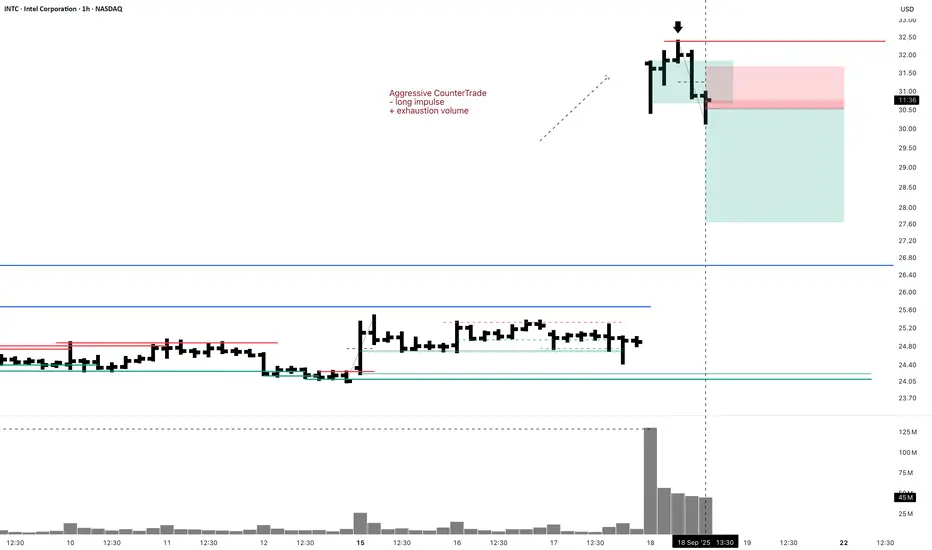
INTC Short Swing 1H Aggressive CounterTradeAggressive CounterTrade
- long impulse
+ exhaustion volume
Daily CounterTrend
"- long impulse
+ expanding CREEK level
+ exhaustion volume
+ too high"
Monthly Trend
"+ short impulse
+ T2 level
+ resistance level
+ 1/2 correction"
Yearly Trend
"- long impulse
+ correction
- 1/2 of impulse
- biggest volume"
Supportandresistancezones
GBPUSD1H Short Call
GBPUSD
Support Break (which earlier was stong resistance now was acting as support on confirmation
Short trade Is valid)
Manage your risk and rewards
📊 Key Data Just Released: US UN-Employement Claims
FUNDAMENTALS:
Unemployment Claims: 231K (better than forecast 241K, and much better than 264K prior) → labor market stronger.
Philly Fed Manufacturing: 23.2 (blowout vs 1.7 forecast, -0.3 prior) → economic activity hotter.
👉 This means:
Labor market is not weak, economy looks stronger than expected.
So the 25 bps cut last night will be seen as normal easing, not aggressive.
Aggressive cut scenario is off the table for now, unless Fed signals future cuts.

GBP/USD - Channel Breakout @ H1 (BoE Interest Rate Today)CMCMARKETS:GBPUSD GBP/USD - Channel Breakout with strong volume and today BoE Interest Rate, it gives high movement.
"The Fed is still signalling more rate cuts, but at the same time still sees okay growth, which is a positive combination for share markets"
The Fed reduced rates by a quarter point on Wednesday, as expected, and indicated it will steadily lower borrowing costs for the rest of this year, initially sending the dollar plunging.
Support by Likes and Comments.
Thank you.

USDJPY after FOMC bullish continuation expected
FX:USDJPY expectations are be bearish strong after we are have break of zone 147.000, yesterday after FOMC, today we have changes in market and some volatility.
Price pushing strong bullish and for nextp eriods here exepcting bullish continuation
SUP zone: 147.300
RES zone: 149.100, 149.700

EURUSD LONG 15MThe trend still bullish, It will go short first then fulfill the unmitigated imbalance. This is just my analysis sorry if i'm wrong.

HINO📊 HINO (PSX) Analysis (One can also buy on current market price)
🔎 Fundamentals
🚌 Buses & Trucks: Orders surged 80% 🚀
💰 Undervalued Price → Attractive entry point for long-term investors
📈 Earnings Growth: EPS improved to 4.67 ✅
🤝 MFTBC (Mitsubishi Fuso Truck & Bus Corp.) agreement with HINO → backed by a 100% publicly listed global player 🌍
📉 Technicals
📍 3 Accumulation Areas → Strong buying interest spotted
📊 Trendline Break (Daily) → Closed at 562 → ✅ Buy Signal
🔄 Support Bounce: Price moves in the 562–582 range → Ideal Buy Zone
⚡ If Support Breaks: Next attractive Buy Zone → 360–390
Note: (One can also buy on current market price)

Review and plan for 18th September 2025 Nifty future and banknifty future analysis and intraday plan.
Stock picks.
This video is for information/education purpose only. you are 100% responsible for any actions you take by reading/viewing this post.
please consult your financial advisor before taking any action.
----Vinaykumar hiremath, CMT

QQQ - Todays Support and Resistance LinesHey Followers,
Here are the support and resistance lines for Sep 16th, 2025, only valid till the end of the day.
If the price comes from the bottom towards a line, then the line becomes a resistance line.
If the price comes from the top towards a line, then it becomes the support line.
I use 2min and 5min to trade these lines on 0dte options.

XAUUSD Short: Correction After the All-Time HighHello, traders! The prior market structure for XAUUSD was a prolonged consolidation range, from which the price broke out with significant bullish momentum. This breakout initiated a powerful upward trend, with the price auction pushing through multiple resistance levels to establish a new all-time high. This marked the climax of the recent buying initiative.
Currently, following the peak at the ATH, the market has entered a corrective phase. Sellers have taken control in the short term, and the price is now declining from the highs. The auction is presently challenging the first major demand zone located between 3585 and 3570, but the bearish momentum appears strong.
The primary scenario anticipates a continuation of this corrective move. The expectation is that the current 3570 demand level will fail to hold against the selling pressure. A confirmed breakdown below this demand zone would validate the short thesis and open the path for a deeper correction towards the main ascending trend line. The take-profit is therefore set at 3565, targeting the area immediately following this breakdown. Manage your risk!

USD/CAD - Bearish Flag (15.09.2025)The USD/CAD Pair on the M30 timeframe presents a Potential Selling Opportunity due to a recent Formation of a Bearish Flag Pattern. TRADENATION:USDCAD
This suggests a shift in momentum towards the downside in the coming hours.
Possible Short Trade:
Entry: Consider Entering A Short Position around Trendline Of The Pattern.
Target Levels:
1st Support – 1.3814
2nd Support – 1.3796
🎁 Please hit the like button and
🎁 Leave a comment to support for My Post !
Your likes and comments are incredibly motivating and will encourage me to share more analysis with you.
Best Regards, KABHI_TA_TRADING
Thank you.

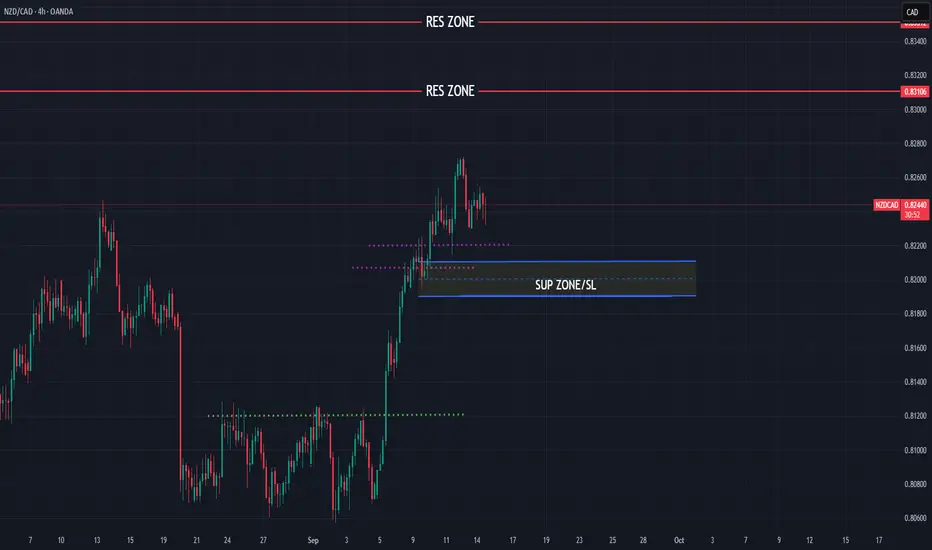
NZDCAD still bullish view
OANDA:NZDCAD we are have strong bullish push, currently price in consolidation zone, still here for next periods we can expect bullish.
SUP zone: 0.82100
RES zone: 0.83100, 0.83500
XAUUSD Gold Trading Strategy September 15, 2025XAUUSD Gold Trading Strategy September 15, 2025: Weekly trend outlook, gold still has enough conditions for the possibility of continued price increases.
Basic news: After surpassing the 3670 USD/ounce mark, the highest level in history, the gold price has entered a correction phase, in the context of the market focusing on monitoring the policy moves of the US Federal Reserve (Fed). According to CME's FedWatch tool, investors are almost certain that the Fed will cut interest rates by 25 basis points, bringing the margin to 4 - 4.25%. However, the scenario of the Fed cutting 50 basis points is still considered, because this could cause the USD to plummet and push gold to skyrocket.
Technical analysis: The sideway range of 3600 - 3660 is still holding. Currently, we will wait for trading points at the 2 edges of the sideway range, but the priority is still mainly trading according to the trend.
Important price zones today: 3600 - 3605 and 3660 - 3665. Today's trading trend: Sideway.
Recommended orders:
Plan 1: BUY XAUUSD zone 3600 - 3602
SL 3597
TP 3605 - 3615 - 3635 - 3665 - OPEN.
Plan 2: BUY XAUUSD zone 3618 - 3620
SL 3615
TP 3623 - 3630 - 3650 - 3665.
Plan 3: SELL XAUUSD zone 3663 - 3665
SL 3668
TP 3660 - 3650 - 3640 - 3630 (small volume).
Wish you a new week of safe, effective and profitable trading.🥰🥰🥰🥰🥰

Gold Analysis – Is the Correction Over?Yesterday I maintained my bias that OANDA:XAUUSD correction could extend lower, with 3570 as the focus for the next swing low. I even sold rallies above 3640 zone with that scenario in mind.
However, after the CPI release, Gold dipped to 3620 zone but quickly recovered. That prompted me to lock in a modest 100 pips gain rather than fight the market.
A wise move in hindsight, since Gold is now back testing the 3650+ resistance zone.
So, is the correction finished?
➡️ Most probably, yes.
Here’s why:
• Bulls are defending the 3620 zone, stepping in strongly on dips.
• The chart is shaping into a rectangle, typically a continuation pattern, which suggests consolidation before trend resumption.
• Momentum is aligning again with the broader bullish trend.
Trading Plan:
• As long as 3620 holds, my strategy shifts to buying dips instead of selling rallies.
• A break above 3660 would open the path for continuation, with 3700 as the next bullish milestone.
The market has spoken – the correction seems to be losing steam, and the trend is ready to reassert itself. 🚀
TSLA Support & Resistance Lines for September Month 2025TSLA’s September map uses the same monthly bands. Expect faster moves and occasional overshoots; size accordingly.
30-minute for 2–3-day swings
Longs
Rejection at lower band: Buy back toward half-step; add on clean midline reclaim.
Acceptance + retest: Hold above a line and retest from the top → ride to next line.
Shorts (when price trades above lines)
Volatility fade: TSLA often overshoots the upper band. If a 30-min prints a wicky close back inside, short the fade.
- Targets: Nearest half-step, then midline.
- Stop: Above the overshoot high (give TSLA a bit of air).
UTAD-style failure: If TSLA holds above a band briefly but fails the retest (can’t sustain closes above, sellers reclaim), short on the first failed retest.
- Targets: Half-step → next line down.
- Invalidation: Clean 30-min close back above the failed line.
Management
Scale at each line; go flat if a 30-min close invalidates your level. Trail quickly after TP1—TSLA snaps.
1–3 hour for weekly swings
Bias
Acceptance above midline → continuation to the next band.
Rejection at upper band → path back to midline more likely.
Shorts
1–3h exhaustion above band: Bodies compress, momentum fades, then a close back inside → short toward the half-step/midline.
Break-and-fail sequence: Close above a band → lose it → retest from below fails → short continuation lower.
Risk: Stop just above the lost line; tighten on first target tag.

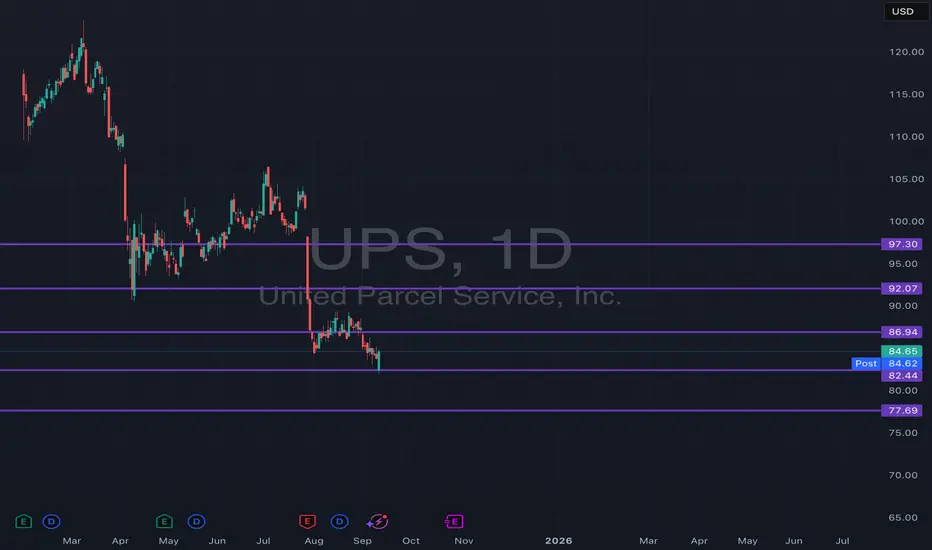
UPS Support & Resistance Lines for September Month 2025This chart highlights September’s monthly support and resistance bands for UPS, built as “guardrails” around the month's price action. The outer bands mark the expected extremes, while the inner (half-step) lines act as intermediate pivot zones where price often pauses, flips, or accelerates. Think of them as a pre-mapped playbook for the month: upper band = supply, lower band = demand, with the midlines guiding targets and risk.
How I trade it
30-minute for 2–3 day swings
Setup: I wait for a 30-min close into a band (upper or lower) plus a clear reaction (wick rejection, momentum fade, or structure break).
Entry: Fade the move back toward the nearest midline when the reaction confirms; or ride a continuation if price accepts above/below a band and retests it from the other side.
Targets: First target is the nearest half-step line, second is the opposite half-step, final is the far band if momentum persists.
Risk: Stop goes just outside the band (for fades) or just back inside the band (for breakouts). If the 30-min closes back through my line, I’m out—no questions asked.
Management: Scale out at each line; move stops to break-even after TP1.
1–3 hour for weekly swings
Bias: I align 1h/2h/3h trend with where price sits relative to the monthly bands. Acceptance above a midline favors continuation to the next line; rejection at a band favors a mean-revert path.
Entry: Use a retest of the broken line on 1–3h candles for confirmation (close-through → retest → resume).
Targets: Next line on the map; let winners run to the next higher-timeframe band if structure holds.
Risk: Stop beyond the reclaimed line; I tighten weekly as soon as we tag the first target zone.
Playbook cues
Rejection at outer band → look for fades back to midline.
Acceptance and hold beyond a band → trade continuation into the next zone.
Stalls at half-step → take partials or tighten stops; these levels often “decide” the next leg.
Use the bands to plan entries, exits, and invalidations before the move. No predictions—just rules around predefined levels for September.
GBPJPY still bullish expectations
OANDA:GBPJPY price is make bullish push, then we are have BULLISH FLAG created, in this week price is making zig-zag moves in zone, today its make break, which taking for bullish confirmation.
SUP zone: 199.400
RES zone: 200.600, 201.400

META Sep 2025 Monthly Support & Resistance LinesOverview:
These purple lines act as Support and resistance lines when the price moves into these lines from the bottom or the top direction. Based on the direction of the price movement, one can take long or short entries.
Trading Timeframes
I usually use 30min candlesticks to swing trade options by holding 2-3 days max. Anyone can also use 3hr or 4hrs to do 2 weeks max swing trades for massive up or down movements.
I post these 1st week of every month and they are valid till the end of the month.

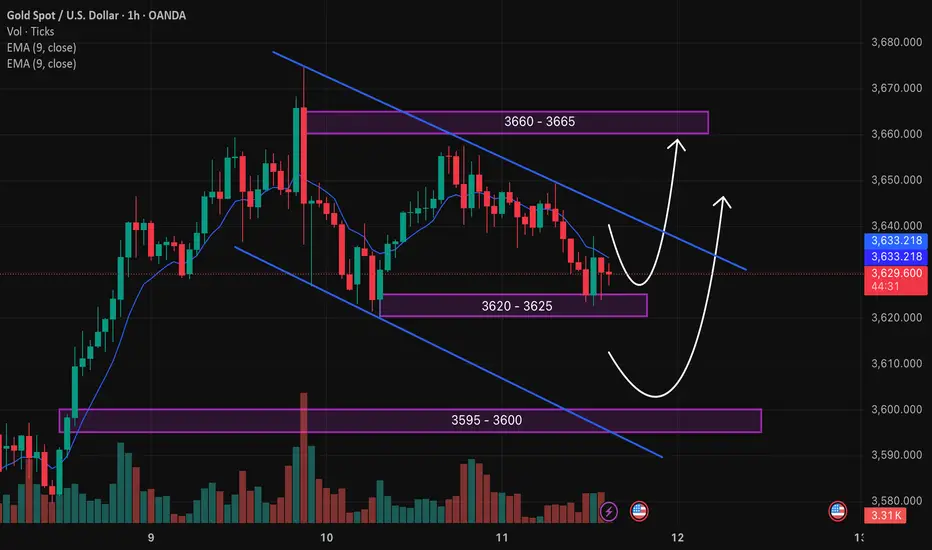
Gold Trading Strategy XAUUSD 11/9/2025Gold Trading Strategy XAUUSD 11/9/2025: Gold is stable, traders prepare ahead of important US CPI data, conditions and technical positions to watch.
Fundamental news: Spot gold prices were generally stable in today's Asian trading session, currently around $3630/ounce. Gold prices are in a wait-and-see mode, closely watching the all-time high before the release of US CPI data for August. Weak US PPI inflation data, fueling speculation that the Federal Reserve will continue its easing cycle at its upcoming meeting in September.
Technical analysis: After making the latest ATH at 3675, gold prices are correcting and forming a short-term downtrend channel in the H1 frame, however, the 3620 - 3625 area is still a good support zone for gold prices. Currently, there will be 2 scenarios with the highest probability of occurrence: Case 1: Gold price will form an upward price pattern around the 3620 - 3625 area and increase sharply, we will wait for the reaction when the price meets resistance at 3660 - 3665. Case 2: Gold price continues to follow the downtrend channel to the lower support area of 3595 - 3600 and then increase again. We will trade based on these 2 scenarios and still prioritize trading according to the main trend.
Important price zones today: 3620 - 3625, 3595 - 3600 and 3660 - 3665.
Today's trading trend: BUY.
Recommended orders:
Plan 1: BUY XAUUSD zone 3620 - 3622
SL 3617
TP 3625 - 3635 - 3645 - 3665 - OPEN.
Plan 2: BUY XAUUSD zone 3598 - 3600
SL 3595
TP 3603 - 3610 - 3630 - 3660 - OPEN.
Plan 3: SELL XAUUSD zone 3663 - 3665
SL 3668
TP 3660 - 3650 - 3640 - 3630 (small volume).
Wish you a safe, effective and profitable trading day.🌟🌟🌟🌟🌟
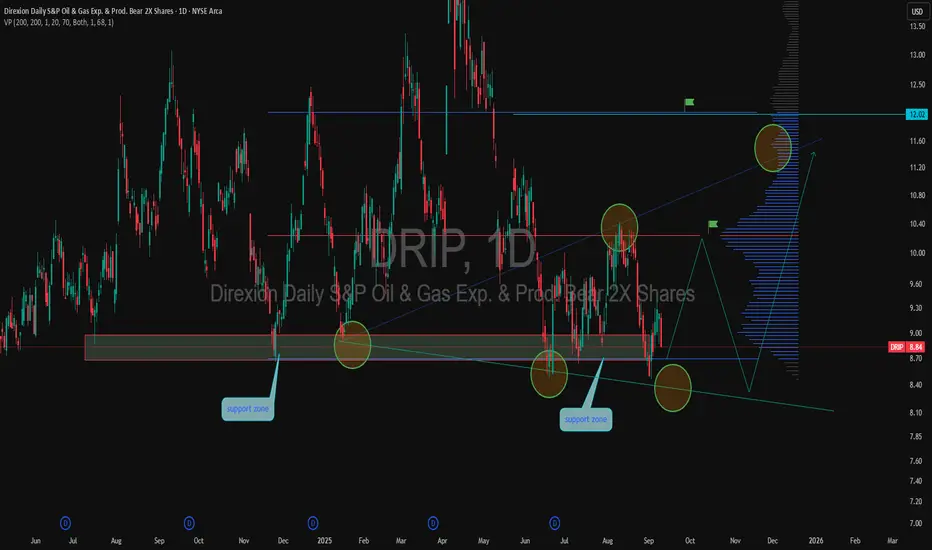
DRIP potential rebound from support zoneDRIP is consolidating near the key support area of 8.40–8.60. Over the past few months, this level has been tested multiple times, creating a strong base for a possible rebound. If local resistance around 9.50–10.00 is broken, the price may extend toward 11.20 and 12.00. However, a breakdown below support could trigger a move toward 8.00.
From a fundamental perspective, DRIP reflects the dynamics of the oil and gas sector, where pressure on producers remains high. In the current market environment, DRIP can serve as a hedge against rising oil prices.
GBP/USD - Breakout (US - CPI Data) (11.09.2025)The GBP/USD Pair on the M30 timeframe presents a Potential Selling Opportunity due to a recent Formation of a Breakout Pattern.
This suggests a shift in momentum towards the downside in the coming hours.
Possible Short Trade:
Entry: Consider Entering A Short Position around Trendline Of The Pattern.
Target Levels:
1st Support – 1.3475
2nd Support – 1.3441
🎁 Please hit the like button and
🎁 Leave a comment to support for My Post !
Your likes and comments are incredibly motivating and will encourage me to share more analysis with you.

AUD/USD - Bullish Channel (10.09.2025) The AUD/USD pair on the M30 timeframe presents a Potential Buying Opportunity due to a recent Formation of a Bullish Channel Pattern.
This suggests a shift in momentum towards the upside and a higher likelihood of further advances in the coming hours.
Possible Long Trade:
Entry: Consider Entering A Long Position around Trendline Of The Pattern.
Target Levels:
1st Resistance – 0.6636
2nd Resistance – 0.6658
🎁 Please hit the like button and
🎁 Leave a comment to support for My Post !
Your likes and comments are incredibly motivating and will encourage me to share more analysis with you.
Best Regards, KABHI_TA_TRADING
Thank you.
Disclosure: I am part of Trade Nation's Influencer program and receive a monthly fee for using their TradingView charts in my analysis.

EURUSD – Weakness Ahead?For over a month, EURUSD has been stuck in a choppy range:
• Support: 1.1580 zone
• Resistance: just above 1.1700
As always, such tight consolidations usually precede strong moves. The question is: which way?
🔑 Factors pointing lower:
1. On the DXY, I expect a potential upside reversal – most bad news is already priced in.
2. Yesterday’s reaction to the NFP revision → USD strength, not weakness, which confirms the shift in sentiment.
3. A false break above resistance on EURUSD adds to the bearish case.
📌 Conclusion:
I expect further EURUSD weakness, with confirmation if the price breaks below 1.1650.
