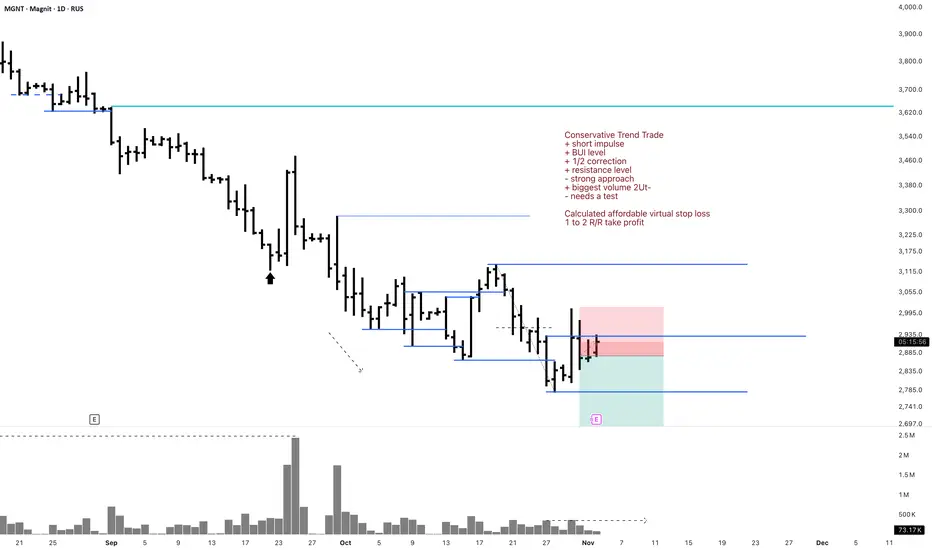
MGNT Conservative Trend TradeConservative Trend Trade
+ short impulse
+ BUI level
+ 1/2 correction
+ resistance level
- strong approach
+ biggest volume 2Ut-
- needs a test
Calculated affordable virtual stop loss
1 to 2 R/R take profit
Daily Trend
"+ short impulse
+ BUI level
+ 1/2 correction
+ resistance level
- strong approach
+ biggest volume 2Ut-
- needs a test"
Monthly Trend
"+ short impulse
= neutral zone type 2
+ continuation of the trend"
Yearly CounterTrend
"- long impulse
- T2 level
- support zone
- 1/2 correction
- biggest volume Sp?
+ long setup
+ model doesn't work"
Supportandresistancezones
XAU/USD Intraday Plan | Range-Bound Before Next MoveGold continues to trade in a tight range, holding just above the MA50 and approaching the MA200, as buyers attempt to regain short-term control. The metal is currently hovering around 4025, with price consolidating below the 4042 resistance — a key barrier that has capped upside attempts in recent sessions.
If bulls manage a clean break above 4042, the next resistance stands at 4090, followed by 4120. However, failure to break higher could see price rotate back toward 3990 and the First Reaction Zone (3957–3918) for potential support.
A deeper pullback below 3918 would shift focus toward the Support Zone (3884–3851) and the HTF Support Zone (3820–3781) — areas where stronger buying interest has previously emerged.
📌 Key levels to watch:
Resistance:
4042
4090
4120
Support:
3990
3957
3918
3884
🔎 Fundamental Focus:
The ongoing U.S. government shutdown, now in its fifth week, has significantly disrupted the release of key economic data, leaving traders with limited insight into the real state of the U.S. economy.
This uncertainty is keeping market sentiment cautious, with investors closely watching the few reports still being released — such as ISM Manufacturing PMI today — for clues on growth and inflation.
The lack of reliable data continues to support safe-haven demand, with gold remaining sensitive to any signs of progress toward resolving the shutdown.

Gold Congestion: Clear Levels, Unclear DirectionAfter forming a local low at 3887 last week — a level perfectly aligned with the October ATH area — OANDA:XAUUSD started to recover from the recent 5k pips decline, retesting the 4050 resistance zone, which previously acted as strong support.
Since mid-last week, price action has entered a consolidation phase. Despite high intraday volatility, the structure is beginning to compress into a clear congestion pattern.
This range, roughly 1k pips wide, provides traders with well-defined reference points:
- Support: 3950–3960 zone – a break below this area would likely reopen the path toward the recent 3887 low.
- Resistance: 4040–4050 zone – a confirmed breakout above could trigger a continuation toward 4150.
At this stage, I am slightly bullish, given the sharp rejections from 3920 last week and the emerging ascending triangle structure, which often precedes upward continuation.
Still, confirmation is required — the market must decide whether this congestion is accumulation or distribution.

GBP/AUD - Bearish Flag Pattern in H1GBP/AUD – Sell Entry (H1 – Flag Pattern)
The GBP/AUD Pair, Price has been trading within a Flag Pattern on the H1 chart, forming consistent lower highs and lower lows. Price action is now testing the lower boundary of the pattern, signalling a possible breakdown.
✅Market Context:
1️⃣Downward structure building inside the pattern.
2️⃣Sellers are showing strength near support levels.
3️⃣Breakdown below the trendline indicates momentum continuation toward lower zones.
✅Trade Plan:
Entry: Sell after confirmed breakdown below the support (Candle close below trendline or retest of the breakout).
💰Take Profit (TP): At the Key Zone – major support area identified ahead.
🛑Stop Loss (SL): Above the pattern structure / recent swing high.
✅Psychological Discipline:
1️⃣Stick to plan – No Revenge Trades.
2️⃣Accept losing trades as part of the strategy.
3️⃣Risk only 1–2% of your account balance per trade.
💬 Support the community: If you found this useful, drop a 👍 like and share your thoughts in the comments!
⚠️ Disclaimer: This analysis is for educational purposes only and does not constitute financial advice. Forex trading involves high risk. Trade only with capital you can afford to lose and always do your own research.

AUD/JPY - M30 - Bullish Channel FormationAUD/JPY – Buy Entry (M30- Channel Pattern)
The AUD/JPY Pair, Price has been trading within a Channel Pattern on the M30 chart, forming consistent higher highs and higher lows. Price action is now testing the upper boundary of the Pattern, signalling a possible breakout.
✅Market Context:
1️⃣Strong Upward Structure Inside the Pattern.
2️⃣Buyers are showing strength near Resistance.
3️⃣Breakout above the Trendline indicates Momentum continuation toward higher zones.
✅Trade Plan:
Entry: Buy after Confirmed Breakout above the Resistance (H1 candle close above trendline or retest of the breakout).
💰Take Profit (TP): At the Key Zone – a Major Resistance area identified ahead.
🛑Stop Loss (SL): Below the Pattern Structure.
✅Psychological Discipline :
1️⃣Stick to plan – No Revenge Trades.
2️⃣Accept losing trades as Part of the Strategy.
3️⃣Risk only 1–2% of your account balance per trade.
💬 Support the community: If you found this useful, drop a 👍 like and share your thoughts in the comments!
⚠️ Disclaimer: This analysis is for educational purposes only and does not constitute financial advice. Forex trading involves high risk. Trade only with capital you can afford to lose and always do your own research.

Trading Rejection Strategy- A Visual Backtest💡 Overview
Here is everything you need to know about the strategy. But before you study it any further, all the visuals are at the end of this post- so don't miss that part.
This setup is built upon simple beliefs:
▶Price always remembers its key levels- Previous Day’s High (PDH), Previous Day’s Low (PDL)
▶Strong support/resistance zones often act as liquidity magnets.
▶When price revisits these areas and fails to break through, it gives us a clear rejection and that’s where the edge lies.
⚙️ Core Conditions
➡Price rejects PDH or PDL
➡Price retests a breakout / breakdown zone
➡Price rejects a tested support / resistance level
➡Timeframe: 15-Minute
➡Type of trade: Intraday only
➡Only one trade per day
🎯 Trade Plan
🔘Entry: One tick above/below the Pin Bar or reversal candle close
🔘Stop Loss: Just beyond the high/low of the rejection candle
🔘Target: Next liquidity zone (recent 15m swing or PDH/PDL)
🚫 Avoid Trading When:
➡No rejection at liquidity levels
➡Risk > 20 points
📊 October Backtest Results
(1 trade per day, tested manually)
Total trades taken= 14
Winners= 6
Losers= 8
Total points made out of winner= 263
Total points lost in losers= 75
Net points made= 188
🧠 Takeaway
Even though the backtest covers only October, the results are encouraging.
The logic is built on price behavior around institutional levels, and that tends to hold steady across time.
📈 Try extending the backtest further:
If results remain consistent, this could become a reliable rejection-based intraday setup worth adding to your toolkit.
Here is a visual to guide to all the Entries, Exits and about how it went.
Enjoy the charts and do let me know what you think about this strategy or if I missed an opportunity ;)
📣Disclaimer:
Everything shared here is meant for education and general awareness only. It’s not financial advice, nor a recommendation to buy, sell, or hold any asset. Do your own research, manage your risk, and make sure you understand what you’re getting into.
EURCHF from here expecting new bullish
OANDA:EURCHF price in PA moving, long time we are not see some big moves, we are have one time bullish push on 6.8, but price is revers again and we are now on bottom line of PA.
From here expecting higher bullish continuation.
SUP zone: 0.92500
RES zone: 0.93600, 0.94100

GBPUSD- A Matter of Divergence🔗 Market has Memory
The phrase 'the market has memory' stems from the observation that prices often react when they revisit previously significant levels- such as former highs, lows, or areas of intense trading activity. This phenomenon reflects not randomness, but the collective memory of market participants.
Investors and traders tend to remember key price zones where strong buying or selling once occurred. When the price returns to these levels, the same psychological triggers are reactivated: those who missed the prior move may see it as a renewed opportunity, while others who were previously trapped at that level may use the occasion to exit or reduce exposure.
Thus, these price zones acquire emotional and financial significance over time. The market’s so-called 'memory' is not inherent to the charts themselves, but rather a mirror of recurring human behavior- shaped by experience, regret, and anticipation - expressed through collective trading decisions.
💥 GBPUSD Technical Perspective
On the long-term GBPUSD chart, price has exhibited a clear tendency to respect the 1.31400 zone. This level has acted as a strong demand base twice- first in May 2025 and again in August 2025- each time resulting in a notable upward reaction. The pair has now retraced to the same region, suggesting that market participants continue to recognize 1.31400 as a historically validated support zone, a reflection of the market’s 'memory'.
The following two divergences further strengthen this bullish bias:
➥ RSI Divergence:
We can observe that the price made a lower low B but the RSI has failed to make a corresponding lower low. This indicates that downside momentum is weakening despite the price weakness. Such a bullish divergence often precedes a reversal or at least a corrective bounce, as it shows sellers losing strength.
➥ Volume Divergence:
Similarly the recent decline B occurred on diminishing volume compared to the earlier sell-off at A. Also when the price tested at C there is far less volume activity. This reduction in trading activity implies a lack of conviction among sellers. When prices fall but volume contracts, it suggests that the selling pressure is drying up - a potential precursor to demand resurgence and a price rebound.
👉 What to Expect
The confluence of a well-established support zone, RSI bullish divergence, and volume divergence strengthens the probability of a technical rebound from the 1.31400 area towards 1.32850 or 1.33250 zone.
However, a confirmed higher low or a bullish candle formation would offer more reliability before initiating long exposure. A decisive action below 1.31400 would negate this view.
📣 Disclaimer:
Everything shared here is meant for education and general awareness only. It’s not financial advice, nor a recommendation to buy, sell, or hold any asset. Do your own research, manage your risk, and make sure you understand what you’re getting into.
Your money, your responsibility; and if you’re unsure, ask a qualified financial professional. (Or at least run it by your pet - they’re great listeners 🐶).

OKE 1D Investment Short Conservative Trend TradeConservative Trend Trade
+ short impulse
+ T2 level
+ resistance zone
+ biggest volume Ut
+ weak test?
Bought a put
1 to 2 R/R ratio
1M Trend Trade
"+ short impulse
- neutral zone"
1Y CounterTrend Trade
"- long balance
+ biggest volume resistance level
+ volumed reaction bar"

Balances and Imbalances in Gold🔴 Why Point of Control (POC) Acts as Strong Support or Resistance to Create a Balance
In a Volume Profile, the Point of Control (POC) represents the price level where the highest traded volume occurred during a specific period. This level attracts attention because it reflects the fairest price accepted by both buyers and sellers.
➥ In an Uptrend:
When the market is trending higher, previous POCs often act as strong support zones. Traders who missed earlier entries tend to buy when price revisits these high-volume levels, believing them to be fair-value areas within the broader uptrend. Moreover, institutional participants often reload positions near the POC since liquidity is abundant there.
In short, when price revisits a past POC during an uptrend, demand tends to emerge again, creating a bounce from that level.
➥ In a Downtrend:
Conversely, in a downtrend, previous POCs act as strong resistance zones. What was once a fair price for buyers now becomes a fair price for sellers. Market participants who were trapped at higher levels use these zones to exit or add fresh short positions. Thus, when price rallies toward a prior POC, supply often re-enters, leading to rejection or a pullback. In this backdrop, let's discuss Gold chart.
🔴 Gold Chart Analysis in This Context
In the above 1H chart of Gold, the relationship between price and POC is clearly visible.
➥During the earlier part of the chart, Gold is in an uptrend. Each time the price retraced, it found support around the previous session’s POC. These levels acted as liquidity zones, where strong buying interest reappeared, helping the price continue its upward leg. This repetitive structure created a classic “staircase” pattern - each rally was followed by a controlled pullback to the prior POC, confirming the zone as a demand base.
➥However, as momentum shifted, Gold entered a downtrend. In this phase, the same POC logic flipped - price began reacting bearishly around previous POCs. Each time the market attempted to rally, it stalled or reversed near those old value areas, signaling that sellers were defending the former fair-value levels. This behavior turned prior supports into resistance shelves, reinforcing the bearish control.
➥Currently, price seems to be retesting one such POC zone near the $4000 zone. If sellers maintain control, the next leg lower could unfold toward the next lower-volume pocket or untested POC zone. But before that we need some sign of weakness near 4000- shortening of the thrust/lack of buying interest/impulsive selling etc. before pulling the trigger or else 4125 to 4150 might be on the cards.
What do think at this point? Will it pass through the resistance zone or react sharply back to 3900.
Do comment and 🚀

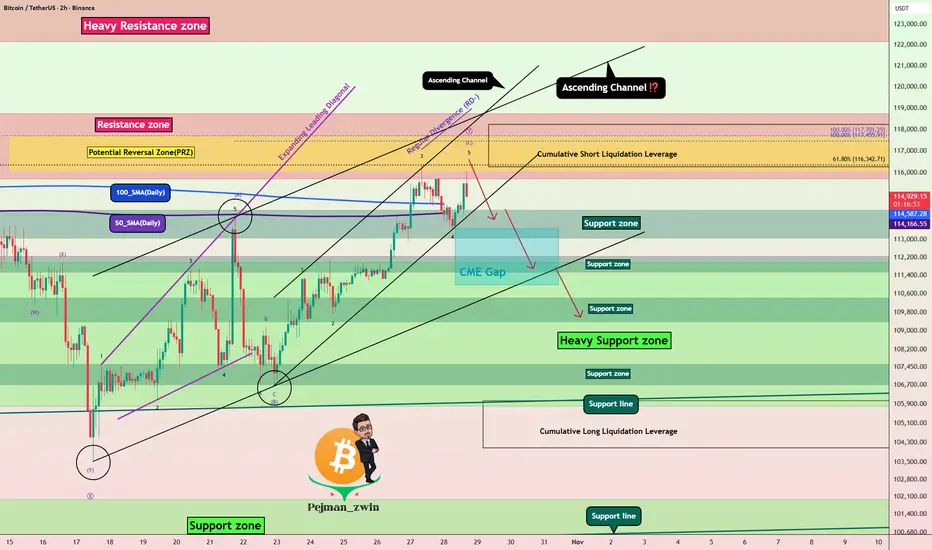
Bitcoin Hits PRZ – Time for a Correction?As I expected yesterday , Bitcoin ( BINANCE:BTCUSDT ) did drop down to the Support zone($114,300-$113,000) at the lower line of the ascending channel and then started rising again today. Both Long and Short positions basically hit their Targets .
At the moment, Bitcoin is moving near a Resistance zone($118,740-$115,740) , the Potential Reversal Zone(PRZ) , and Cumulative Short Liquidation Leverage($118,224-$116,281) .
From an Elliott Wave perspective , it seems like Bitcoin is completing the microwave 4 of the microwave C of the main wave Y . There's a noticeable Negative Regular Divergence(RD-) between the last two peaks, which suggests some weakening momentum .
I expect that Bitcoin won't break through the Resistance zone($118,740-$115,740) easily and may fall back at least to the Support zone($114,300-$113,000) . If it drops below the 100_SMA(Daily) and 50_SMA(Daily) , we could see a deeper decline and possibly the CME Gap($113,495-$110,990) being filled.
Note: Another point to mention is that although the SPX500( TVC:SPX ) has been hitting new all-time highs as the new week began, BTC has shown a bit less correlation with it in the last day. So if the S&P 500 undergoes a correction, Bitcoin might actually see a sharper pullback, which is something to watch out for as a potential negative factor for Bitcoin.
Note: Also, keep in mind that tomorrow, some important U.S. economic indices will be released, which could also influence the market. So definitely factor that into your considerations.
Note: In general, the crypto market in the past couple of weeks has been heavily influenced by news around U.S.-China tariffs. Any headline can cause Bitcoin and other tokens to swing up or down, so keep an eye on those geopolitical headlines.
Cumulative Long Liquidation Leverage: $106,033-$104,090
Please respect each other's ideas and express them politely if you agree or disagree.
Bitcoin Analysis (BTCUSDT), 2-hour time frame.
Be sure to follow the updated ideas.
Do not forget to put a Stop loss for your positions (For every position you want to open).
Please follow your strategy and updates; this is just my Idea, and I will gladly see your ideas in this post.
Please do not forget the ✅' like '✅ button 🙏😊 & Share it with your friends; thanks, and Trade safe.
USDCHF bearish view
OANDA:USDCHF wahts next, price moving in RECTANGLE, in this week having some signs CHF can continue domination.
We are see break of zone today, having bearish view here.
SUP zone: 0.79700
RES zone: 0.78600, 0.78300

XAU/USD | Testing Deeper Support ZoneYesterday’s analysis is playing out as expected — the first support zone has failed, and price is now testing the Deeper Support Zone (3,944–3,884). The continued downside momentum confirms that sellers remain firmly in control, with short-term sentiment still leaning strongly bearish.
Gold is currently trading around 3,930, holding well below both the MA50 and MA200, reinforcing ongoing downside pressure. If buyers can defend this zone and push price back above 3,987, a corrective rebound toward 4,042 and 4,095 could follow.
However, a clean break below 3,884 would likely open the door for a deeper decline toward 3,820–3,781, where dip-buyers may look to re-enter the market.
📌 Key levels to watch:
Resistance:
3944
3987
4042
4095
4137
Support:
3884
3820
3781
Despite the current correction, the overall bullish trend remains intact, with the recent sell-off seen as a healthy correction within the broader bullish trend.
🔎 Fundamental Focus:
It’s a big week for the U.S., with the FOMC rate decision and press conference on Wednesday expected to draw most of the market’s attention.
Before that, traders will be watching Consumer Confidence and Pending Home Sales data today.
The backdrop remains tense with the U.S. government shutdown still unresolved, keeping overall sentiment cautious across markets.

XAU/USD Intraday Plan | Gold Rebounds Ahead of FOMCPrice is respecting the analysis well — after testing the Deeper Support Zone (3944–3884), gold saw a strong rejection. Price has since rebounded and is now trading around 4017, showing signs of short-term recovery after several sessions of heavy downside pressure.
Gold has reclaimed the 4000 handle and moved back above the MA50, while also breaking the 1H structure to bullish. However, price still trades below the MA200, suggesting that short-term momentum has turned bullish.
For continuation, buyers need to secure a close above 4042, which could open the path toward 4095 and 4137.
On the downside, if price fails to hold above 3987, we could see another retest of 3944–3884, the same zone where buyers previously stepped in.
📌 Key levels to watch:
Resistance:
4042
4095
4137
4178
Support:
3987
3944
3884
3820
🔎 Fundamental Focus:
All eyes are on the FOMC events later today, with the Federal Funds Rate, FOMC Statement, and Press Conference scheduled in the evening.

INTC Swing Long Conservative Trend Trade Conservative Trend Trade
+ long impulse
+ expanding T2 level
+ support level
+ unvolumed 2Sp
+ volumed test
+ below first bullish bar closed level entry
Calculated affordable virtual stop loss
1 to 2 R/R take profit
Daily Context
"+ long impulse
+ SOS level
+ support level
+ unvolumed Sp"
Monthly Context
"+ long impulse
+ SOS level
+ support level
+ 1/2 correction"
Give me a way better price at afterhours.
I just need my 2 R and I'm out!

DXY — The Market UpdateDXY — The Market Therapist’s Take
🧭 Context
The U.S. Dollar sits between 98.613 and 98.143 — the high and low from Tuesday, October 21.
That zone still controls the market’s psychology.
Price is absorbing every order above and below it — a quiet accumulation phase that looks like chaos, but isn’t.
The question isn’t “where next,” it’s “who’s still trapped inside.”
📐 Technical Map
Daily structure remains bullish range, while weekly and monthly dynamic maps stay bearish.
Four months straight, price has rotated through the same rhythm — collecting both buy and sell stops across cross-assets.
It’s not indecision; it’s design.
If 98.613 breaks, we open expansion higher.
If 98.143 gives way, next pivot becomes the target.
🌐 Fundamental Pulse
The dollar’s not crashing — it’s unwinding its old story.
For two years, the script was simple: high yields, safe haven, strong America.
Now, traders are rewriting the plot.
Prediction markets show a 40% chance of a U.S. recession in 2025.
Rate-cut expectations jumped from one to three.
Meanwhile, Germany’s €500 B infrastructure and defense plan signals a new fiscal identity for Europe — and money follows that kind of momentum shift.
📊 Volume & Order Flow Map
Volume tools mark 98.197 as the month’s Volume Key line.
Close above it, and the bias turns bullish — potential for expansion.
Close below, and we remain in a controlled range.
This is no accident — it’s liquidity engineering.
Volume flow reveals the intention behind every candle.
🎯 Plan
Price symmetry holds mid-range, trapping traders chasing both sides.
In this kind of terrain, in-and-out execution is survival, not fear.
Stay inside structure until the market itself declares direction.
The currency game isn’t random — it’s orchestration.
When you can’t hold bias, hold discipline.
When price hides intent, follow volume.
Institutional Logic. Modern Technology. Real Freedom.

Capital.com: Crude Oil Sells US OIL Sell Setup – Bearish Structure
US Oil is showing signs of renewed bearish momentum after rejecting a key daily resistance zone. On the 1-hour timeframe, price has confirmed a lower high formation, followed by a decisive break below a key intraday support level—now acting as resistance. This shift in structure suggests potential continuation to the downside, with momentum favoring sellers as long as price remains below the reclaimed zone.
Technical Highlights:
Bearish structure confirmed on the 1H timeframe
Clean break and retest of structure
Momentum building for a potential push toward lower levels
Trade Setup:
Entry: 61.02
Stop Loss: 61.56
Target Levels:
Take Profit 1: 60.59
Take Profit 2: 56.34
This setup offers a favorable risk-to-reward ratio within a well-defined bearish structure. Wait for candle confirmation below resistance if not already in the trade, and always manage your risk according to your plan.
Drop your thoughts or questions below — and if you found this helpful, hit boost and follow for more structured US Oil trade ideas.
Stay sharp. Trade with precision. 🛢️📉

EUR/USD – Triangle Breakout (CPI Data ahead)EUR/USD – Buy Entry (M30- Channel Breakout Pattern)
The EUR/USD Pair, Price has been trading within a Triangle Breakout Pattern on the M30 chart, forming consistent higher highs and higher lows. Price action is now testing the upper boundary of the Pattern, signalling a possible breakout.
✅Market Context:
1️⃣Strong Upward Structure Inside the Pattern.
2️⃣Buyers are showing strength near Resistance.
3️⃣Breakout above the Trendline indicates Momentum continuation toward higher zones.
✅Trade Plan:
Entry: Buy after Confirmed Breakout above the Resistance (m30 candle close above trendline or retest of the breakout).
💰Take Profit (TP): At the Key Zone – a Major Resistance area identified ahead.
🛑Stop Loss (SL): Below the Pattern Structure.
✅Psychological Discipline :
1️⃣Stick to plan – No Revenge Trades.
2️⃣Accept losing trades as Part of the Strategy.
3️⃣Risk only 1–2% of your account balance per trade.
💬 Support the community: If you found this useful, drop a 👍 like and share your thoughts in the comments!
⚠️ Disclaimer: This analysis is for educational purposes only and does not constitute financial advice. Forex trading involves high risk. Trade only with capital you can afford to lose and always do your own research.

XAU/USD | Gold Under Pressure, Support & Resistance to WatchGold continues to trade under pressure, holding below both the MA50 and MA200, keeping short-term momentum firmly tilted to the downside. Price is currently hovering just below the 4,095 support level, with the market remaining range-bound within a broader corrective structure.
Buyers will need a confirmed break above 4,137 to trigger a potential recovery toward 4,178 and 4,234.
On the downside, the 4,042–3,987 Support Zone serves as an intermediate area to monitor for short-term reactions. A failure to hold this zone could extend the decline toward the Deeper Support Zone, which remains a major reaction area where dip-buyers are expected to re-enter the market.
📌 Key levels to watch:
Resistance:
4095
4136
4178
4234
4285
Support:
4042
3987
3944
🔎 Fundamental focus:
Gold remains under pressure as traders weigh ongoing U.S. government shutdown risks and delayed economic data, which have limited visibility into the real state of the economy.
While short-term price action remains corrective, safe-haven demand and macro uncertainty are still expected to support gold on deeper dips toward key demand zones.

big dhulai candidate KOTAK BANKStrategy – Ichimoku Cloud Setup (Daily Timeframe)
🔍Current Setup
Price is below the cloud, indicating bearish bias.
Cloud ahead is red and thick, suggesting strong resistance and no immediate trend reversal.
Tenkan-sen is below Kijun-sen, confirming weak short-term momentum.
No bullish crossover or breakout candle yet.
📌 Action Plan
Avoid fresh long positions until price closes above the cloud and Tenkan crosses above Kijun.
Watch for rejection near cloud base or resistance zones for potential short setups.
Use RSI and volume confirmation before acting on any breakout or reversal.
✅ Verdict: Bearish – Avoid for Now
Trend is weak and below resistance cloud.
No bullish confirmation yet.
Wait for breakout above cloud with volume and RSI > 55 before considering a buy.

XAUUSD Weekly Technical Forecast: Deep Dive AnalysisTraders, gear up for a pivotal week in Gold! As of the close at 4,112.84 on Oct 25th , XAUUSD is at a critical juncture. This analysis blends classic theory with modern indicators for intraday swings and positional trades. Bulls and bears are in a fierce battle ⚔️.
The stage is set for a significant volatility expansion. The key is to identify the dominant auction.
🎯 1D & 4H: The Swing Trade Panorama (Swing Bias)
The higher frames dictate the primary trend. The 1D chart shows a potential completion of an Elliott Wave corrective pattern (ABC) , suggesting a new impulsive wave up may be imminent.
Dow Theory : Higher highs & higher lows remain intact on the 1D, confirming the primary uptrend. ✅
Wyckoff Theory : We appear to be in a 'Spring' or 'Sign of Strength' phase after a re-accumulation period around the 4,080-4,100 zone.
Ichimoku Cloud : Price is trading above the Kumo (cloud) on 1D, a bullish bias. The Tenkan-sen (blue line) is a key dynamic support.
Key S&R : Major support rests at 4,080 (previous resistance, 50 EMA). Resistance is at the recent high of 4,140 .
A decisive 4H close above 4,130 could trigger a Bullish Breakout 🚀 targeting 4,180-4,200. Conversely, a break below 4,080 on high volume could see a drop to 4,040.
⏰ Intraday Focus: 1H, 30M, 15M, 5M (Intraday Bias)
For intraday action, lower timeframes offer precision entries.
Harmonic & Gann Theory : A clear Bullish Bat Pattern has potentially completed on the 1H chart. The PRZ (Potential Reversal Zone) aligns perfectly with the 4,100-4,105 support. Gann's 50% retracement level from the last swing up also converges here.
Bollinger Bands (20,2) : On the 1H/4H, price is hugging the upper band, indicating strong momentum. A squeeze on the 30M chart suggests a volatility expansion is due.
RSI (14) : On the 1H, RSI is in the 55-60 range, showing healthy momentum without being overbought. Watch for bearish divergence on a new high as a reversal signal.
VWAP & EMA Confluence : The 20 and 50 EMAs are providing dynamic support on pullbacks. For day trades, the VWAP on the 15M/5M charts will be your best friend for trend alignment. Long above, short below.
🚦Trade Plan: Entries, Exits & Risk Management
Identifying reversals is key. Use Japanese Candlesticks at key S&R levels. A bullish engulfing or morning star pattern at the 4,100 support, confirmed by a rising volume spike, is a high-probability long signal.
Swing Long Entry : On a 4H close > 4,130, or a pullback to 4,100-4,105 with bullish confirmation.
Swing Short Entry : On a 1D close < 4,080, targeting 4,040.
Intraday Long : Buy on a bounce from VWAP/20 EMA on the 15M chart with RSI > 50.
Intraday Short : Sell on a rejection from the 4,125-4,130 resistance with a bearish RSI divergence.
Stop-Loss : Always 15-20 pips below/above your entry trigger candle.
💡The Bottom Line:
The bullish structure is favored as long as 4,080 holds. The confluence of Harmonic patterns, Wyckoff accumulation, and bullish Ichimoku alignment points to a potential leg higher. However, respect the levels. A break below support will invalidate the bullish thesis.
Track these charts live:
1D:
4H:
1H:
30M:
15M:
5M:
⚠️ Disclaimer: This post is educational content and does not constitute investment advice, financial advice, or trading recommendations. The views expressed here are based on technical analysis and are shared solely for informational purposes. The stock market is subject to risks, including capital loss, and readers should exercise due diligence before investing. We do not take responsibility for decisions made based on this content. Consult a certified financial advisor for personalized guidance.

What is the prediction for EUR/USD for 2025 ?As of October 25, 2025, the current price of EUR/USD is 1.16258. The pair is currently sitting in a support zone and remains in a clear bullish trend.
However, when the price reaches a support zone, false breakouts are common, and sometimes the trend may even reverse downward.

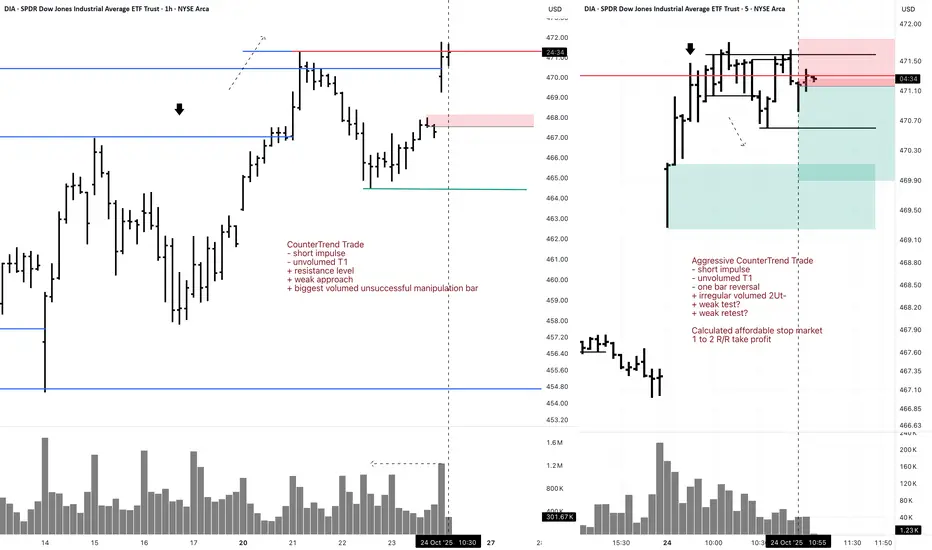
DIA 5M Short Aggressive CounterTrend DayTradeAggressive CounterTrend Trade
- short impulse
- unvolumed T1
- one bar reversal
+ irregular volumed 2Ut-
+ weak test?
+ weak retest?
Calculated affordable stop market
1 to 2 R/R take profit
1H CounterTrend
"- short impulse
- unvolumed T1
+ resistance level
+ weak approach
+ biggest volumed unsuccessful manipulation bar"
1D CounterTrend
"- short balance
+ expanding CREEK
+ weak approach"
1M countertrend
"- long impulse
- neutral zone
+ exhaustion volume?"
1Y CounterTrend
"- long impulse
+ beyond rotation point
- neutral zone"